Killed in Action in Iraq, State by State

The Iraq War is over. And now it is time to reflect on what we have gained and what we have lost. This map by the Guardian details the number of soldiers killed in action in Iraq. (Other options include total wounded, killed by non-hostile, &c.)
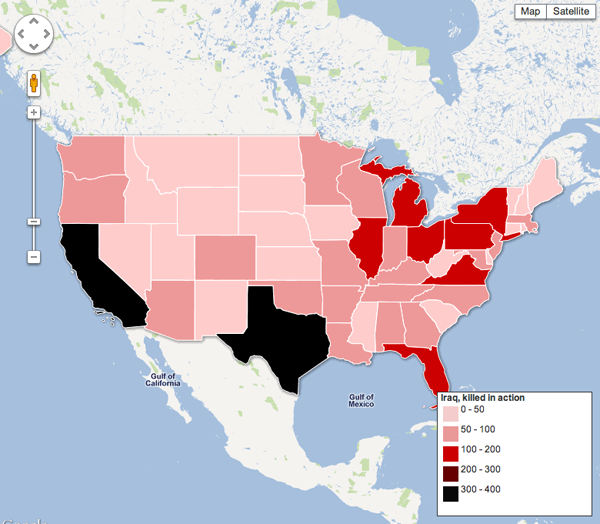
Killed in Action in Iraq by State

Unfortunately, I call it a ‘no kidding’ type of map. The data, accessible via the Guardian here, corresponds nicely with a list of states by total population. Of the top ten countries in KIA, only Virginia is not among the top ten in population; it is 12th. The country thus not in the top ten in KIA, but in population is North Carolina. It’s rank in terms of KIA? 11th.

The data is interesting and worth depicting if we are to reflect. But, perhaps a more suitable visualisation could have been chosen.

On a personal note, these Google Maps overlays are annoying when, in the cases of, e.g., Wisconsin and Massachusetts, the shapes are incorrect. Perhaps coastlines are not as easy as states with ‘straight lines’ for boders, but we would do well to try and make irregular coasts at least somewhat correct.

Technology Today

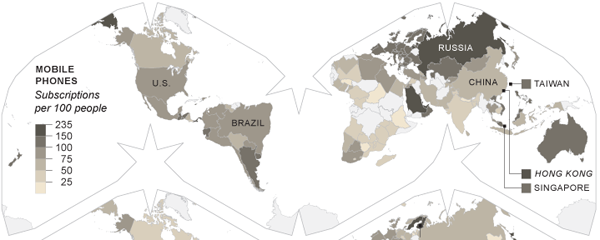
Technology changes and changes rapidly. The United States led the way with cabled phone networks. Now, countries in Africa are skipping landlines and moving straight to mobile phones. The New York Times has an piece on the changes in technology and accompanies that piece with small multiples of choropleth maps that showcase different technologies and their prevalence.

Mobile Phone Subscriptions

What is interesting about these maps is that the Times eschewed the conventional Mercator or Robinson map projections and went with a slightly more unusual layout. But, a layout that saves some space by its contortion of the world’s oceans. Was their reason spatial or something more about maintaining consistent area? I would be curious to see the piece in print to see if it needed to fit a narrow column.

All in all, an interesting set of maps.

Campaign Ad Spends

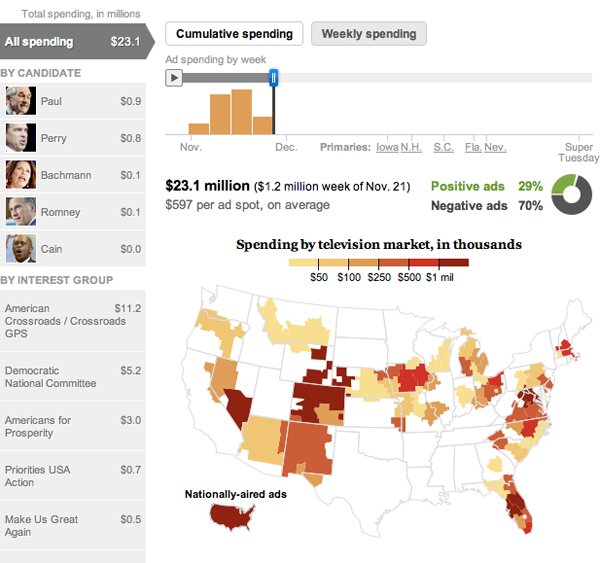
I don’t know about you, but to me, it’s beginning to look a lot like campaign season. At least from what I read on the internet. Because, according to this interactive piece by the Washington Post, there has been little local campaign spending on ads in the Chicago television market.

Mad Spending
Mad Spending

By clicking on the left, you are able to see the spending amounts and spending places of ads by both personal campaigns and interest groups. For national ad campaigns, there is a small outline of the continental US in the bottom left.

Above the map you have some facts about the spending and spending over time and a curious bit about whether the ads are positive or negative. Already if you move from the beginning to now, you can watch the positive ad number slip.

Much Improved Mapping of American Migration

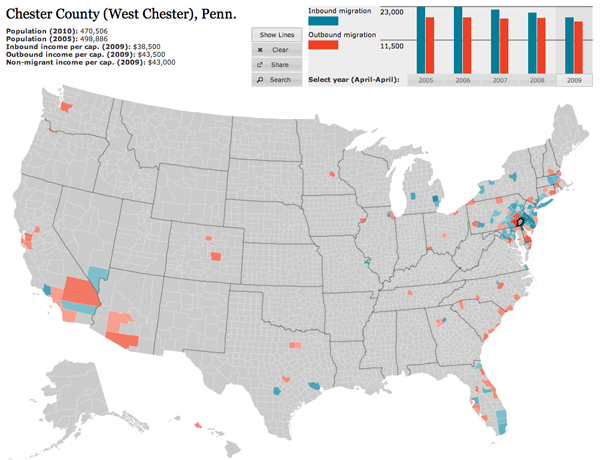
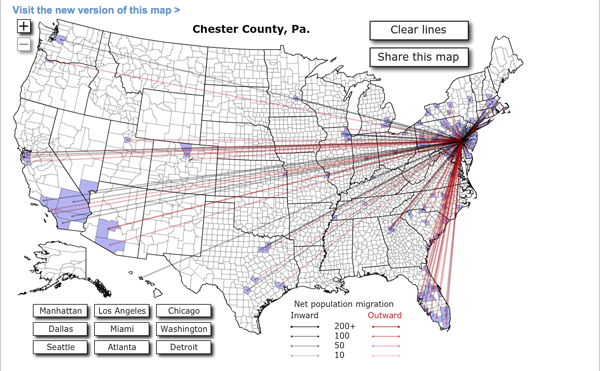
Forbes released Jon Bruner’s latest map of migration in the United States. It uses IRS figures to show inbound and outbound movement from counties across the United States. The work itself is an improvement from his map from last year, which was a bit more difficult to read. Beneath is the new version, and at the end, for comparison, the old.

This year's migration map

Firstly, the colour palette is far more sophisticated. Secondly, and most crucially, the user can hide the lines on the map, which obscures a key part of the story of migration in urban areas—higher income people moving out of the city and into the suburbs. Thirdly, the map data now includes additional years, which are available by clicking the small chart in the upper right—a welcome addition that allows the data from last year’s map to become accessible this year. Fourthly, and to be fair this may have existed previously but not that I can recall, the new map is accompanied by essays.

These essays use the map and its data to tell stories and explain what one sees going on with the data. It is (relatively) easy for one to put together a piece of data visualisation from a data set. But, without knowing where to look, users may not actually find anything valuable in the visualisation. By pointing to these essays, the map—already much improved from a design perspective—takes on a much more rounded and mature character and becomes more about generating information and knowledge than simply figures and statistics.

Last year's migration map

Income Segregation in the Philadelphia Metro Area

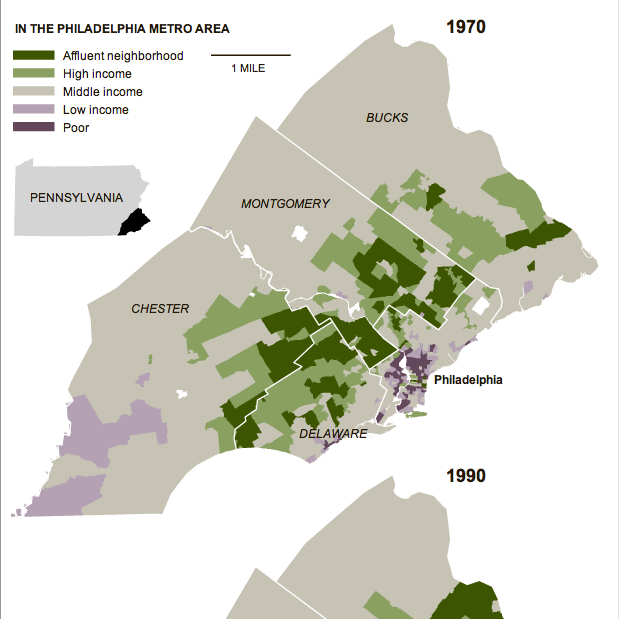
In an area very close to me…quite literally…the New York Times published an article about increasing segregation between the rich and the poor via the areas where they live. The study by Stanford University found that the Philadelphia metropolitan area saw the “sharpest rise” in segregation since the 1970s—the study used census data available through 2007. The accompanying graphic highlights the growth of the segregation from 1970, using small multiples of choropleths to compare 1970 to 1990 to 2007.

In 1970, much of the metro area was middle-income neighbourhoods. Certainly, the central core of Philadelphia was depressed. So too was Chester and rural southwestern Chester County. The upper-income neighbourhoods were in the close suburbs, note the townships stretching due west of the city and you see the Main Line, one of the most affluent areas of the United States, while other veins of wealth extend along other old rail lines leaving the city.

Neighbourhoods by Income in 1970

Those such as myself who are familiar with both the area and recent history should note that places like Coatesville and Downingtown are shown as middle-income. In the 1970s, areas like this and in similar places like Falls Township in Bucks County had robust steel and manufacturing sectors that employed a substantial portion of the local population.

But, compare this to 2007 and you will begin to see how many old factory towns of middle-income areas became dense pockets of depression while the city of Philadelphia itself saw a flight of wealth to the rest of the suburbs. The rural parts of Chester, Montgomery, and Bucks have seen high growth by means of new developments of upper-middle- and upper-income homes.

Hispanic Growth in the Plains

There is a scene in the re-imagined Battlestar Galactica where with the human population almost extinct, one character comments on the romances of two others by saying “they better start having babies”.

The demographics of the United States are changing. Not that they were not changing prior to recent years; Native American populations were reduced by English and Scottish settlers; the English and Scottish populations were diluted by Germans; then came the Irish and the Italians; then the Slavs; then Chinese—simplistic, but you get the idea.

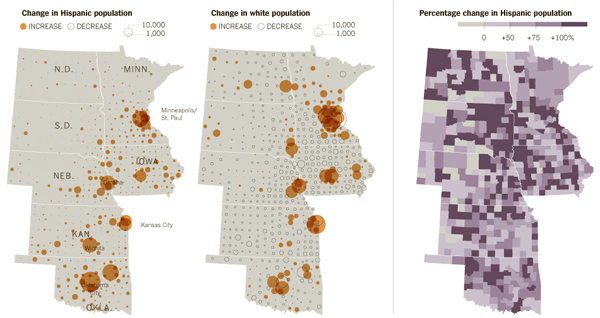
Now, in the Midwest, as the New York Times reports in both an article and its supporting graphic, the long-established relative decline of the United States’ white population is being checked by a surge in Hispanic growth, especially in the rural plains states.

Hispanic Growth in the Plains

I am never so much a fan of the circles as sizes of population—a choropleth would have worked equally well—but it does suffice for this graphic. My larger concern is that the graphic measures growth but does not state growth between what years. Presumably, though the data is sourced from Queens College Department of Sociology, it originates in census figures. That would most likely mean growth between 2000 and 2010.

The Country’s Most Violent States

Do you live in a horribly violent and crime-afflicted state? Do you want to know? Well there’s a map for that.

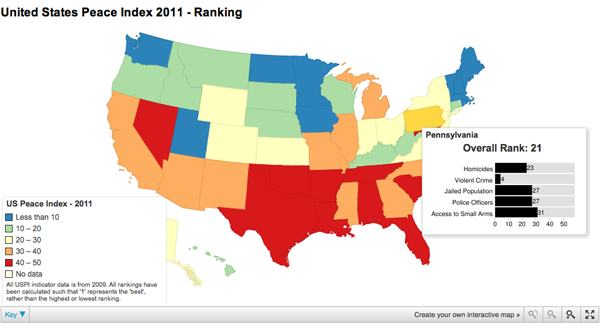
US Peace Index Map
US Peace Index Map

From the Guardian, here we have a familiar choropleth that colours each state based on where it falls into the range from most peaceful, Maine and Vermont, to the the most violent, Louisiana and Tennessee. The map was developed using a site called chartsbin from data provided by the Global Peace Initiative.

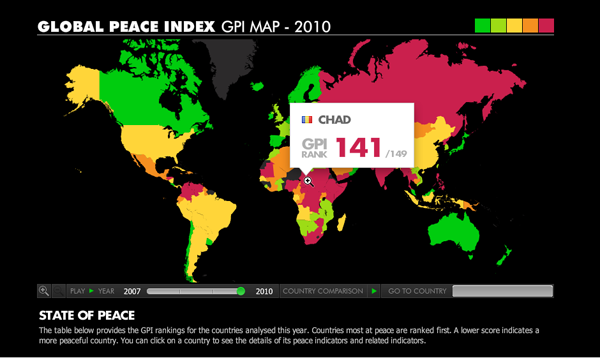
In short, nothing fancy, but an interesting topic to visualise after the earlier world rankings. Truth be told, I think the added data in the rollover state for the US states is more meaningful than the big rank number and flag that appears in the global version.

Global Peace Index
Global Peace Index