Oil.

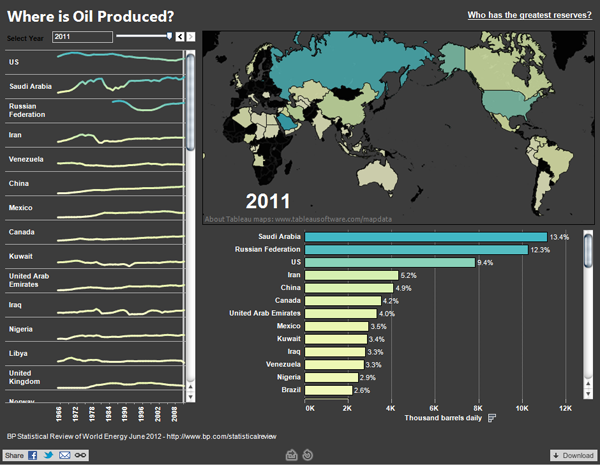
Oil, sweet oil. How we depend upon you for modern civilisation. BP published a report on world energy that Craig Bloodworth visualised using Tableau.
Oil production
Oil production

The piece has three tabs; one is for production, another consumption, and a third for reserves. (The screenshot above is for production.) But when I look at each view I wonder whether all the data views are truly necessary?

In production for example, is a map of a few countries truly informative? The usual problem of Russia, Canada, the US, and China dominating the map simply because they are geographically large countries reappears. Furthermore the map projection does not particularly help the issue because it expands the area of Siberia and the Canadian arctic at the expense of regions near the Equator, i.e. the Middle East. That strikes me as counter-intuitive since some of the largest oil producers are actually located within the Middle East.

A map could very well be useful if it showed more precisely where oil is produced. Where in the vastness of Russia is oil being sucked out of the ground? Where in Saudia Arabia? In the US? Leave the numbers to the charts. They are far more useful in comparing those countries like Kuwait that are major producers but tiny geographies.

Lastly about the maps (and the charts), the colour is a bit confusing because nowhere that I have found in my quick exploration of the application does the piece specify what the colours mean. That would be quite useful.

Finally, about the data, the total amount of oil produced, but more importantly consumed, is useful and valuable data. But seeing that China is the second largest consumer after the US is a bit misleading. Per capita consumption would add nuance to the consumption view, because China is over three-times as large as the US in population. Consequently, the average Chinese is not a major consumer. The problem is more that there are so many more Chinese consumers than consumers in any other nation—except India.

A bit of a hit and miss piece. I think the organisation and the idea is there: compare and contrast producers and consumers of oil (and consumers of other energy forms). Alas the execution does not quite match the idea.

Credit for the piece goes to Craig Bloodworth, via the Guardian.

The Election in the Burbs

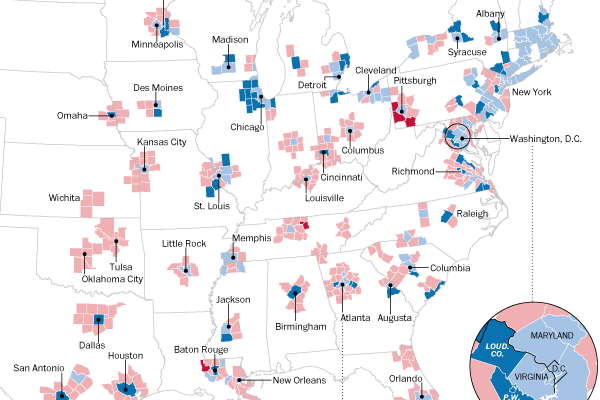
One area of particular contention for the American presidential candidates this year will be in the suburbs of major urban areas. This was where Romney in particular was able to defeat his Republican rivals, but is also home to large number of potential Obama supporters. Given his likely support in cities, Romney will need to well in the suburbs this time around.

The Washington Post looks at how suburban counties voted over the past two elections.

Cropping of the map
Cropping of the map

Credit for the piece goes to Ted Mellnik, Laura Stanton, and Karen Yourish.

The Greeks Voted Sunday Too

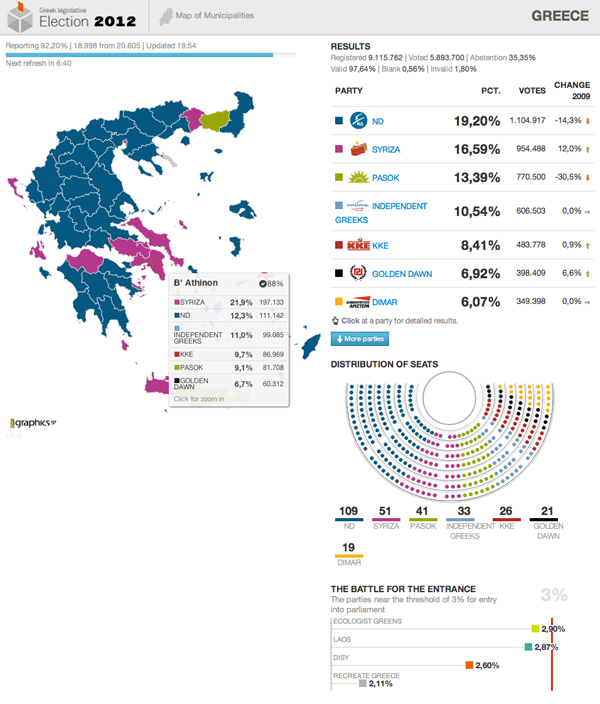
Over at the Guardian, I was using this interactive piece from igraphics to follow the election results there. (It was a slight bit more interesting than following the French presidential election, because everybody knew Sarkozy was going to lose.)

Greek election results

Credit for the piece goes to igraphics, a Greek data visualisation outfit.

Santorum Quits. Goodbye…and Thanks for all the Varicose Veins.

So Rick Santorum is now out of the race. Mitt Romney is basically now set to run against the President. But why should Santorum go out without an infographic looking back at the Republican primary race. (Since neither Newt nor Ron come even close to running the same race as Rick.)

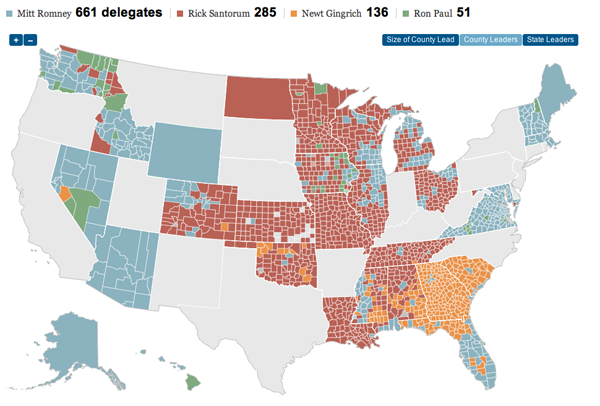
The New York Times put out an infographic looking at Rick Santorum’s campaign. And as one can see, he did do well in the evangelical and Christian conservative heartland of the United States. It just was not quite enough to beat Romney’s supporters.

County leaders in Republican primary states

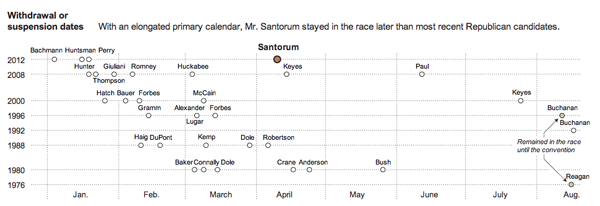
But, Santorum did manage to last longer in the race than many others have in recent years. So who knows, depending on how the election in November turns out, we may just see more of Rick in the future.

A timeline of withdrawal

The First Rule Is You Don’t Talk About It

There are two things one is not supposed to discuss in mixed company, and let us face it, the internet is some rather mixed company. One of those things, politics, I frequently mention and bring up on this blog. The other, religion, I do not.

Until now. (I think.)

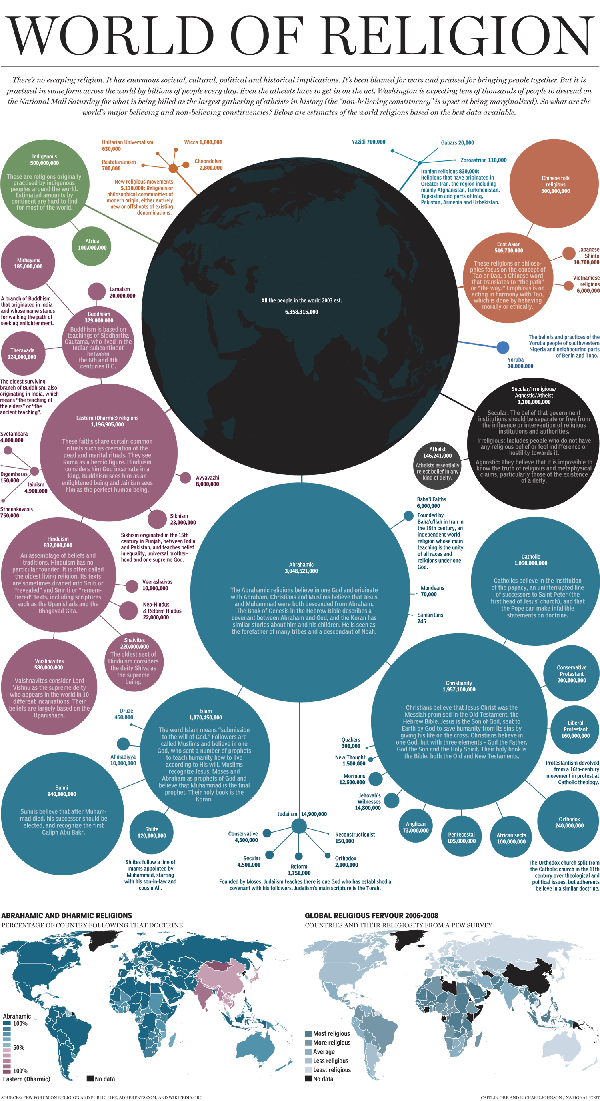
From the National Post comes this work on the size and distribution of the world’s religions.

World religions
World religions

Credit for the work goes to Richard Johnson.

21st Century Prohibition

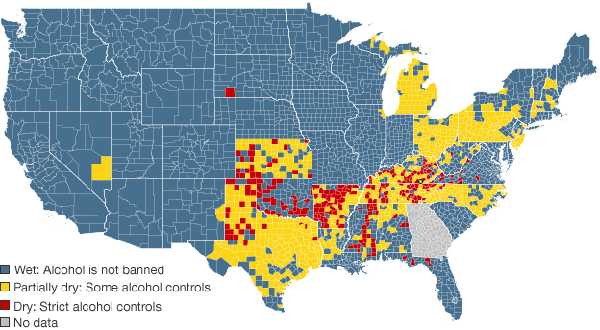
This map comes from the BBC, which investigates prohibition in the 21st century at the local level, as the national policy ended in the early decades of the 20th century.

Dry vs Wet Counties
Dry vs Wet Counties

Credit for the map goes to John Walton, Harjit Kaura, and Nadzeya Batson.

Heritage Maps

From FlowingData comes a post to an interactive piece by Bloomberg that looks at the geographic distribution of different heritage—read heritage, neither race nor ethnicity—groups. (Its choice of groups, however, is slightly contentious as it omits several important ones, including African-Americans.)

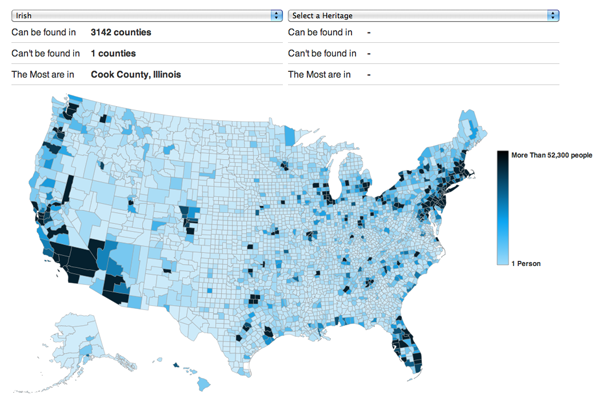
I would say that a typical map like this would simply plot the percent of each county, state, or other sub-division for the selected heritage group. Much like below, as I chose the Irish.

Irish heritage
Irish heritage

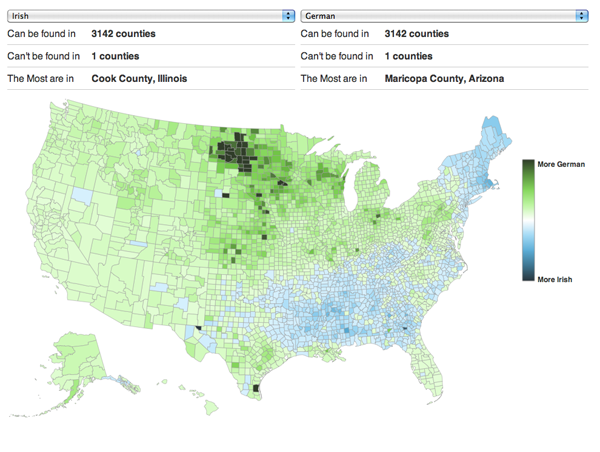
Bloomberg’s piece is a bit more interesting than that because of the ability to compare two groups, to see where they overlap and where they diverge. In doing so, they created a divergent choropleth that can show the subtleties and nuances of settlement patterns.

Irish vs German
Irish vs German

Credit for the piece goes to David Yanofsky.

And the Award Comes From…an Old White Male. Most Likely.

So apparently last night actors, directors, and others associated with the production of films won little statues. (And then probably celebrated with fancy foods and wines.) Yes, last night was the Academy Awards. But who is this Academy that decides upon the best films and performances?

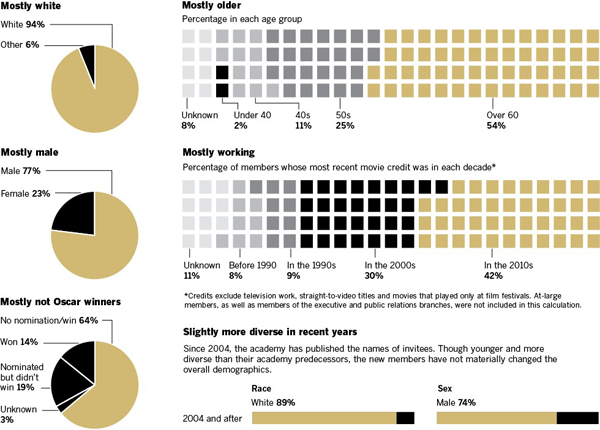
As it turns out, the demographics of the Academy do not quite mirror those of the broader country. Just over a week ago, the Los Angeles Times looked at the Academy and visualised its membership, discovering the details of which was itself a journalistic feat.

The demographics of the Academy of Motion Picture Arts and Sciences

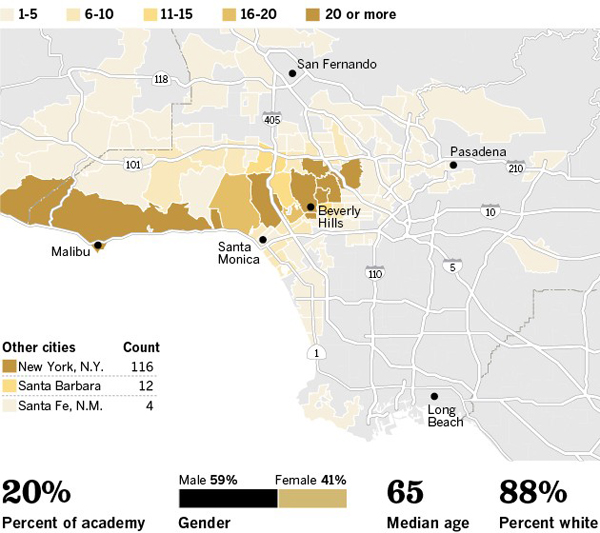
After a broad overview with pie charts and such, each branch was mapped as a choropleth to the Los Angeles area. Those members from outside the LA metropolitan area were given small squares to represent their cities.

Where the actors live

As someone not at all familiar with Los Angeles and its neighbourhoods, perhaps where the members of the various branches of the Academy live is actually somewhat interesting. However, I fail to understand the value in that. More useful is the idea of breaking out a socio-economic demographic and mapping that data. And if that had been the case here we almost have a set of small multiples. These are just a bit big.

Overall, a solid body of work.

Credit for the visualisation piece goes to Doug Smith, Robert Burns, Khang Nguyen, and Anthony Pesce.

Adding Guided Context to Maps

Maps are cool. They show the geographic distribution of data. And that is fantastic if there is a story in said distribution. But even if there is a story, sometimes given both the scale of the map and the amount of data encoded in the map, how could you possibly expect to find the story? Which little region of the map do you search to find the interesting nuggets?

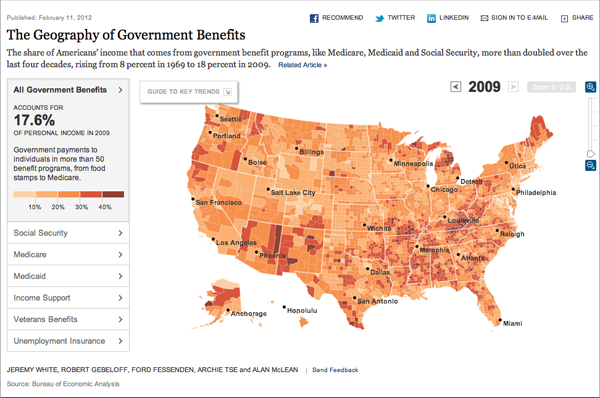
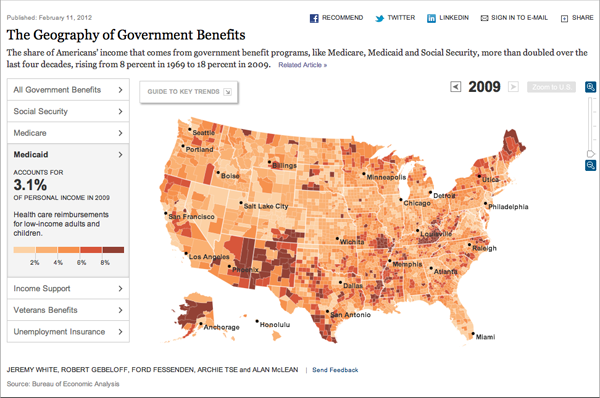
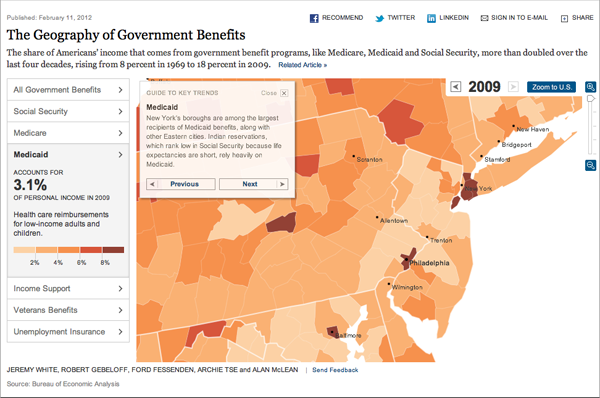
On Sunday, the New York Times published an interesting solution to that very quandary. The context is an article looking at the anger and resentment felt by some towards government assistance via the social safety net, and yet how these very same people depend upon that safety net through programmes like Social Security, Medicare, Medicaid, &c. The map, a choropleth, examines several different metrics that comprise government assistance, e.g. Medicaid payments as a percentage of income.

Government benefits overview

One can easily toggle through the various metrics at the scale of the entire United States. This is a rather standard feature for such maps. However, in the upper-left corner, the designers placed a ‘guide’ that provides context and stories for each metric. But, not only does the guide provide text to support the map, but it zooms in on specific areas and regions that then support the text and best exemplify the point.

Here we see the map of the whole US for Medicaid, which appears to be scattered pockets of higher percentages. Interesting perhaps, but the user likely has few ideas as to what that visualisation actually means.

Medicaid's broad overview

Compare that to the guide’s view of the map, which focuses on the large cities on the East Coast.

Medicaid's eastern core context

Providing context and guiding a reader/user through the stories contained in the map, or at least those deemed interesting by the designers and editors, is an interesting solution to the problem of finding the story in maps such as these. However, by moving away from a strict visualisation of the data, the New York Times and others that try similar avenues introduce human biases in the story-telling that may otherwise be unwanted or distracting.

Credit for the piece goes to Jeremy White, Robert Gebeloff, Ford Fessenden, Archie Tse and Alan McLean.

Florida Primary

The Republican primaries…they’re still going on…on the long inevitable road to Romney’s coronation. Next up is Florida, always an interesting state to watch. There are a lot of people there with a whole host of interesting demographic slices. Perhaps one of the most interesting ones, at least to the media, is the Hispanic vote. Other things to look at in Florida include the burst housing bubble and rather high unemployment.

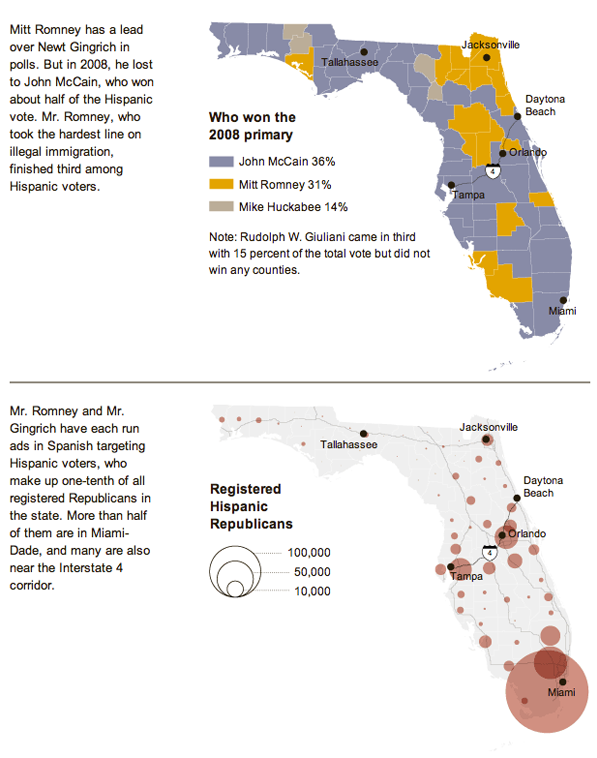
The New York Times published a graphic with a few maps and charts trying to paint the landscape of the Florida primary battle. These two selections below show which Republican primary candidates won which counties in 2008 as well as the size of the Hispanic population registered Republican.

Florida primary landscape

Credit for the piece goes to Haeyoun Park.