Space. Something About a Frontier?

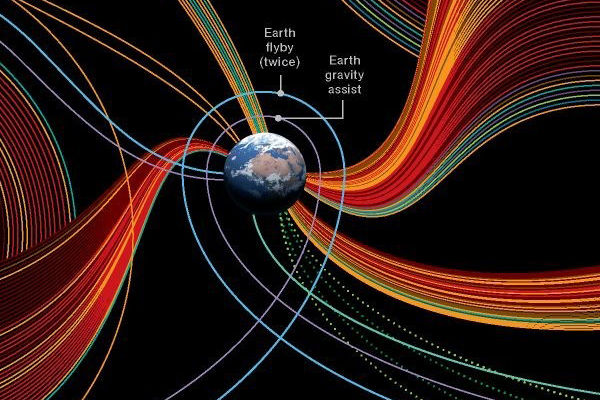
Today’s post comes via one of my co-workers. I don’t have any information on it other than it being an infographic looking at our exploration of the solar system (and in the near future beyond, thanks Voyager). My guess is that it isn’t particularly new, as I would imagine that the designer would have liked to have called out the Curiosity mission that just landed on Mars. But so far as I can tell, that mission is absent from the infographic.
We Start at Earth
We Start at Earth

Hurricane Isaac vs Hurricane Katrina

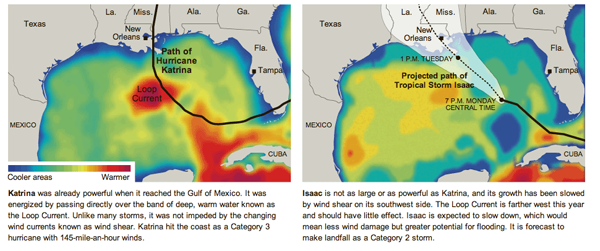
I live in the Midwest but I grew up on the East Coast. I spent my summers at the Jersey shore. (No, not that one.) I know a thing or two about hurricanes. Isaac is expected to make landfall later today in the New Orleans area almost seven years to the day when Katrina made landfall. There are some notable differences between the two storm systems and the New York Times has attempted to elucidate those important distinctions in this graphic.

Differences
Differences

Red Sox–Dodgers Trade

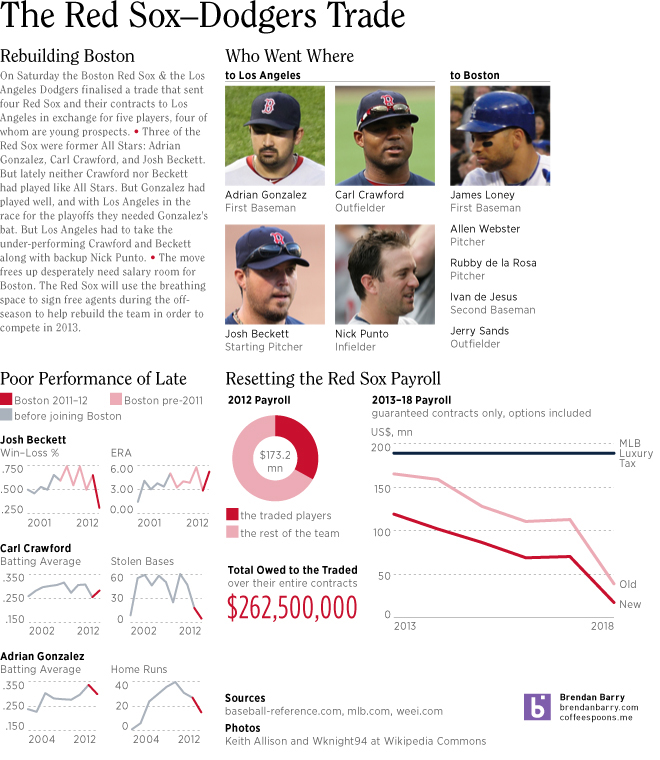
There was a lot of news this past weekend. So we’ll start with the important stuff first. An infographic about the big baseball trade between my Boston Red Sox and the Los Angeles Dodgers. The advantage of a story breaking over the weekend is time to get something together for Monday.

The Red Sox–Dodgers Trade

Opportunity

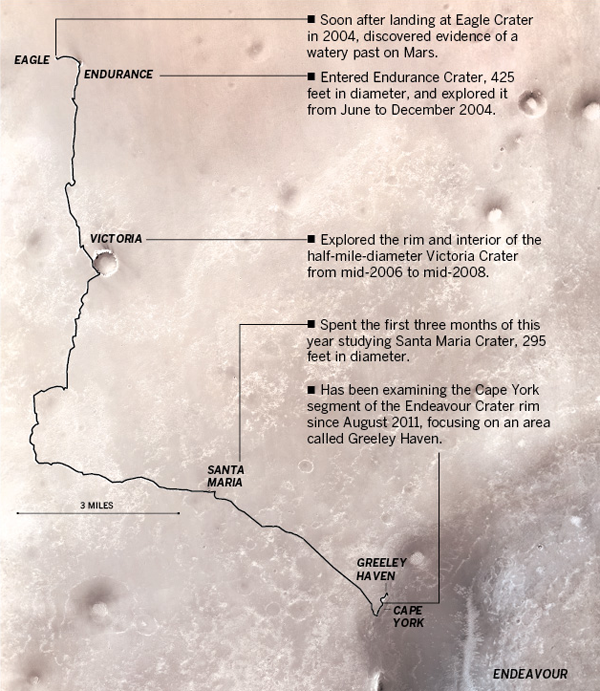
Curiosity is not the only rover on Mars, eight years after a 90-day mission, we still have Opportunity rolling around. The Los Angeles Times published this graphic detailing the exploration conducted by Opportunity. This is a map of Opportunity’s section of Mars.

Path of Opportunity
Path of Opportunity

Credit for the piece goes to Julie Sheer, Lorena Iñiguez, Raoul Rañoa, and Anthony Pesce.

Obama Administration Failing on Mortgage Modifications

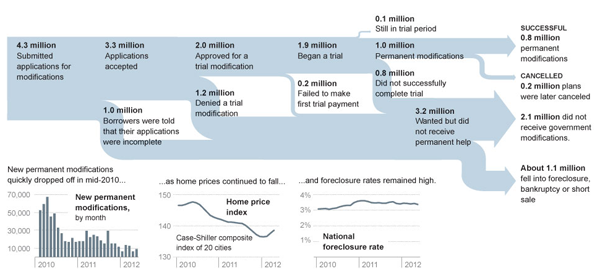
Today’s post features a Sankey diagram from the New York Times that looks at how the Obama administration has been failing to help homeowners with mortgage problems. Less than 25% of applicants have seen successful modifications of their home loans. The diagram here clearly shows the process and the failures that have led to so many Americans not receiving the help they sought.

Sankey
Sankey

Credit for the piece goes to Alicia Parlapiano.

World Bank—Mobile Phones

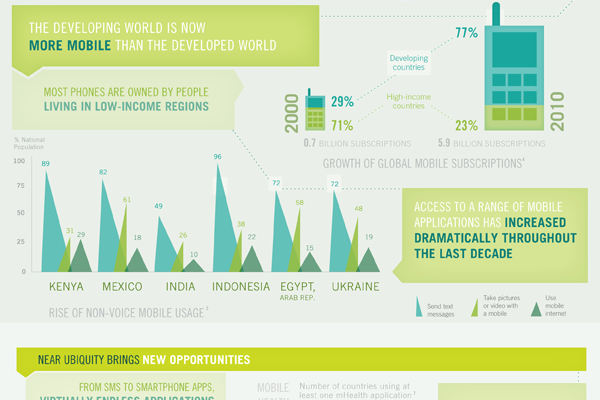
A little while ago the World Bank, generally a rich-country club that doles out loans to the developing world, published an infographic looking at mobile phones and their presence in the developing world.

The piece supplemented a report and is rather large. It actually exists as two separate images. The cropping below focuses just on how people in the developing world use mobile phones. Overall the piece is a bit weak in terms of data visualisation types and some of it is a bit confusing, but the story is clearly worth telling. And fortunately there are more hits than misses.

Developing world usage


Patrolling the US–Mexican Border

If you haven’t heard, we share a border with Mexico. And we patrol it. And the Washington Post published a graphic looking at the patrolling of the US–Mexican border.

Border patrol staffing

Credit for the piece goes to Anup Kaphle and Bill Webster.

Missions to Mars

Curiosity shall soon be exploring the surface of Mars seeking to understand the geological history of the planet. But in this infographic, see the cropping below, from the National Post we can see previous missions to Mars. We have not always been successful in operations in and around Mars, but our recent track record is much improved.

Missions to Mars
Missions to Mars


Credit for the piece goes to Mike Faille.

The Muslim World

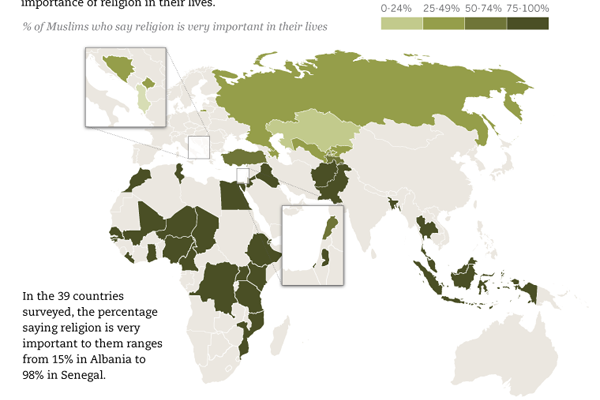
Today’s post comes via a co-worker of mine and is from the Pew Research Center’s Forum on Religion and Public Life. The infographic is of the long-running image type, but in this case is neatly sliced into digestible morsels of tasty infographic-ness. Below is a cropping of the longer piece. It looks at how Muslim populations in different countries feel about the importance of their religion in their daily life.

The Muslim World
The Muslim World

How the UK Got to the 65 Medals We Correctly Predicted

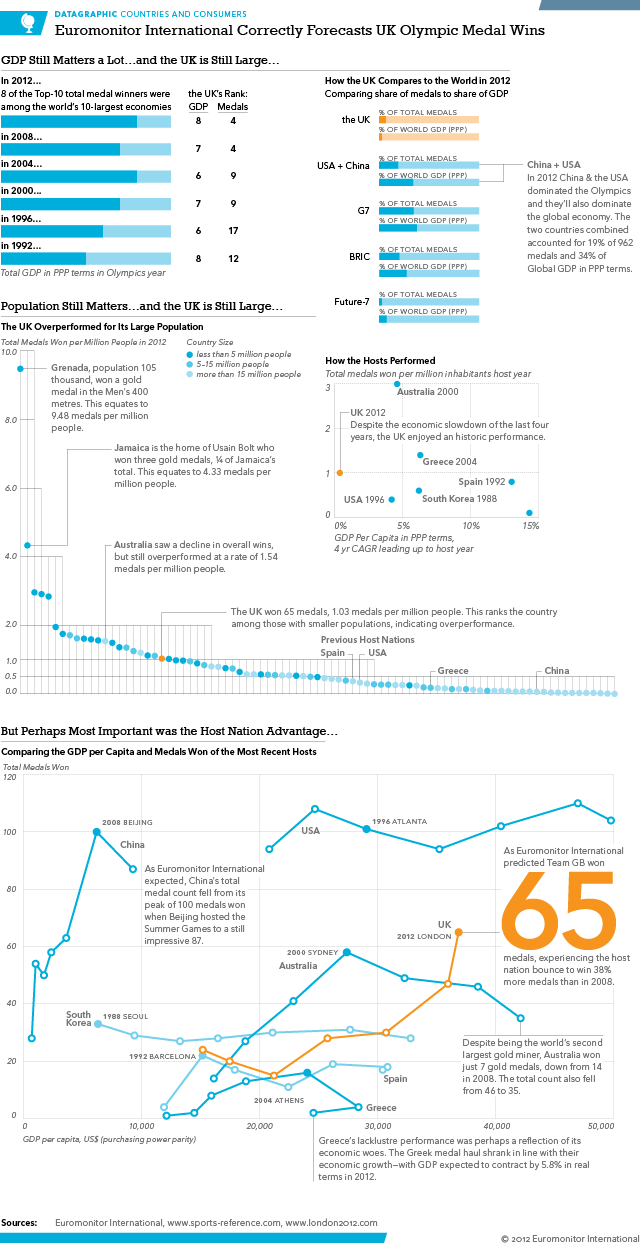
So the Olympics are over. But before they began, I and some co-workers made a prediction about how the United Kingdom and their Team GB would perform. We predicted 65 medals. How did the United Kingdom fare? They won 65 medals. This is a follow-up infographic about what made the United Kingdom a winner at the 2012 Summer Games. It’s a bit larger than the first version, but this one also includes new data and revisits some of the earlier themes.

Another important (and correct) prediction was that China would slip and not reach 100 medals. This should happen after experiencing the host nation bump. While we did not create a number for China, they scored only 87 medals. Another correct prediction.

We Nailed the Prediction of 65 Team GB Medals

All in all a very successful series. (Created for my employer Euromonitor International, as the usual disclaimer goes.)