Finnish Election Results

Finland held an election that was worth watching because of the rise of a nationalist party whose name translates to True Finns. The leader of the True Finns was interviewed and at the end he reassured all watching that they “are not extremists. So you can sleep safely.” For Europe, the issue is their opposition to the bailouts of the various European economies, such as Ireland and Greece. And now that Portugal is in the midst of bailout negotiations, the True Finns could complicate matters if they manage to make it into government.

The Finnish Ministry of Justice released a small, interactive piece detailing the results. The parties are represented by acronyms, with PS for the True Finns. And here one can see that they performed third-best with about 19% of the vote. The True Finns actually beat the Centre Party, which was the leading party in the last coalition government. In short, a remarkable rise whose impact is yet unknown.
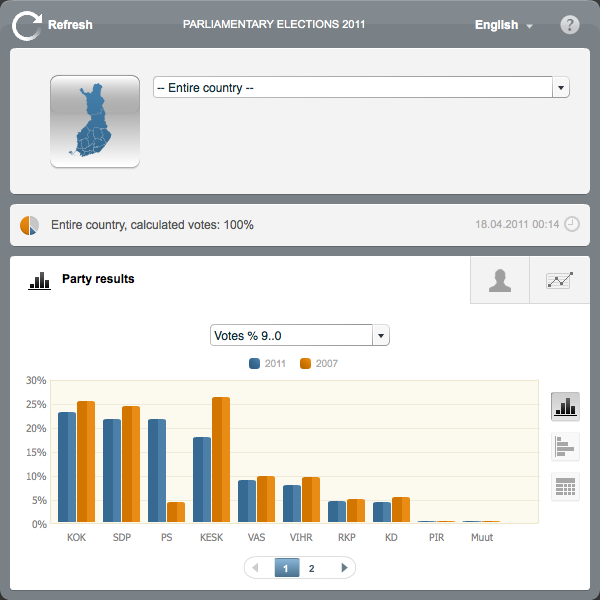
Overall Vote in Chart Form

The interactive piece, however, is a tad confusing. While one story is certainly the improvement of the True Finns from the last election to the current one, does that need to be shown in the default view as we have here? And what I perceive to be shading or some sort of split colouration in the bars lends itself to the idea of having two separate sets of data encoded in the bar. Although I can see no such data and am thus confused.

But, fortunately, one can also change one’s views of the data, from column to bar to table. And I daresay that the table, in this instance, I find best. Not because the data could not be visualised in an interesting, compelling and comprehensible fashion, but because it was not.
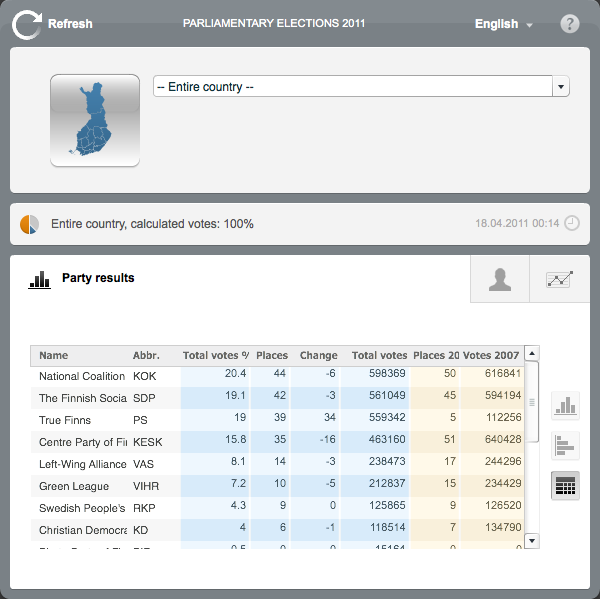
Overall Vote in Table Form

Certainly, the election results provide interesting data sets. And in this case we clearly have an interesting story, the rise of the True Finns from a small, rural party of 5 seats in the Finnish parliament (200 total seats) to the third-largest party with 39 seats. Alas, this piece leads does not make it easy to tell that story—let alone the results of the election.

The Country’s Most Violent States

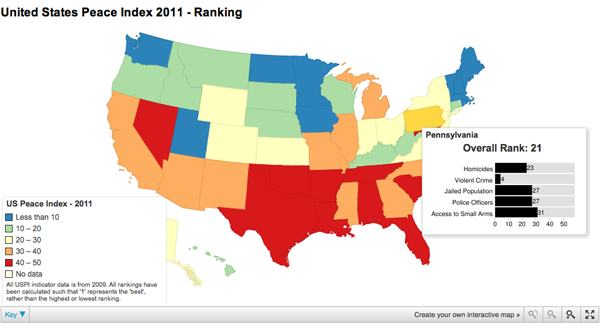
Do you live in a horribly violent and crime-afflicted state? Do you want to know? Well there’s a map for that.

US Peace Index Map
US Peace Index Map

From the Guardian, here we have a familiar choropleth that colours each state based on where it falls into the range from most peaceful, Maine and Vermont, to the the most violent, Louisiana and Tennessee. The map was developed using a site called chartsbin from data provided by the Global Peace Initiative.

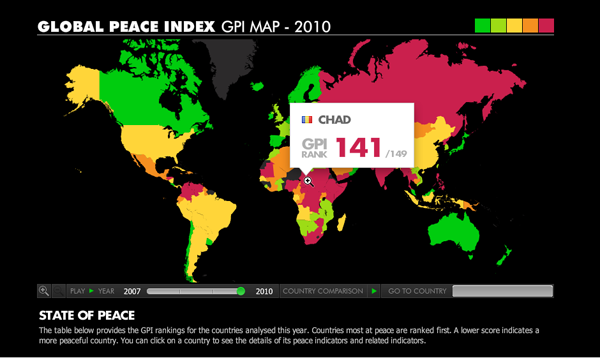
In short, nothing fancy, but an interesting topic to visualise after the earlier world rankings. Truth be told, I think the added data in the rollover state for the US states is more meaningful than the big rank number and flag that appears in the global version.

Global Peace Index
Global Peace Index

Shutting Down Nuclear Reactors

Japan has updated the the threat level from the Fukushima Plant from five to seven. And while everyone ought to put Fukushima into context, chiefly by looking at the damage facing the rest of the country, we can also see that, broadly, things worked as expected at the power plant. They just did not build the plant to survive the 48ft-high tsunami waves and 9.0 earthquakes that happen perhaps once every thousand years. Very poor planning indeed.

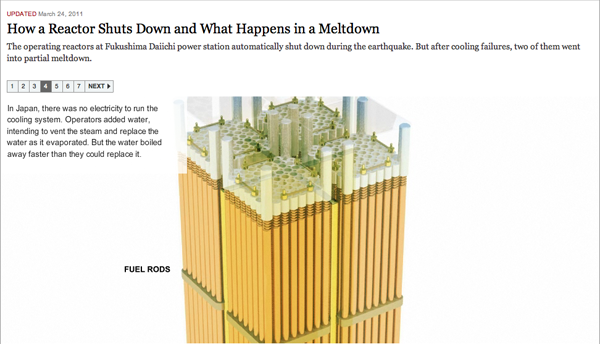
This is an older, albeit by a few weeks, graphic from the New York Times explaining how a reactor is ‘shut down’ and then, failing that, what a meltdown is. And most importantly, how the meltdown of a modern reactor design is far different from that at Chernobyl.

Shutting Down a Nuclear Reactor

Credit for the piece to Xaquín G.V., Bill Marsh, Dylan McClain, and Graham Roberts.

Little Red (or blue or yellow or light-blue) Riding (neighbour-)Hoods

While not new news, if you have not heard, Canada’s minority government fell and Canada is having an election. And, as we all know, elections mean infographic insanity. Map mania. Graphs galore. You get my drift.

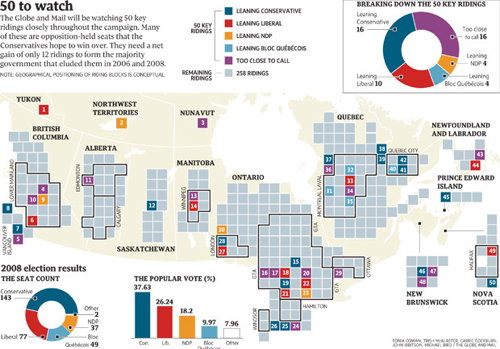
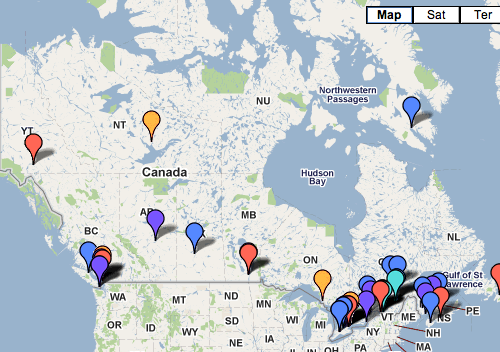
The Globe and Mail, a Toronto-based newspaper, printed an infographic about the 50 ridings to watch. (A riding is, for my mostly US-based readers, similar to a congressional district.) They complemented this with an online, interactive piece. They did all of this a few days ago.

the print version
the print version

I have been meaning to write about this for a few days, but am only now sitting down to write it up and an interesting thing has happened. Whereas before, I was able to click the Globe and Mail’s link to their print graphic, now I get directed to their Google map pushpin overlay. Bye-bye, print graphic.

online version
online version

And that is a shame, because, the print graphic is far better than the interactive. Yes, the pushpin can be clicked to read a small snippet of summary about the riding, however, at the same scale of print graphic, good luck finding all the pushpins. And while one can certainly zoom-in to find all the urban ridings, one loses seeing the whole and that riding’s relationship to the rest of Canada. Compare that to the print graphic where equally-sized boxes represent the ridings, and the boxes are spread out across a map of Canada in the background, showing the total apportionment of ridings to the provinces and territories. Whereas the pushpins do not. The arrangement of the boxes also has urban ridings grouped together and delineated from more rural ridings. Whereas the pushpins do not. And the boxes are not tied specifically to a point. Whereas the pushpins are. And that is most helpful, because one can only assume that the Western Arctic riding is located inside Yellowknife’s city hall. Right?

Pushpins are great for locating a specific point. Note the point of the pin. The boxes are great for eliminating the distorting effects of electoral districts in rural vs. urban settings. For comparison, look at the congressional districts in and around cities like New York and compare them to those in places like Montana.

I think the print graphic is better also because it included three charts that summarised and provided context of the 50-key ridings in the context of the whole general election across Canada. Google’s pushpin map overlay thing…does not.

Is the print graphic perfect, no. As I noted above, it does not specifically name the 50, as one can discover by clicking on the pushpins. Nor does it provide the name of the candidates or a very brief summary of the situation, as one can discover by clicking on the pushpins. But I have a better grasp of how the little piece fits into the whole from the print graphic.

Perhaps the best solution would have been to create a unique interactive piece that married the best of both designs. Scrap the Google maps bit and create a set of interactive boxes that mirror the print graphic, and so by clicking on the boxes one can access the same information in the pushpin. And then one would also have a reason to write something in the print article about checking the website for the online version that has even more information. But that is surely crazy talk.

As an additional point of comparison, the two screenshots are both roughly the same size in width—the main concern in showing all of Canada—and just note the amount of data presented in both versions.

A more interesting question, though, is why was the print graphic was removed from the site? (Or at least made so difficult to find that I could not find it.)

Credit for the print graphic image I have is to the Map Room, which is from where I first learned of the map to begin with.

Complex Nigeria

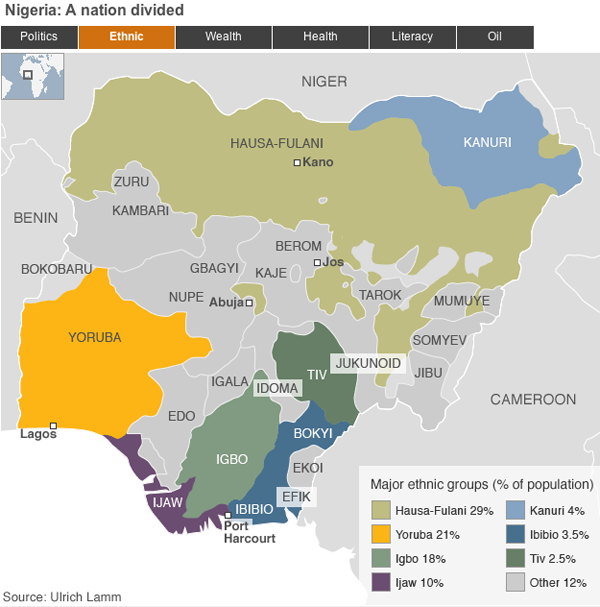
The BBC has a new feature on Nigeria, one of Africa’s most important—and most complicated—countries. And a few days ago it was supposed to hold elections. But these have been postponed, apparently on logistical problems. This piece attempts to explain the complexities of modern Nigeria across several different metrics via maps. Overall, it is very similar to a piece I mentioned that the BBC ran on South Sudan in the run up to that soon-to-be-country’s independence referendum.

Map of Nigeria by Various Metrics

Overall, the piece works for me as a means of quickly and broadly explaining the geographic breakdown of Nigeria in terms of ethnicity, politics, health, et cetera. The colours work, especially shifting between hues for the one-variable maps. The one thing that the Nigeria map adds over the Sudan map is the name of each state. However, these begin to become a bit cluttered and distracting—not to mention that in all-caps they sit at roughly the same level of the neighbouring country names despite being a touch smaller. Perhaps the maps could have been made to do more with less, and only label those states mentioned in the explanatory text. Or they could have been included but treated in a subtler fashion.

Counting People

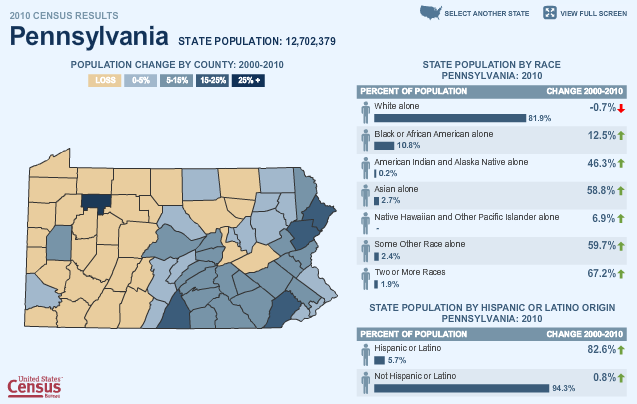
The Census Bureau has been releasing state population figures over the past several weeks and one means of accessing those figures is through a small, interactive map feature. Clicking through makes for some interesting observations—although not all states are currently available. In this screenshot, one can see an interesting story. Western Pennsylvania is shrinking whereas eastern Pennsylvania is growing. And, perhaps importantly, Philadelphia has perhaps reversed its long-term trend of population decline and saw a 0-5% increase in population while its further suburbs have seen increases in the 5–25% range.

census map feature
census map feature

If one is not viewing the piece in fullscreen mode, the navigation can be a bit small, especially for small counties. And the counties over which one rolls with the mouse cannot be selected, they are purely rollover functions that display census data from 1960 and the total population as of 2010. I would have liked the ability to select a particular county and then compare it to others by rolling over neighbouring counties. The colour choice, blues and a light, brownish-beige work rather well within the overall blue motif of the site. And by restricting the palette there, one gains the ability to use an altogether different colour, here green, to indicate which counties are rolled over along with differentiating the rollover box from the remainder of the map piece.

I wonder if more could not have done with the ethnic breakdowns on the right. Certainly the overall breakdown is effective, but it appears to lack a summary of sorts. What was the overall change for the state? And on a minor note, the person symbol is downright distracting.

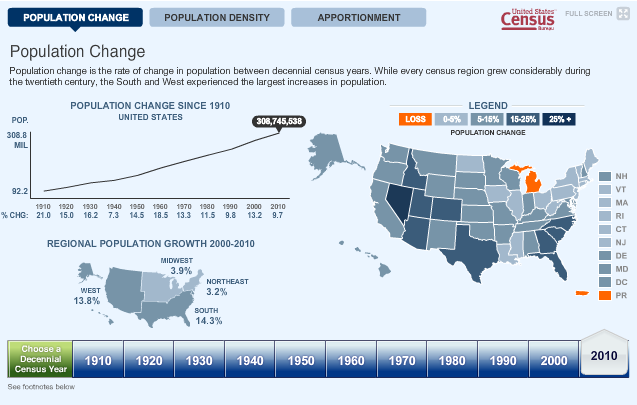
To get to the first state, one clicks on said state from an overall map of the United States. States are blue if they have had their data released, grey otherwise. However, once looking at a state, there is no way back to the overall map as states are chosen from a small button in the upper-right. This works just fine, we are here to look at state data, not for a geography lesson. However, that they use the map at the beginning seems incongruent with the remainder of the experience. I wonder if they could not remove the map at the start, or keep the map but make it more useful. After all, it would be interesting to see the percentage change in the states displayed—the unpublished states could remain grey.

Further below the first map is a second map.

Census map 2
Census map 2

Here, one does have access to the state population change figures. Much of the critique above remains salient here, except the light brown for population loss in the first map is here replaced by a garish and obnoxious orange. An interesting addition is the range of historical data, from the 1910 census through the 2010 census and to see how those population changes affected the apportionment of seats in Congress. Another interesting story that one can glimpse is the ‘filling-in’ of the North American continent. Population density in 1910 was high only in the Northeast, but ever since, the people have spread, concentrating along the coasts and then moving inwards towards the vast centre of the continent.

A (Multiethnic) Apple Falls Not Far From The Tree

One of my interests is genealogy/family history. While everyone is certainly more than the sum of their parts, that sum of parts is the history that led to your existence. And I find that notion fascinating.

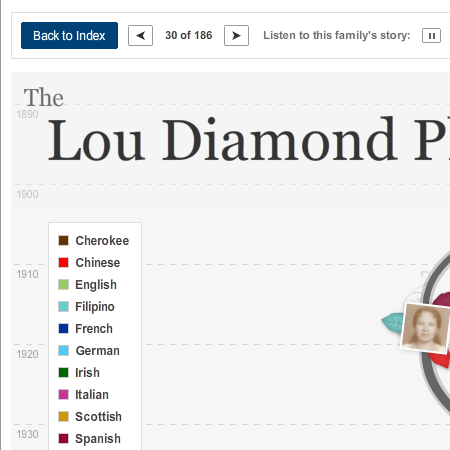
When looking around the New York Times, I came across this interactive piece about complicated family histories. I am unaware of the exact impetus behind the project, but it probably has something to do with the unfolding US Census results and the increasing number of mixed marriages and thus genealogies. But I cannot say for certain.

Lou Diamond Phillips Genealogy

The design of the piece is an interesting decision. Instead of a complicated and unwieldy diagram with lots of details, the designers chose to focus merely on photographs, when available, and little, coloured leaves to denote the ethnicity of each individual. This works to a degree in communicating simple ethnic ancestries, however, when one begins to have shades of light blue to distinguish between disparate ethnicities, one can begin to see a flaw in the system.

From an interactive perspective, I certainly think one of the more interesting bits is the inclusion, at least here in Lou Diamond Phillips’ tree, is the inclusion of the audio story as recounted by an individual. It brings a level of human connection that is always lost in diagrams. (Although these diagrams do have softer, curvier lines than most ergo they are more human. No?)

As someone interested in genealogy, the details are a bit light—but that was not likely the main intent of the piece. Beyond that, there are privacy issues with which to contend. But, if you wish, the New York Times does allow you to upload your own tree and even audio—to 10 megabytes. Perhaps in the future I shall upload a simple version of mine.

All in all, an interesting piece.

If Money Grew on Trees…

I would have become an arborist…alas, I am a mere designer in a world where trees shed leaves, not cash. The government, on the other hand, now that sheds a lot of cash.

President Obama released his budget proposal for 2012, proposal because the responsibility actually falls to the House of Representatives to pass spending bills and budgets. The New York Times, crediting Shan Carter and Amanda Cox, has put together a nice little interactive piece explaining the proposal. (It would be rather interesting to see if they compare the proposal to the passed budget, whenever that happens.)

Cropping of the US Budget for 2012 (Proposed)

From one side of the aisle we hear arguments about how we must cut spending from things like education and infrastructure while the other side pushes back. However, what this piece does quite nicely is allow the user to isolate mandatory spending. That is, we see that if we really wanted to cut spending, we would need to look at reforming Medicare, Medicaid and Social Security and then cutting the Defense Department budget. At last, something on which we see bipartisan agreement, reforming and cutting those budgets is too tough (read likely to cost representatives, senators, and presidents their jobs) and so they are left alone. But, I digress.

Furthermore, the piece adds the change in spending since 2010 for the various programs by way of greens and reds. While certainly not necessary—one could argue that the inclusion of such data makes a sometimes difficult chart type that much more difficult—I think that in this case the additional data is more than worthwhile. This year’s theme seems to be austerity and that means cuts. So while highlighting, say, the massive portion of government spending that is Medicare, Medicaid, and the US military we can also highlight that much of all that spending is still rising.

The Candidate Says Tweet Tweet

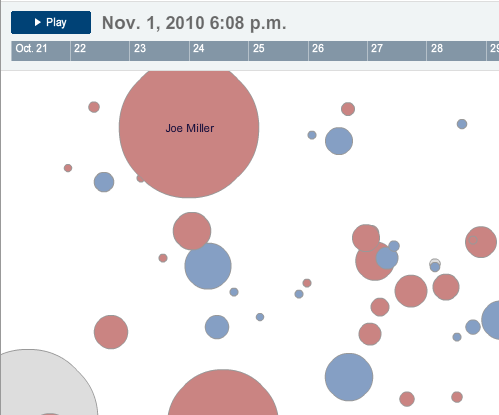
Yesterday, the New York Times released this interactive piece to look at the popularity of particular candidates in that seemingly ubiquitous world of Twitter. Perhaps it was inevitable that the Times or somebody else would create something like this. Regardless, it is out there and I have to say, I am left confused.

A cropping of the interactive piece.

No, not by the how it works. I understand that more activity makes for larger bubbles. (Although at this point I shall refrain from my usual diatribe on bubbles.) And if you click on a particular bubble/candidate, the vector and colour of the little bubbles describes the type of activity. Understand? Check.

But why are the bubbles placed where they are on the screen?

Perhaps the rationale is explained somewhere…but I have yet to find it. And after sitting down with a colleague yesterday, the two of us could not quite figure it out. Vaguely one gets the impression of representing actual geography—except for things like Delaware being in the bottom corner. Perhaps the bubbles’ centre points are randomly generated? They do not appear to be on separate loads of the Flash piece.

And so I am left with the thought that the bubbles are a needless distraction and, in fact, lead to greater confusion. What if, for example, the candidates were not bubbles but bars? The bars would create a visual rhythm as they grow and shrink and each could be clickable. One could sort the bars by some sort of a hierarchy: alphabetic, geographic, political, &c. You could even still click on a bar for more detailed views and perhaps do some other neat things.

I am just left scratching my head on this one.

It’s Hard to be a Saint in Hell

Perhaps the 21st century version of the Pentagon papers, the ‘War Logs’, as they are being called, consist of some 90,000 classified documents centring on the Afghanistan War. While they do not paint a necessarily different picture from what is known publicly, the War Logs do provide interesting glimpses into the war, a war that, like any other, is a messy and ugly business despite the polish of design, propaganda, and the media.  To put it differently and perhaps in another sense, the War Logs offer depth down to the ground-level, unpleasant details of warzone combat. But the documents lack an overall, strategic-level—I daresay antiseptic—breadth of understanding. The War Logs suffer from a lack of the broader context—but they do provide useful and interesting stories, vignettes, and anecdotes that flesh out the story we all broadly know.

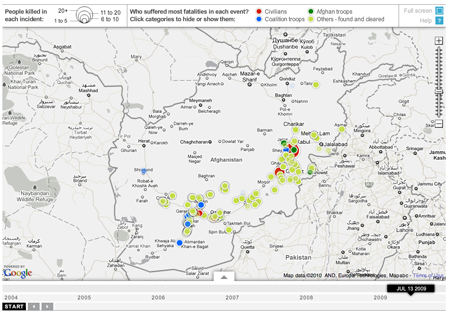
The Guardian is one of three main newspapers that received the leaks in advance; the others were the New York Times and Germany’s Der Spiegel. And one of the things the Guardian did was create an interactive piece exploring improvised explosive devices (IEDs) and where and when they occurred in Afghanistan from 2004 to 2010.

While I understand the use of Google maps, I always see the map as a distraction. For example, why in a story about Afghanistan do I need to see a map that includes the small cities of India. To some degree, the same can be said about the bordering countries like Iran and Pakistan—but as those countries are along the border and are to varying degrees involved in the action, their inclusion can be understood on a case-by-case basis.

Guardian Piece on IEDs

Choice of map aside, the piece  highlights the detonation of IEDs as circles whose area reflects the number of casualties. The colour of each circle represents which ‘group’ of people had the most casualties: civilians, Coalition soldiers, or Afghan soldiers. However, by reducing the data to a single circle of a single colour, we lose the potential added depth of breaking down the event into the deaths of soldiers and civilians alike. Do I have an instant solution on hand? No. But I do note that if one clicks on the specific event, a window appears that breaks down the event into said figures.

One of the more interesting things about this whole story is that at least the Guardian is putting out the data as a spreadsheet. Perhaps in the near to intermediate future those with the time and inclination will take that information and make something truly interesting for the public’s consumption.