Finland held an election that was worth watching because of the rise of a nationalist party whose name translates to True Finns. The leader of the True Finns was interviewed and at the end he reassured all watching that they “are not extremists. So you can sleep safely.” For Europe, the issue is their opposition to the bailouts of the various European economies, such as Ireland and Greece. And now that Portugal is in the midst of bailout negotiations, the True Finns could complicate matters if they manage to make it into government.
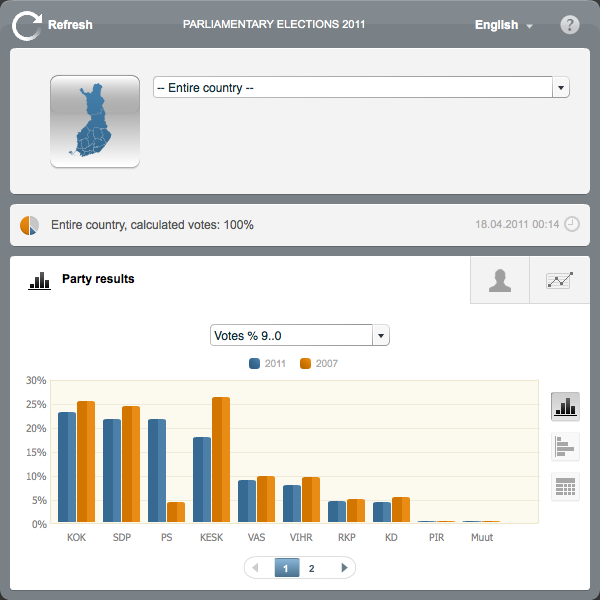
The Finnish Ministry of Justice released a small, interactive piece detailing the results. The parties are represented by acronyms, with PS for the True Finns. And here one can see that they performed third-best with about 19% of the vote. The True Finns actually beat the Centre Party, which was the leading party in the last coalition government. In short, a remarkable rise whose impact is yet unknown.

The interactive piece, however, is a tad confusing. While one story is certainly the improvement of the True Finns from the last election to the current one, does that need to be shown in the default view as we have here? And what I perceive to be shading or some sort of split colouration in the bars lends itself to the idea of having two separate sets of data encoded in the bar. Although I can see no such data and am thus confused.
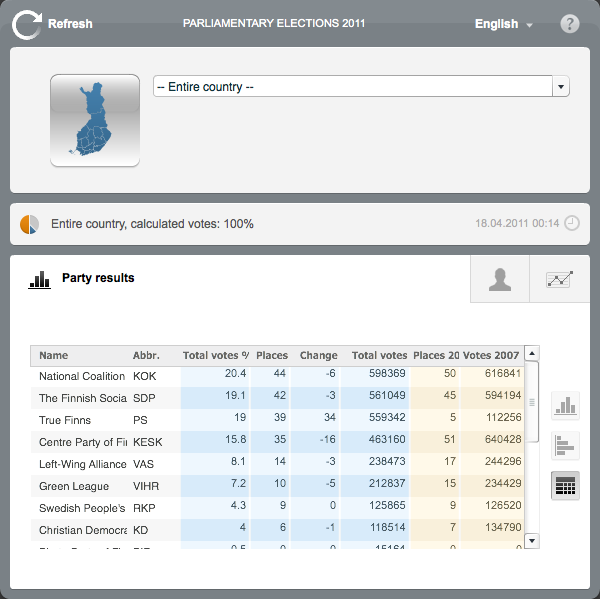
But, fortunately, one can also change one’s views of the data, from column to bar to table. And I daresay that the table, in this instance, I find best. Not because the data could not be visualised in an interesting, compelling and comprehensible fashion, but because it was not.

Certainly, the election results provide interesting data sets. And in this case we clearly have an interesting story, the rise of the True Finns from a small, rural party of 5 seats in the Finnish parliament (200 total seats) to the third-largest party with 39 seats. Alas, this piece leads does not make it easy to tell that story—let alone the results of the election.
