Campaign Contributions

On 21 May, Angelenos went to the polls to elect the next mayor of Los Angeles. The contest followed an earlier vote that prompted the day’s run-off election. This graphic from the Los Angeles Times examined the contributions to the campaigns of the two finalists, Eric Garcetti and Wendy Greuel.

The overall piece features an interesting interactive component that allowed the user to switch from a scatter plot view to a stacked bar chart view and then filter those results based on whether they were direct or indirect contributions. Generally speaking, that element worked. However, I want to focus on the second big component: an interactive tree map.
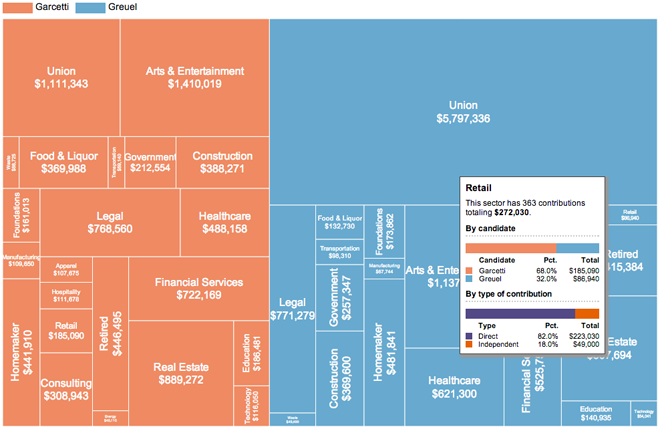
Tree map with rollover

While not all tree maps have to be squarified, by converting datapoints to (roughly) similar shapes the user should have an easier time comparing the area of the objects. This tree map is not squarified and so the user must strain to convert all the different shapes into roughly equal shapes for a visual comparison. Nor is there an inherent ranking within the map—at least not that I can find. That would also help.

So while the tree map is not a success in and of itself, the rollover condition makes for a more interesting overview of the different sectors of contributions. But despite this added value in the rollover,  the data powering the tree map would still be better presented in a different format.

Credit for the piece goes to Maloy Moore and Anthony Pesce.

Piracy on the Seas

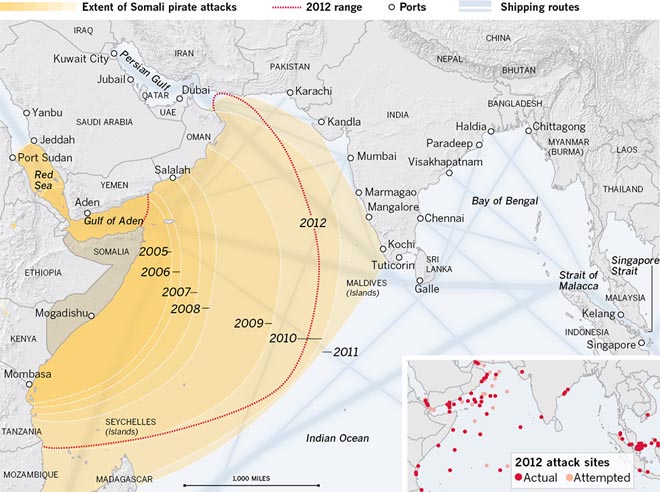
Today’s post looks at an interactive graphic from the Los Angeles Times. The subject matter is piracy and the piece has three distinct views, the second of which is displayed here.

Pirate attacks in the Indian Ocean

Generally speaking, the package is put together fairly well. My biggest concern is with the first graphic. It uses circles to represent the number of attacks by locale over time. I would have either included a small table for each geographic area noted, or instead used a bar chart or line chart to show the progress over time.

Credit for the piece goes to Robert Burns, Lorena Iñiguez Elebee, and Anthony Pesce.

California Budget 2013–14

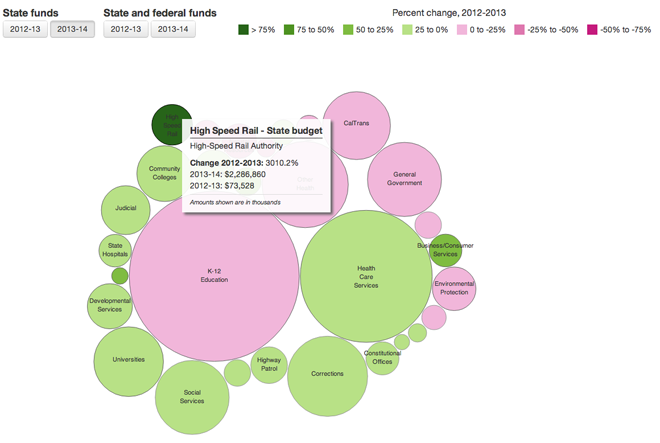
Yesterday I looked at the aboriginal Canadian identity infographic and wondered if bubbles in a bubble suffice for understanding size and relationship. Today we look at an interactive graphic from the Los Angeles Times where I do not think the bubbles suffice.

California Budget 2013–4

In this graphic, I cannot say the bubbles work. Besides the usual difficulty in comparing the sizes of bubbles, too many of the bubbles are spaced too far apart. These white gaps make it even more difficult to compare the bubbles. Furthermore, as you will see in a moment, it is difficult to see which programmes receive more than others because there is no ranking order to the bubbles.

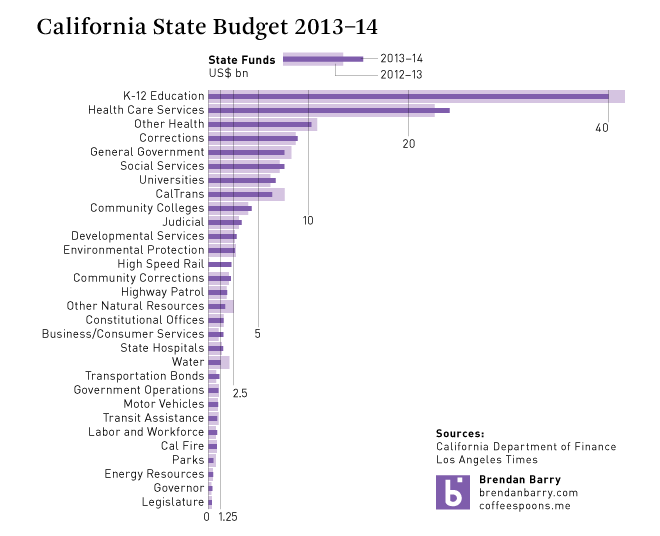
Below is a quick data sketch of the state funds only data for 2013 and 2012.

California Budget 2013–14

While I did not spend a lot of time on it, you can clearly see how simply switching to a bar chart allows the user to see the rank of programmes by state funding. It is not a stretch to add some kind of toggle function as in the original. One of the tricky parts is the percent growth. You will note above that my screenshot highlights high speed rail; the growth was over 3000%. That is far too much to include in my graphic, so I compared the actuals instead. That is one of the tradeoffs, but in my mind it is an acceptable one.

Credit for the original goes to Paige St. John and Armand Emamdjomeh.

Opportunity

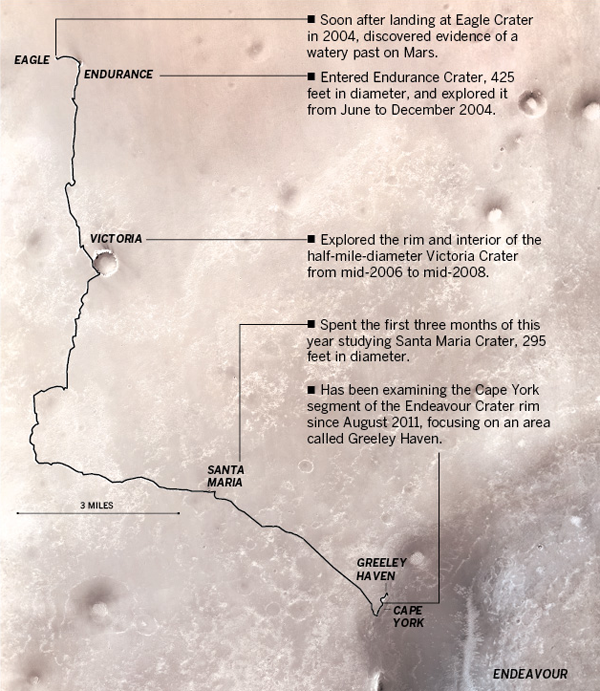
Curiosity is not the only rover on Mars, eight years after a 90-day mission, we still have Opportunity rolling around. The Los Angeles Times published this graphic detailing the exploration conducted by Opportunity. This is a map of Opportunity’s section of Mars.

Path of Opportunity
Path of Opportunity

Credit for the piece goes to Julie Sheer, Lorena Iñiguez, Raoul Rañoa, and Anthony Pesce.

USS Iowa

Battleships are cool. Pointless in the 21st century, but they’re still cool. And now the USS Iowa is open as a museum in Los Angeles. Around the opening of the museum earlier this month, the LA Times put together a few graphics that were collected in one infographic piece that illustrated some of those parts of the ship open to the public. But what’s cooler than the guns that fire shells as big as trees (wrong ship in the song, but the point stands).

The turret
The turret

Credit for the piece goes to Tom Reinken, Raoul Ranoa, and Anthony Pesce.

Sometimes Small Infographics Are Most Important

This is certainly not the largest, nor the most glamorous infographic. But to drivers in Los Angeles, probably a very useful one. It is a diagram of forthcoming changes to a series of on- and off-ramps to Interstate 405 and Wilshire Boulevard.

Ramp changes
Ramp changes

Simple things like having a dangerous red for the soon-to-be-closed ramps set against the calmer, desaturated colours of the safer, separated ramps of the future highlight the important area of the shared lanes. I probably would have called those areas out with something more than a black, many-pointed star, but it does still work.

Credit for the piece goes to Tia Lai and Anthony Pesce.

It’s Neither a Bird Nor a Plane. It’s a Space Shuttle. On Top of a Plane.

I loved the space shuttle. I mean how awesome is it that the lead ship of the class is named after the Enterprise from Star Trek. But seriously, it was a brick with little stub wings for gliding. It was not meant for flying. So now that all the shuttles are all retired—that’s a whole separate issue—how do they get from Kennedy Space Center to the various museums and installations?

Piggy back rides. On massive 747s. The Los Angeles Times made an infographic to explain just how the process works.

How to attach a space shuttle to a 747

Credit for the piece goes to Tom Reinken, Raoul Ranoa, and Anthony Pesce.

And the Award Comes From…an Old White Male. Most Likely.

So apparently last night actors, directors, and others associated with the production of films won little statues. (And then probably celebrated with fancy foods and wines.) Yes, last night was the Academy Awards. But who is this Academy that decides upon the best films and performances?

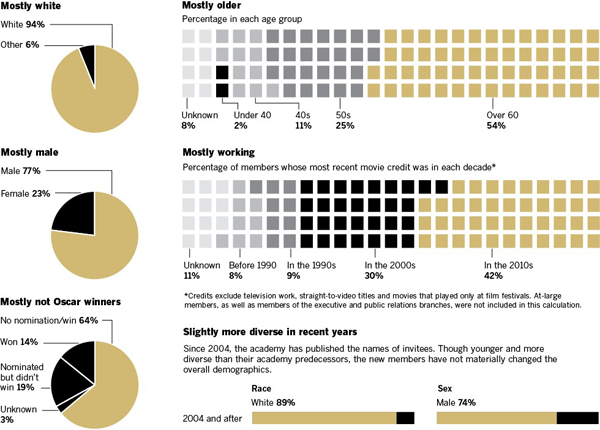
As it turns out, the demographics of the Academy do not quite mirror those of the broader country. Just over a week ago, the Los Angeles Times looked at the Academy and visualised its membership, discovering the details of which was itself a journalistic feat.

The demographics of the Academy of Motion Picture Arts and Sciences

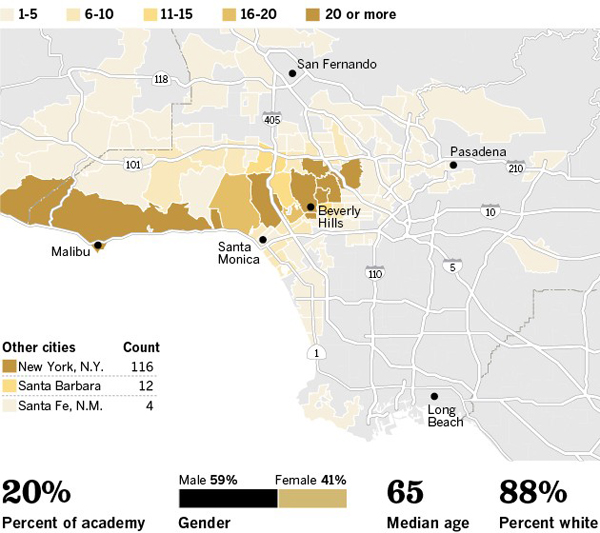
After a broad overview with pie charts and such, each branch was mapped as a choropleth to the Los Angeles area. Those members from outside the LA metropolitan area were given small squares to represent their cities.

Where the actors live

As someone not at all familiar with Los Angeles and its neighbourhoods, perhaps where the members of the various branches of the Academy live is actually somewhat interesting. However, I fail to understand the value in that. More useful is the idea of breaking out a socio-economic demographic and mapping that data. And if that had been the case here we almost have a set of small multiples. These are just a bit big.

Overall, a solid body of work.

Credit for the visualisation piece goes to Doug Smith, Robert Burns, Khang Nguyen, and Anthony Pesce.