Those Who Will Lose Subsidies for Trumpcare

As much as I like trains…we need to get back to Trumpcare. As you probably know, it will cover fewer people than Obamacare. Just how many fewer people? Somewhere in the ten to twenty million range. The poor, the elderly, and the sick are those who will be worse off. Because the poor, the elderly, and the sick are the ones who clearly do not need healthcare. Higher-income young people, your subsidies are about to go up.

But I digress, the Los Angeles Times looked at county electoral and tax data to see just where the pain falls geographically, and more importantly where it falls politically. So they took a look specifically at the bracket that will be hurt the most: the poor and elderly, 60 and earning $30,000.

Trump won the vast majority of counties that will be hardest hit

Well, it looks like all those people who voted against the idea of Obamacare just voted themselves to get even less assistance. Trumpcare’s going to be great, guys. Unless you’re old. Or poor. Or sick.

Credit for the piece goes to Priya Krishnakumar.

Rotting Wooden Beams

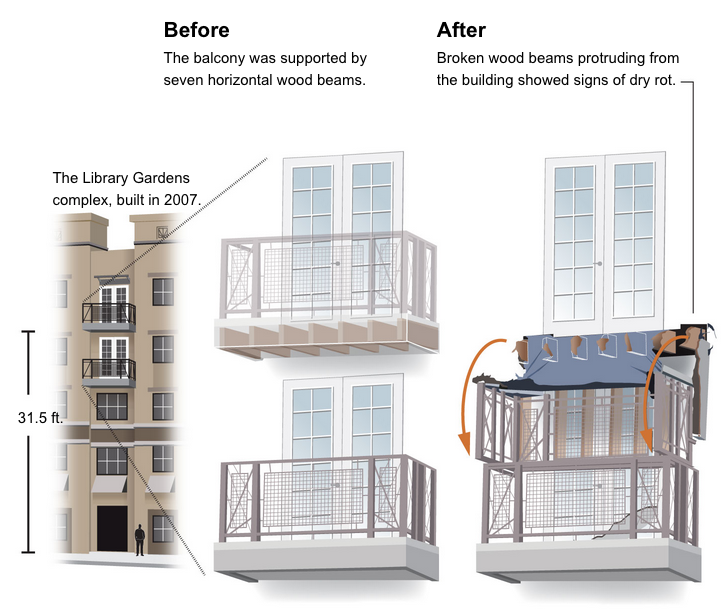
Earlier this week a balcony collapse in Berkeley, California killed six Irish students. The building had only been finished in 2007 and was barely ten years old. While the investigation is ongoing, the Los Angeles Times reported on what might have been the cause: dry rot.

Dry rot
Dry rot

Credit for the piece goes to Rong Gong-Lin II.

Context for the Baltimore Riots

Baltimore is going crazy, if you haven’t heard. So the LA Times put together a set of maps putting the riots in context. They look at the racial makeups of the neighbourhoods with the violence along with median income and education.

The racial makeup of the neighbourhoods witnessing riots

Credit for the piece goes to Jon Schleuss, Kyle Kim, and the LA Times graphics department.

Hit-and-Run Cycling Accidents in Los Angeles

Today’s piece comes via a colleague. It is an article about hit-and-run cycling accidents in and around Los Angeles. The data visualisation in the article is not entirely complex—we are talking only about line charts and bar charts—but they support the arguments and statements in the article. And in that sense they are doing their job.

Locations of hit-and-run accidents in and around LA

Credit for the piece goes to Armand Emamdjomeh, Laura J. Nelson, and Joseph Serna.

Borehole Graphics

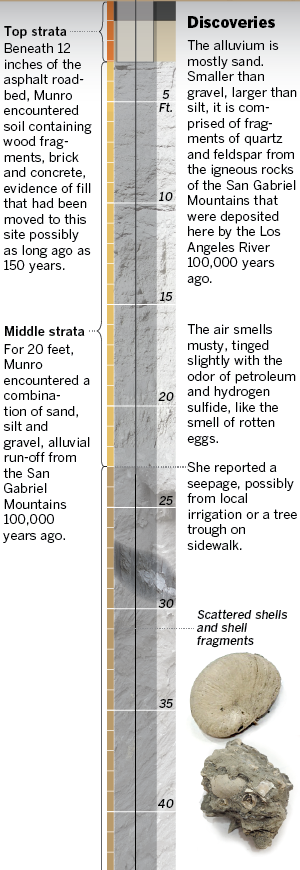
Long articles often mean lots of vertical space. But it is only every so often when an item can complement itself with a narrow, vertical graphic. The Los Angeles Times has just that in today’s piece, looking at the layers of sedimentation from a borehole.

What's in the borehole?
What’s in the borehole?

Credit for the piece goes to Thomas Curwen, Lorena Elebee, and Javier Zarracina.

The Tallest of the Tall (in Los Angeles)

I have always had an interest in architecture. And so this piece from the Los Angeles Times is just because I like to indulge myself every so often, a look at the five tallest buildings in Los Angeles.

Map of the five tallest buildings

Credit for the piece goes to Scott J. Wilson, Matt Moody, and Anthony Pesce.

LAX Shootings

I didn’t see a lot of informative graphics regarding the shooting at LAX. But, here are two pieces. The first is from the Los Angeles TImes. Terminal 3 is rendered in three dimensions. Different buttons add views of the remainder of the airport.

Los Angeles Times' terminal diagram
Los Angeles Times’ terminal diagram

The Washington Post opted for a flat, two-dimension drawing in one graphic with both all of LAX and Terminal 3 in the same graphic.

Washington Post's terminal diagram
Washington Post’s terminal diagram

The thing about the three-dimensional rendering is that it adds too much complexity whereas the two-dimensional schematic strips most of it out. Is it important to know the specific details of a building? Or is it more important to see its general shape and an area inside of it?

Credit for the Los Angeles Times piece goes to Javier Zarracina, Raoul Ranoa, Lorena Iniguez, and Anthony Pesce.

The Calderon Connections

I am not terribly familiar with local politics outside of my local areas. So the background and details of this piece escape me. However, this interactive graphic and story from the Los Angeles Times does a really great job of leading the reader through the story.

First, the piece starts with a general overview or flowchart of the network of connections. Mouseovers do a fine job of highlighting and filtering for the appropriate piece. For example, a person shows the entities to which he is connected whereas the entities show the people to which it is connected.

The flow diagram of connections

Secondly, the piece then goes in detail about the different connections. The example screenshot below shows how each story is highlighted by a red dot as the user scrolls down the page. When that story is highlighted, the network diagram to the left changes, either replacing the contacts or highlighting the contacts specifically noted in the story.

Example of the connections in this story

As I said at the outset, this is a very nice piece that step-by-step shows and explains how all the connections work while filtering out the momentarily irrelevant data. Very well done.

Credit for the piece goes to Byron Lutz.

Voyager 1 Has Left the Solar System

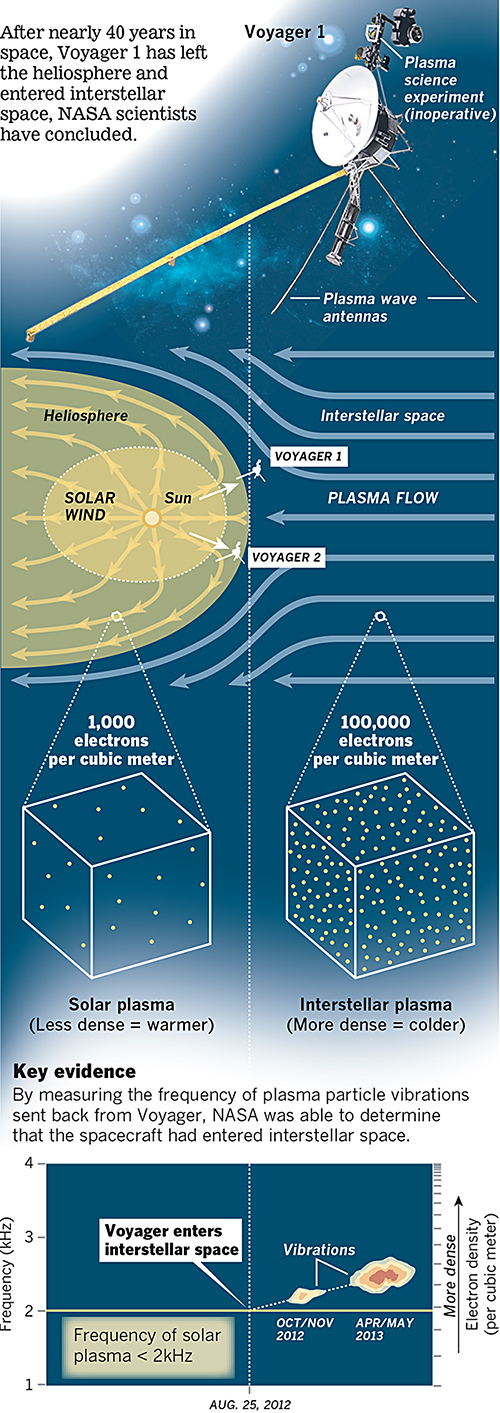
Last week NASA announced that last year, Voyager 1 left the Solar System about 25 August 2012. A lot of the graphics that were published to support that story chronicled the distance travelled by that probe. However, this excellent graphic by the Los Angeles Times instead looks at how NASA determined through the data returned that Voyager had left the Solar System.

Voyager 1 departs the Solar System

The piece does a really good job of setting up the story in illustrating the instrument packaged used to collect the data. Moving down the piece, it shows locations and the different environments and then how those environments differ in electron density. Lastly it looks at how NASA interpolated the date from the data collected. A really solid piece.

Credit for the piece goes to Monte Morin, Doug Stevens, and Anthony Pesce.

It’s a Zepplin! It’s a Plane! It’s a Chopper! Nope…

…it’s an Aeroscraft! This interactive, diagrammatic infographic from the Los Angeles Times explains just how the aeroscraft is part zeppelin, part plane, and part chopper.

Internal frame of an aeroscraft

Credit for the piece goes to Raoul Ranoa and Anthony Pesce.