The London Job Exodus

Brexit is bad for Britain. Here is some proof from an article by Bloomberg that looks at where London-based banking jobs are headed post-Brexit. Spoiler alert, not elsewhere in Britain. The article purports to be more of a tracker in that they will add on data about jobs moving places when news breaks. But I cannot verify that part of the piece.

What I can verify is a sankey diagram. Underused, but still one of my favourite visualisation forms. This one explores where companies’ London-based banking jobs are moving. Right now, it clearly says Frankfurt, Germany is winning.
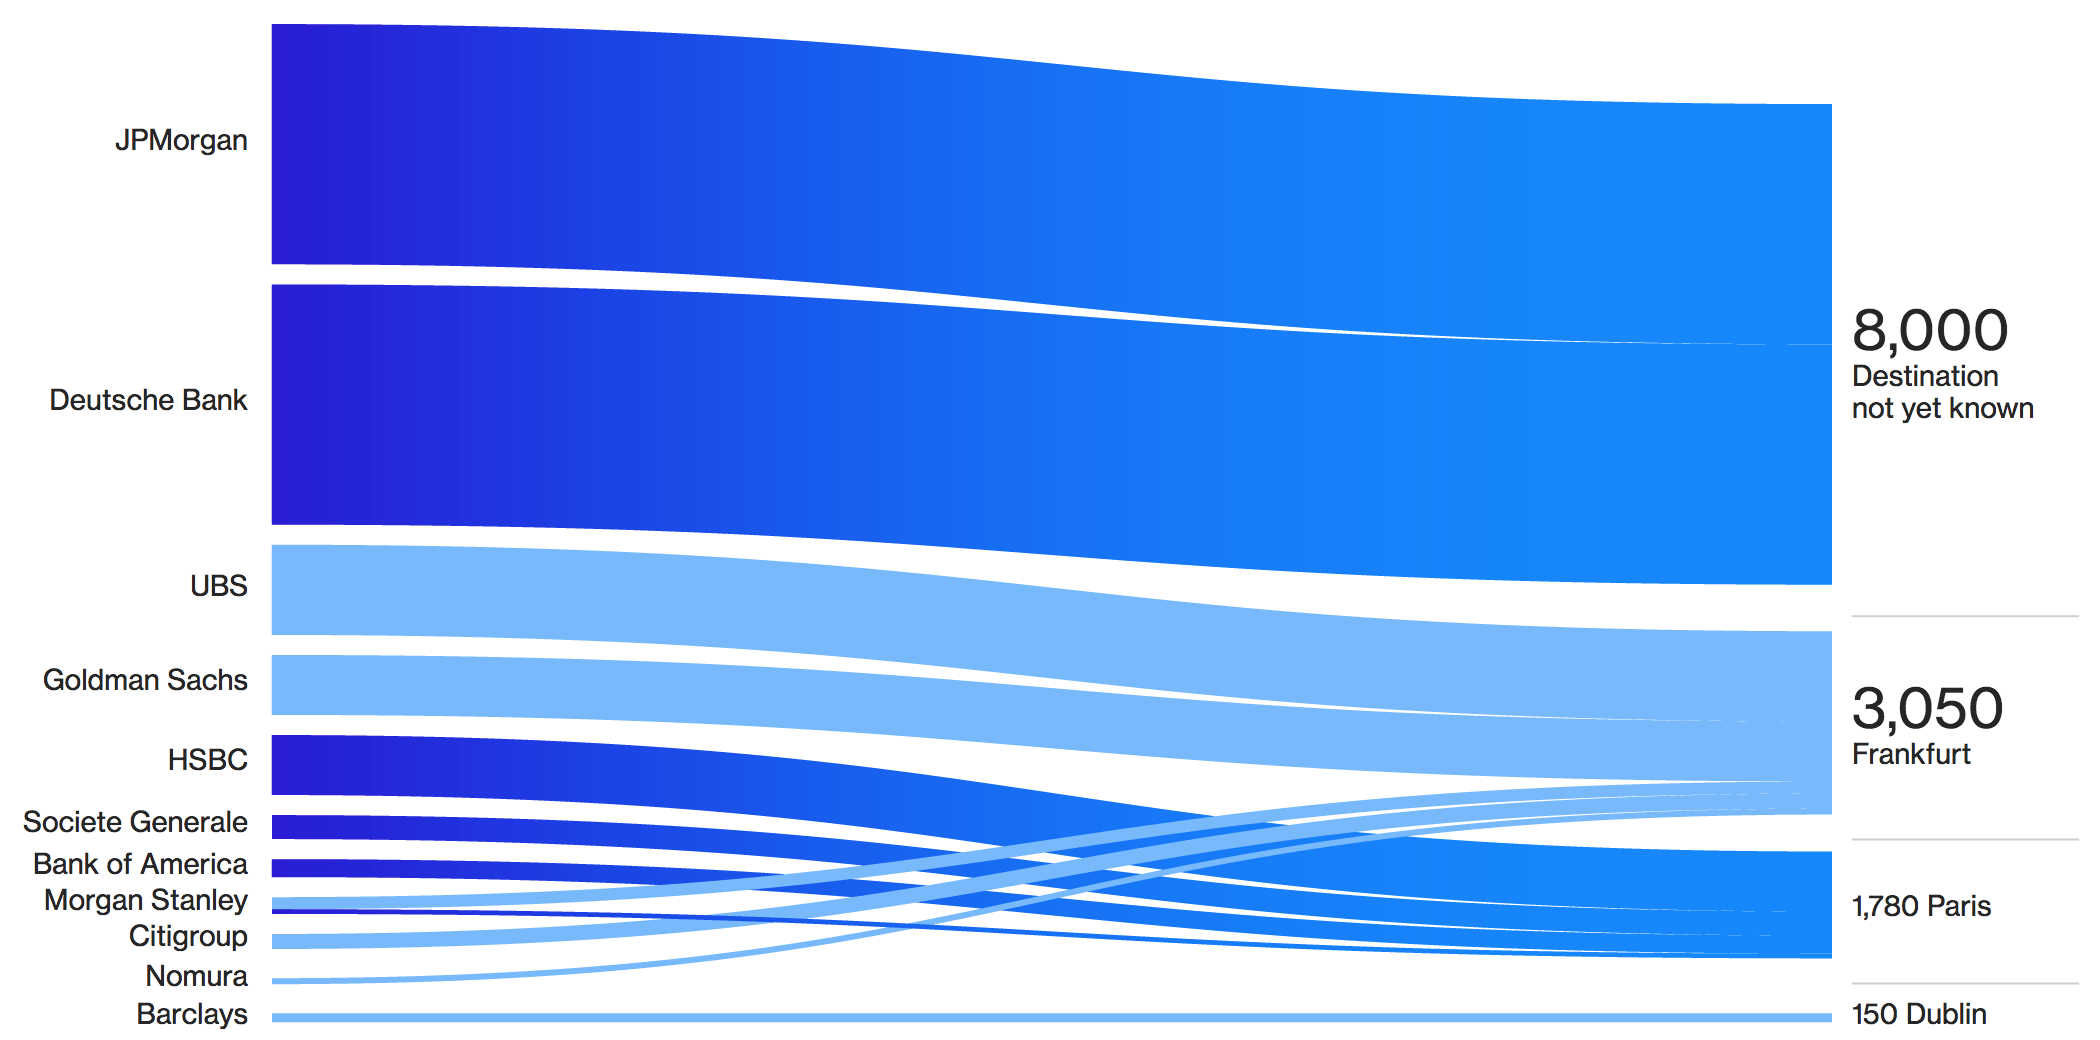
Look at all those job…

As sankeys go, this one is pretty straightforward. Aesthetically I wonder about the colour choice. I get the blues and that the banks are coloured by their ultimate destination. But why the gradient?

But conceptually the big question would be what about London? I probably would have kept London in the destination set. While many jobs are likely to leave Britain, some will in fact stay, and those lines will need to go somewhere in this graphic.

The piece also makes nice use of some small multiple maps and tables. All in all, this is a really solid piece. It tells a great—well, not great as in good news—story and does it primarily through visuals.

Credit for the piece goes to Gavin Finch, Hayley Warren and Tim Coulter.

Down on the Farms

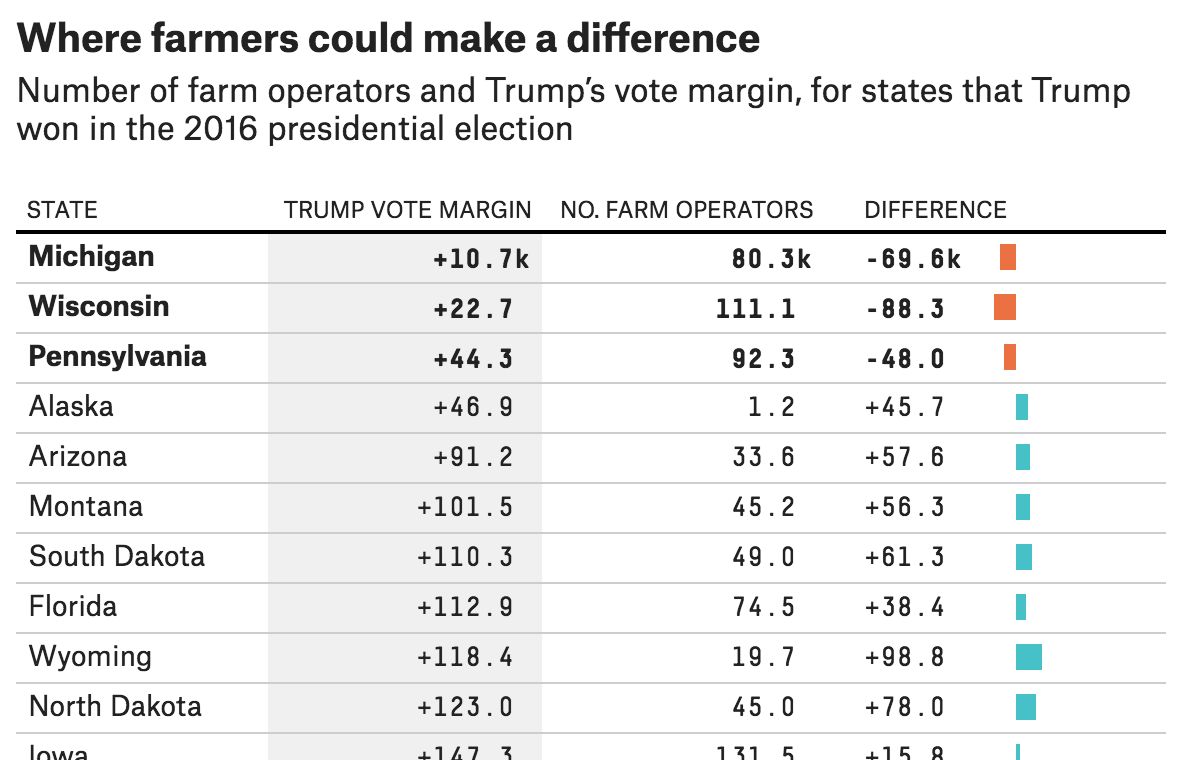
Just a neat little piece today from FiveThirtyEight. They take a look at the potential impact of the Trump administration’s proposed tariffs on the farm vote in the United States. The screenshot of the table shows how the farm population compares to Trump’s margin of victory in 2016.

Farming clearly isn't big in Alaska…
Farming clearly isn’t big in Alaska…

The three states at the top? The very same Pennsylvania, Wisconsin, and Michigan about which we hear so often. Yes, Pennsylvania does have large cities like Philadelphia and Pittsburgh, but agriculture is an important part of its economy. So if the tariffs or the reprisals to the tariffs have any significant impact on the livelihood of farmers, that could be enough, all things being equal, to flip those states.

About the design, I think the inclusion of the mini-bar chart helps tremendously. Tables are great for organising information, but scanning over and through cell after cell of black text can hide patterns. The visualisation of those patterns at the end of each row helps the user tremendously, by making it very clear why those three states were highlighted.

Credit for the piece goes to Rebecca Shimoni Stoil.

Deaths in America

Yesterday was murders in London and New York. Today, we have a nice article from FiveThirtyEight about deaths more broadly in America. If you recall, my point yesterday was that not all graphics need to be full column width. And this article takes that approach—some graphics are full width whereas others are not.

This screenshot shows a nice line chart that, while the graphic sits in the full column, the actual chart is only about half the width of the graphic. I think the only thing that does not sit well with me is the alignment of the chart below the header. I probably would align the two as it creates an odd spacing to the left of the chart. But I applaud the restraint from making the line charts full width, as it would mask the vertical change in the data set.

The screenshot is of the graphic's full width, note the lines only go a little over half the width.
The screenshot is of the graphic’s full width, note the lines only go a little over half the width.

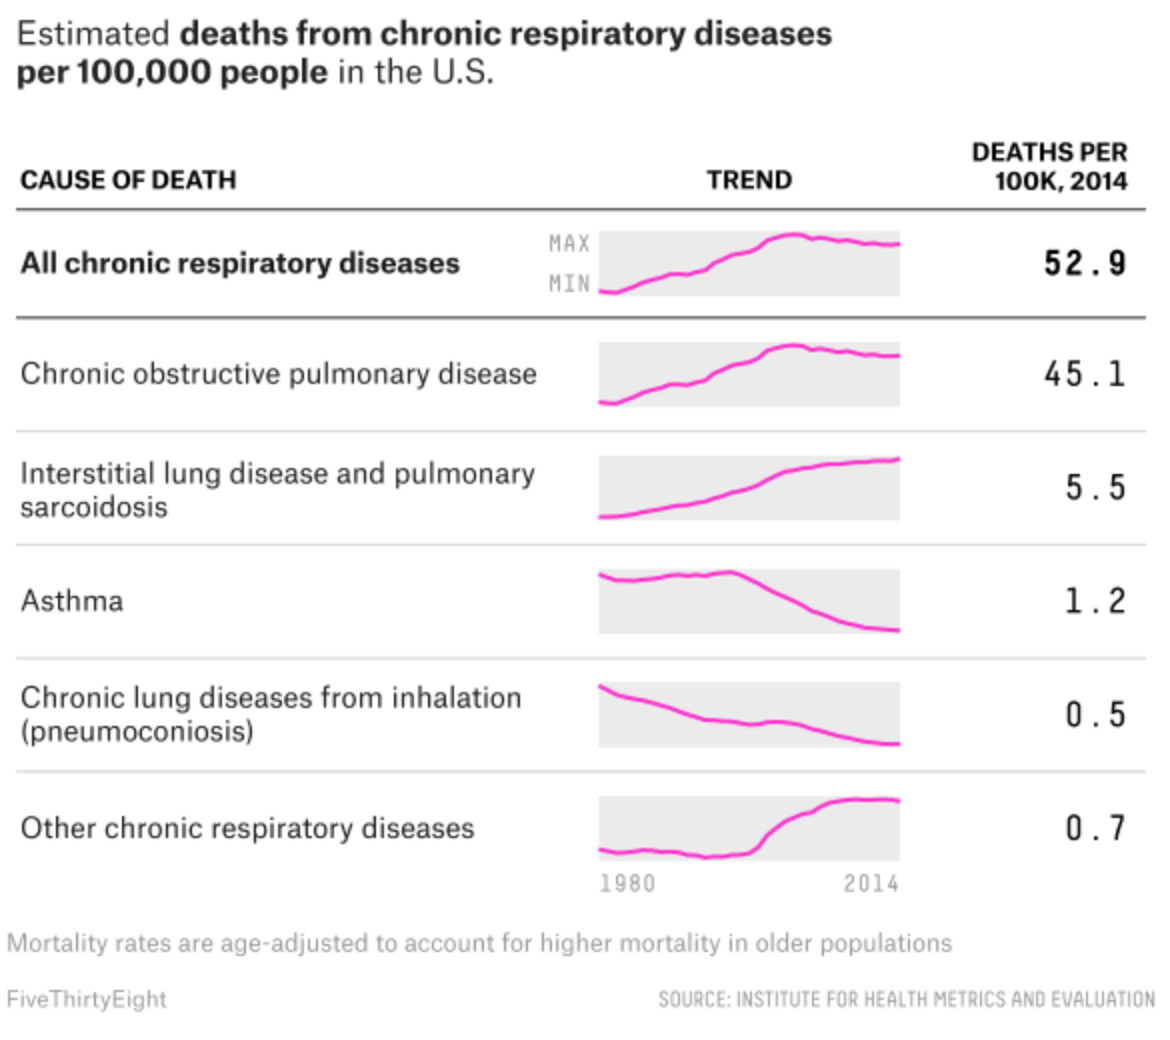
Meanwhile, the article’s maps all sit in the full column. But my favourite graphic of the whole set sits at the very end of the piece. It examines respiratory deaths in a tabular format. But it makes a fantastic use of sparklines to show the trend leading towards the final number in the row.

Loving the sparklines…

Credit for the piece goes to Ella Koeze and Anna Maria Barry-Jester.

Baseball Is Back

Praise the (baseball) gods.

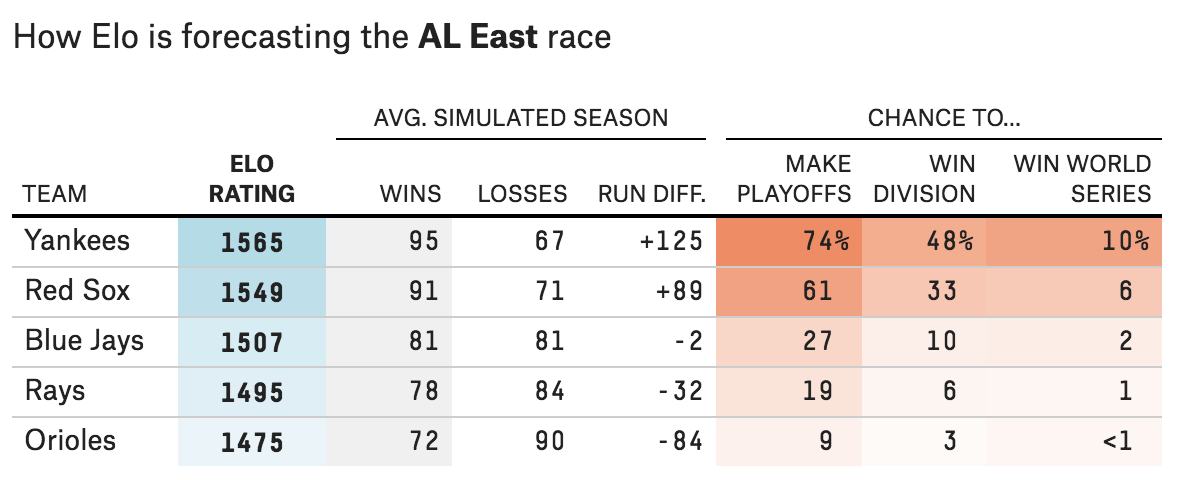
The 2018 season starts today with I think every team playing—the Red Sox open down in St. Petersburg against the Rays. So today’s post is on the light side as I could not find the awesomest baseball graphic. But FiveThirtyEight did at least preview the season and ran some projections. Naturally, I disagree with their projections. But I think finally this year the Yankees will be more of a threat to the Red Sox than they have been in years. The rivalry is back. (Though it never really went away in my mind.)

Switch numbers one and two and I think this might be okay…

The above is the screenshot for the American League East, because Boston. But, the rest of the AL is on that page as well. For those of you from my more National League-following cities like Philadelphia and Chicago, FiveThirtyEight also previewed the NL divisions here.

Credit for the piece goes to Neil Paine.

Gerrymandering Pennsylvania Part V

Yesterday we looked at the new congressional district map here in Pennsylvania, drawn up by the state supreme court after the Republican legislature and Democratic governor could not come to agreement.

Also yesterday, FiveThirtyEight explored the redrawn map in more detail to see if, as I’ve read in a few places, the new map is a Democratic gerrymander. In short, no. The article does a great job explaining how, basically, it might seem like it because more Democrats are predicted to be elected based on various models. But, that is only because the map was so extremely gerrymandered in the past that any effort to increase competitiveness or fairness would make Republicans more likely to lose seats.

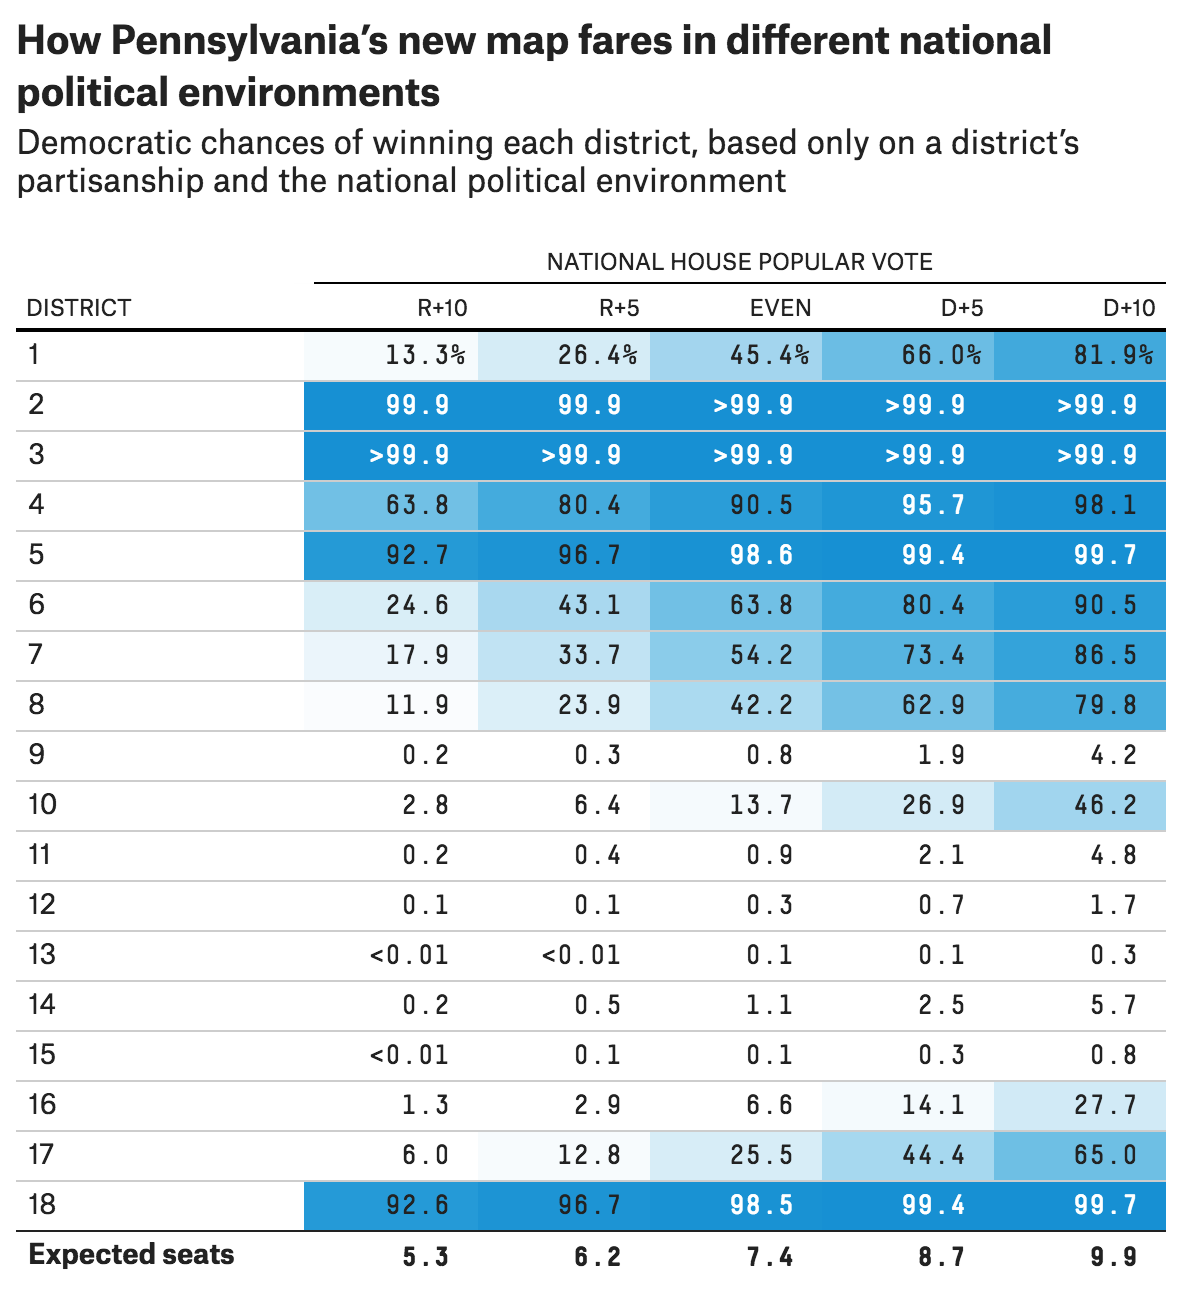
This one table in particular does a nice job showing just how in an average election cycle there are only four seats that you could consider reliably Democratic whereas there are six that are reliably Republican. And keep in mind that Pennsylvania actually exhibits the reverse split—there are more Democrats than Republicans in the state. So even with this new map, the state exhibits a slight Republican bias.

Still favouring the Republicans

Credit for the piece goes to Aaron Bycoffe.

The World Grows On

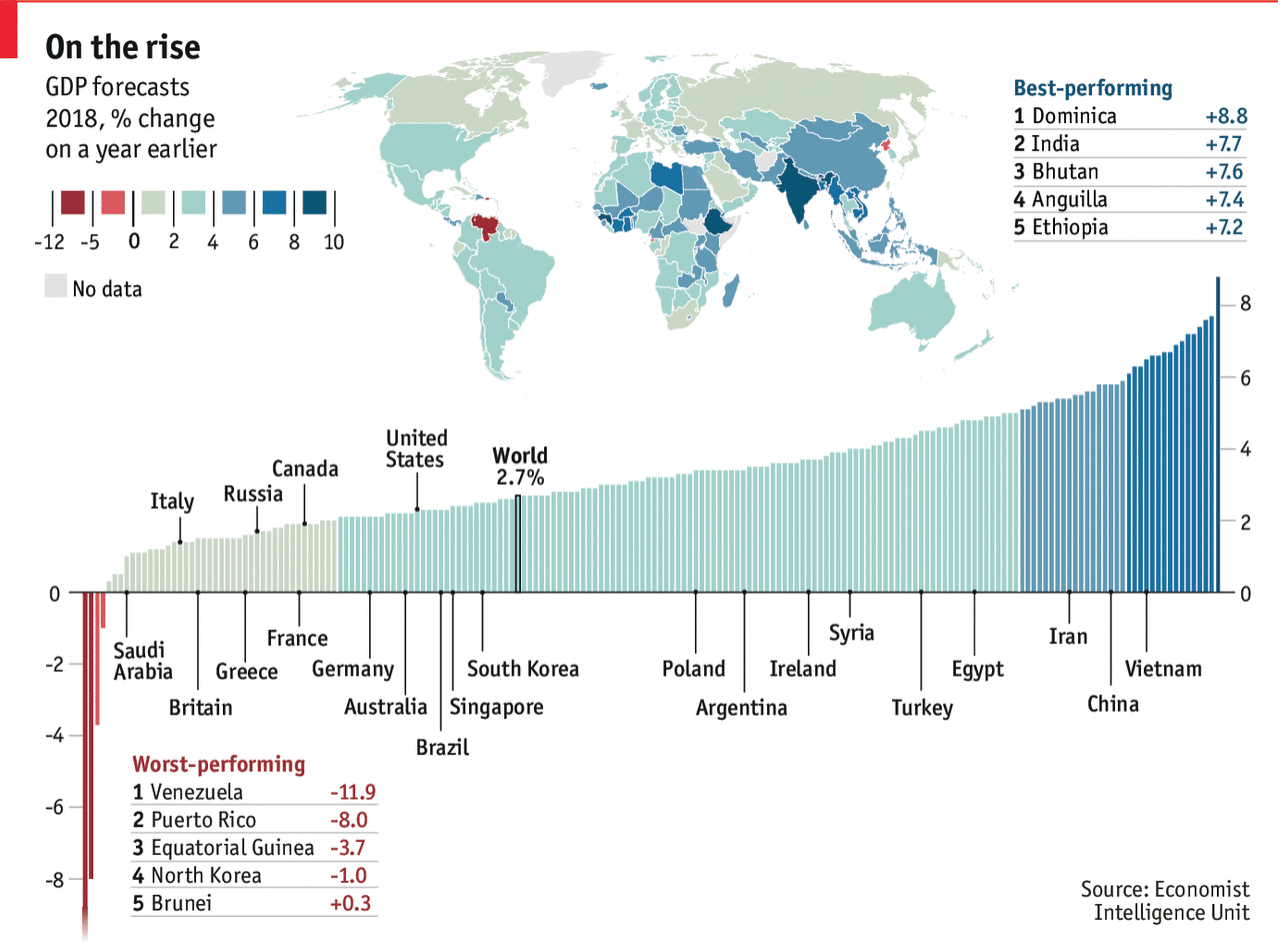
January is the month of forecasts and projections for the year to come. And the Economist is no different. Late last week it published a datagraphic showcasing the GDP growth forecasts of the Economist Intelligence Unit. I used to make this exact type of datagraphic a lot. And I mean a lot. But what I really enjoy is how successfully this piece integrates the map, the bar chart, and the tables to round out the story.

Take a note at how the chart distributes the bins as well

The easy thing to do is always the map, because people like maps. They can be big, and if the data set is robust, full of data and colour. But maps hide and obscure geographically small countries. And then you have to assume that people know all the countries in the world. Problem is, most people do not.

So the bar chart does a good job of showing each country as equals, a slim vertical bar. In such a small space, labelling every country is impossible, but the designers chose a select number of countries that might be of interest and called them out across the entire series.

Lastly, people always like to know who is #winning and who is a #loser. So the tables at the extreme ends of the chart showcast the top and last five.

I may have rearranged some of the elements, and dropped the heavy black rules between the bins on the legend, but overall I consider this piece a success.

Credit for the piece goes to the Economist Data Team.

Airport Codes

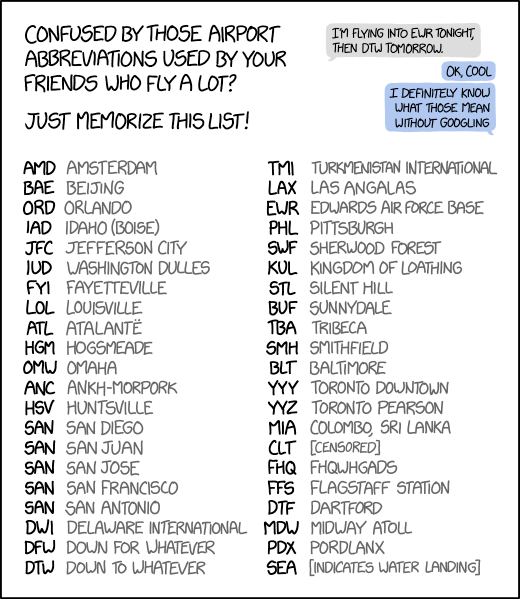
I managed to find myself in a handful of airports over the last few weeks. Consequently I brushed up on my airport codes, the three-letter abbreviations you often find on boarding passes and data displays. Well, if only I had seen this particular reference from xkcd.

Oh PHL…
Oh PHL…

Credit for the piece goes to Randall Munroe.

Exporting Guns

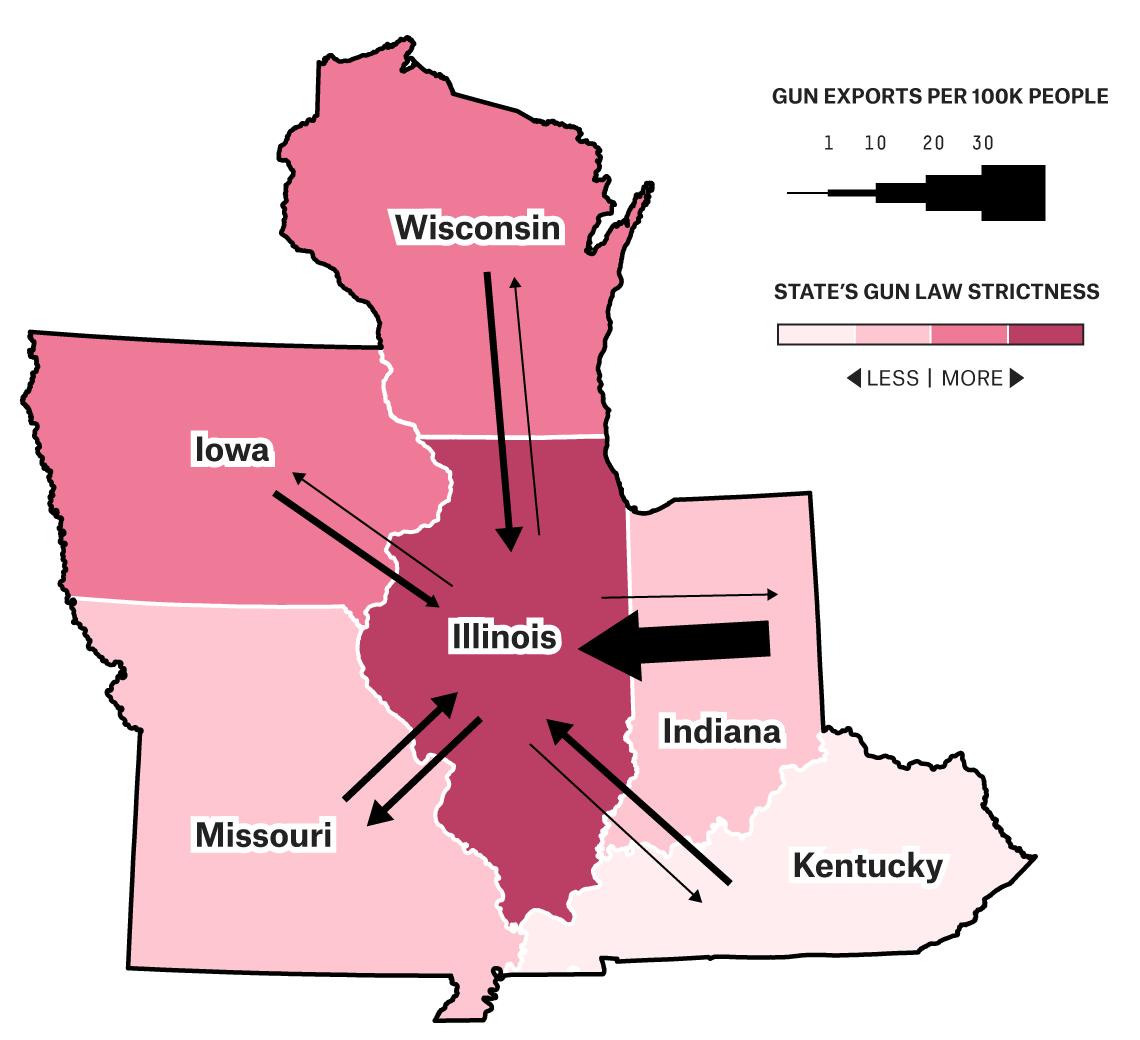
When I lived in Chicago, people back East would always ask if I was worried about murder and gun crime in Chicago. My reply was always, “no, not really”. Why? Because I lived in generally safe neighbourhoods. But on that topic, the second most numerous question/comment was always, why are the strict gun laws in Chicago not preventing these crimes? More often than not the question had more to do with saying gun control laws were ineffective.

But in Chicago, it seemed to me to be fairly common knowledge that most of the guns people used to commit crimes were, in fact, not purchased in Illinois. Rather, criminals imported them from neighbouring states that had far looser regulations on firearms.

Today’s post from FiveThirtyEight looks at that very topic.

They bring back more than just cheese from Wisconsin…

They bring back more than just cheese from Wisconsin…I am not the biggest fan of the maps that they use, although I understand why. Most Americans would probably not be able to name the states bordering Illinois, California, or Maryland—the two other states examined this way—and this helps ground the readers in that geographically important context. But, thankfully the designers opted for another further down in the article that explores the data set in a more nuanced approach. Surprise, surprise, it’s not that simple of an issue.

Credit for the piece goes to Rachael Dottle.

Colin Kaepernick

Colin Kaepernick is a contentious figure in American football because of the protests he started against the US national anthem. While other protesting players remain on teams and play, Kaepernick remains unsigned despite what some say is a talent above other players. And as the American football season just began, this article from the Washington Post caught my attention.

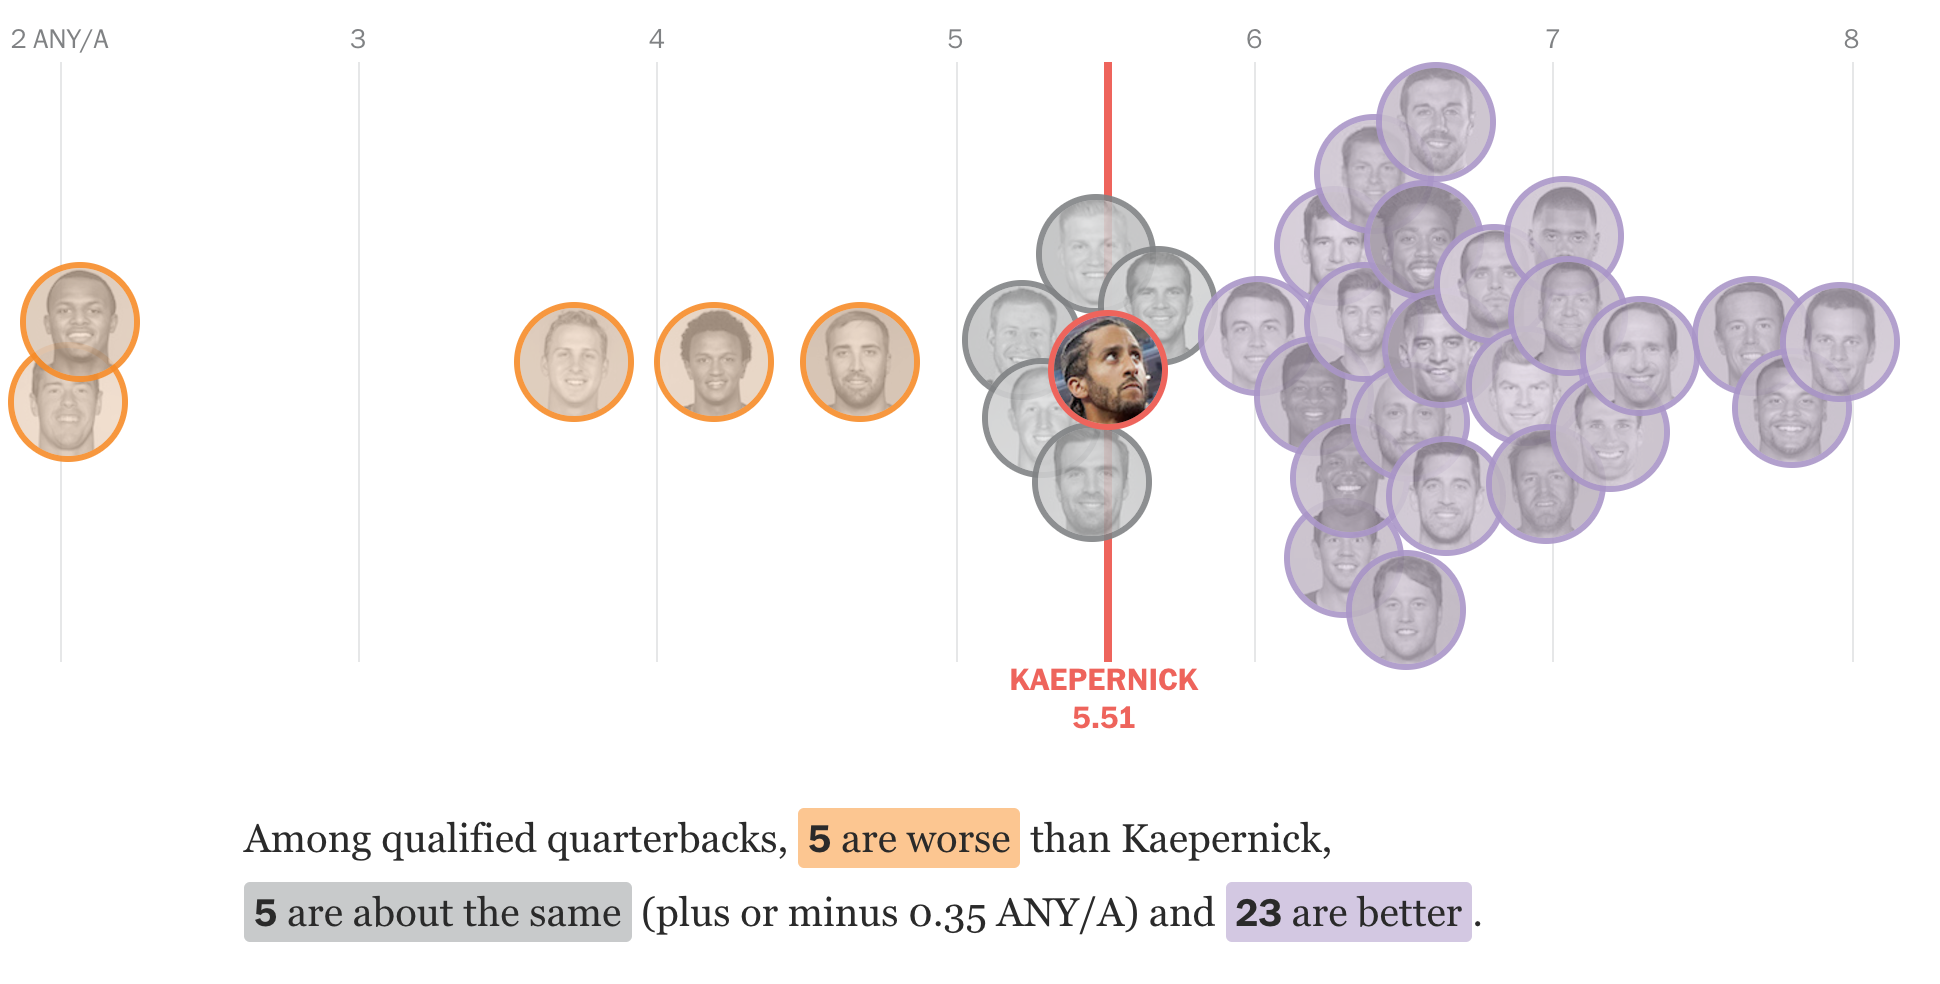
Some of the arguments I have seen for Kaepernick’s unsigned status allege he just is not very good. But is that so? What does the data show? Well thankfully the Post dived into that and is running what we can best call a Kaepernick tracker comparing him to qualified quarterbacks in the NFL.

Clearly better than a host of other quarterbacks

It turns out, he is a middle-of-the-pack quarterback, demonstrably better than half-a-dozen and sitting solidly amongst an almost third-tier or cluster of players. The data clearly shows that poor performance is not the reason for remaining unsigned, otherwise he would have replaced any number of quarterbacks. True, it could come down to his dollar cost, but most likely his remaining unsigned, compared to almost a dozen players underperforming him, is related to his protests.

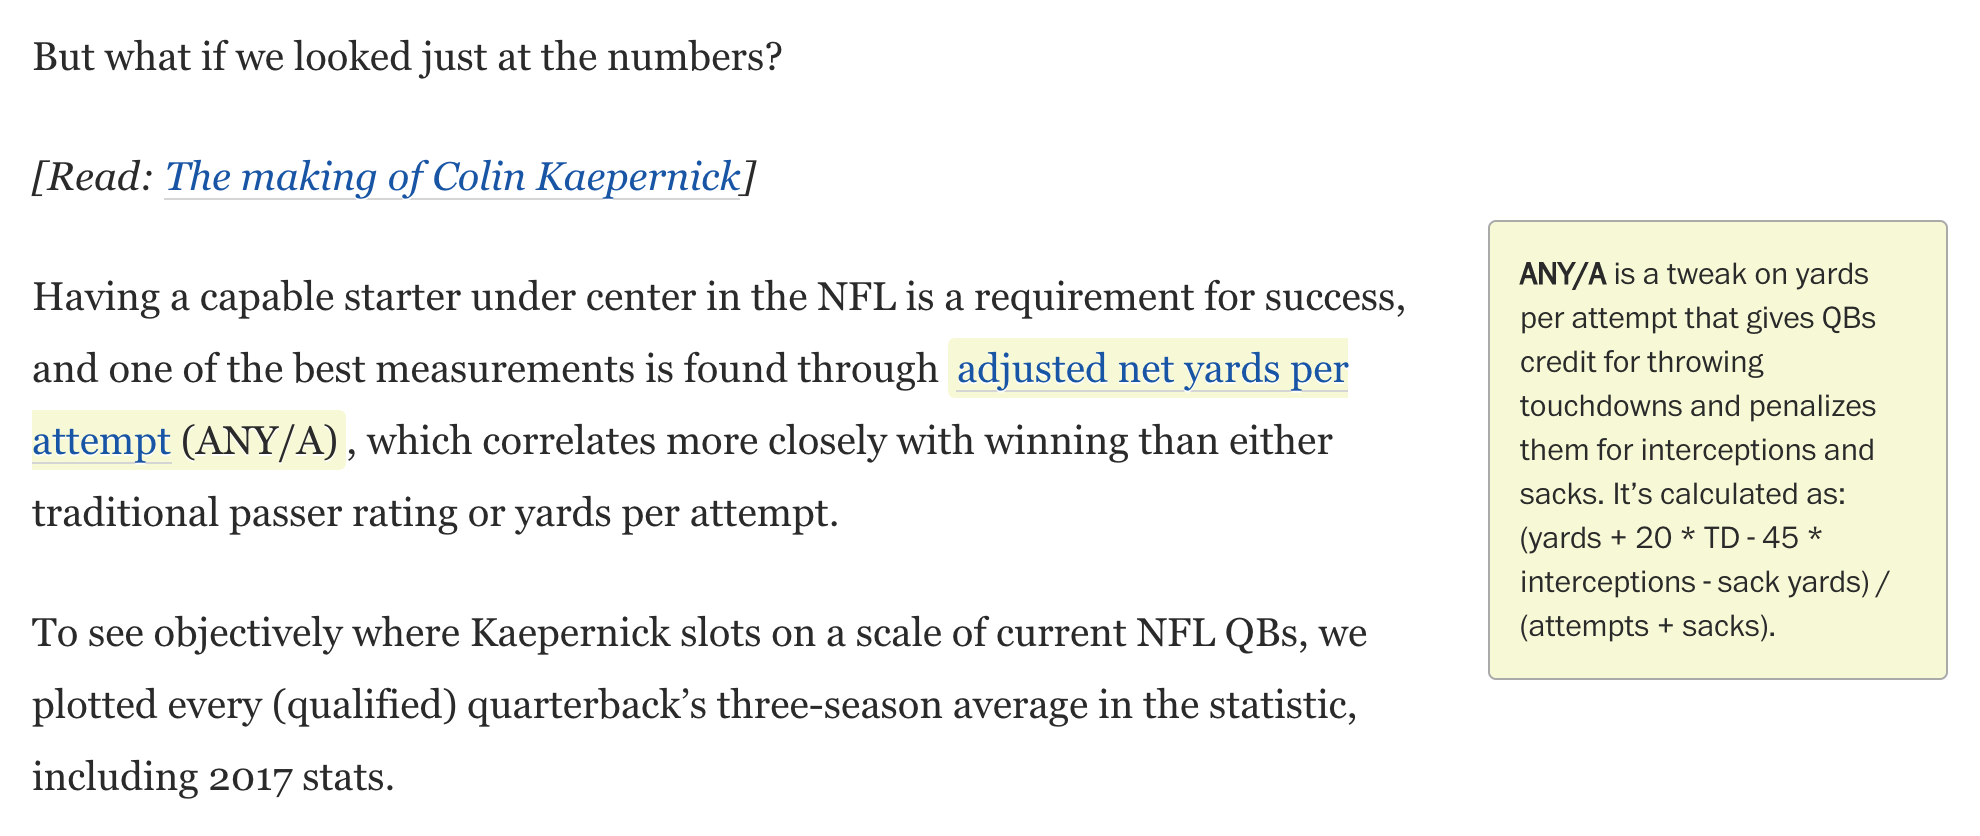
Now from the design standpoint, I also wanted to call attention to this article because of the way it handles definitions. The article uses the statistic adjusted net yards per attempt to assess performance. But what does that actually mean? Well, in the digital margins of the piece, the designers include an explanation of that statistic. I thought this was a really well-done part of the article, not interrupting the main narrative flow for a definition that a portion of the audience probably knows. But the more casual followers or people more interested in the political nature of the story would have no idea, and this does a great job of explaining it to us laymen.

What does it all mean?

Credit for the piece goes to Reuben Fischer-Baum, Neil Greenberg, and Mike Hume.

Clear the Cache

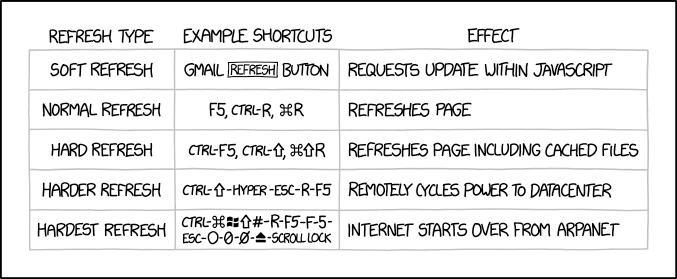
Some of the aforementioned work that has been keeping me busy is the design of a new part of a website. And one of the most common things I hear when I ask why something is not displaying as I intended is “Have you cleared the cache?”. And that is why this Friday’s piece from xkcd is super relevant to me.

I could have used this table earlier this week

Credit for the piece goes to Randall Munroe.