Yesterday we looked at the new congressional district map here in Pennsylvania, drawn up by the state supreme court after the Republican legislature and Democratic governor could not come to agreement.
Also yesterday, FiveThirtyEight explored the redrawn map in more detail to see if, as I’ve read in a few places, the new map is a Democratic gerrymander. In short, no. The article does a great job explaining how, basically, it might seem like it because more Democrats are predicted to be elected based on various models. But, that is only because the map was so extremely gerrymandered in the past that any effort to increase competitiveness or fairness would make Republicans more likely to lose seats.
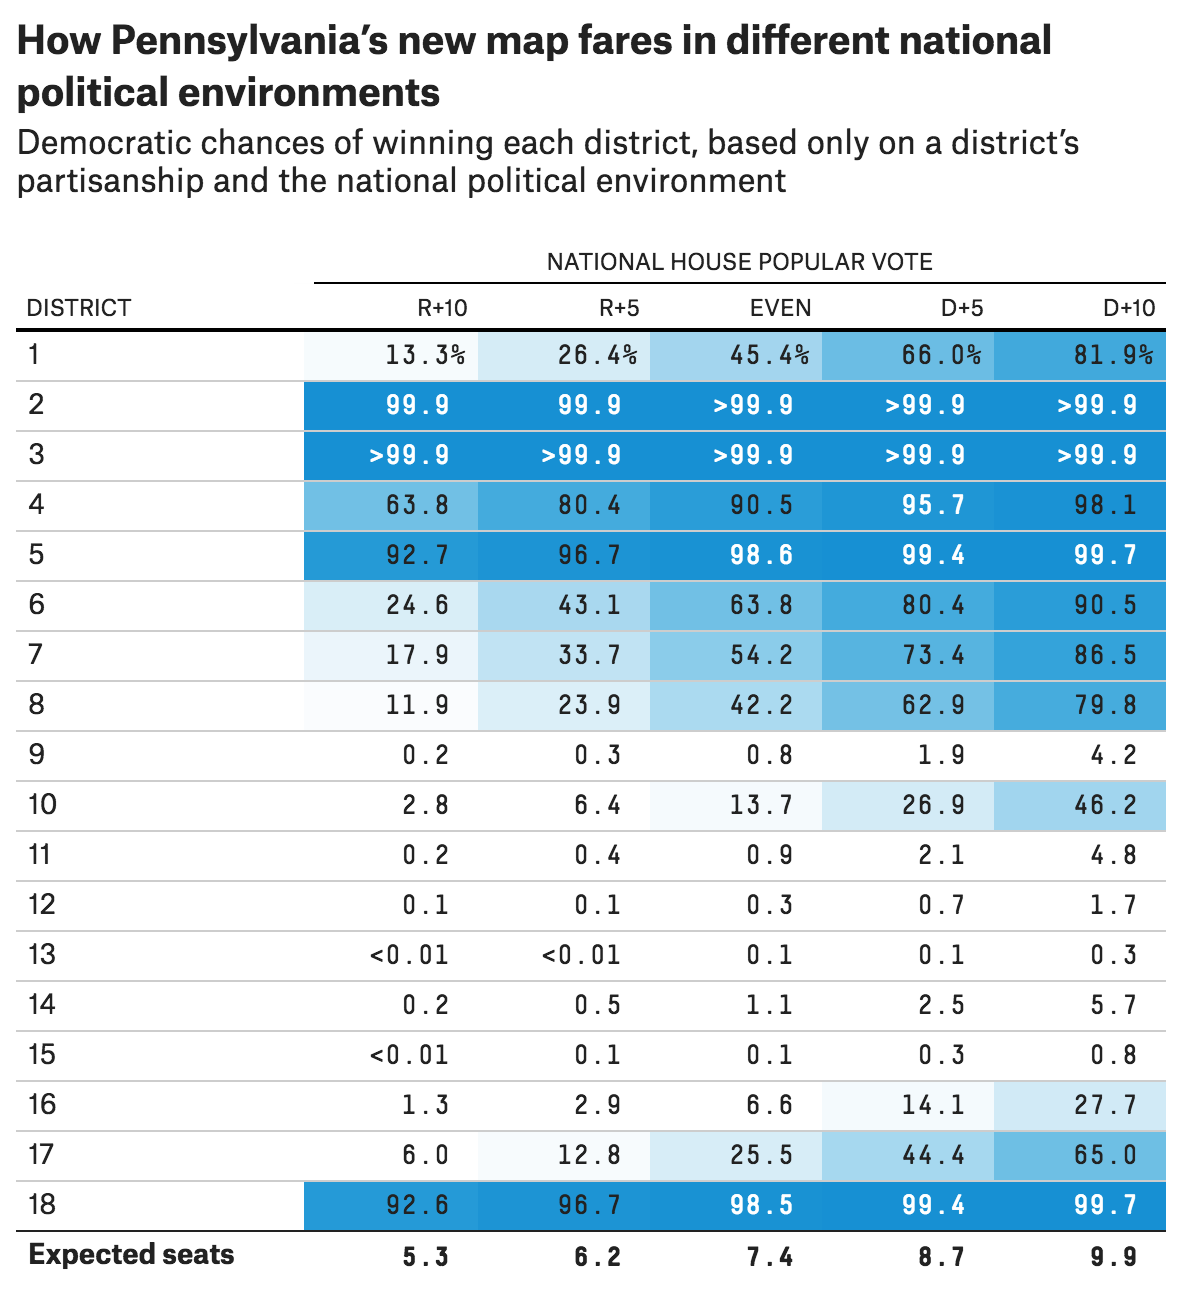
This one table in particular does a nice job showing just how in an average election cycle there are only four seats that you could consider reliably Democratic whereas there are six that are reliably Republican. And keep in mind that Pennsylvania actually exhibits the reverse split—there are more Democrats than Republicans in the state. So even with this new map, the state exhibits a slight Republican bias.
Credit for the piece goes to Aaron Bycoffe.
Leave a Reply
You must be logged in to post a comment.