The Evolution of the S&P 500

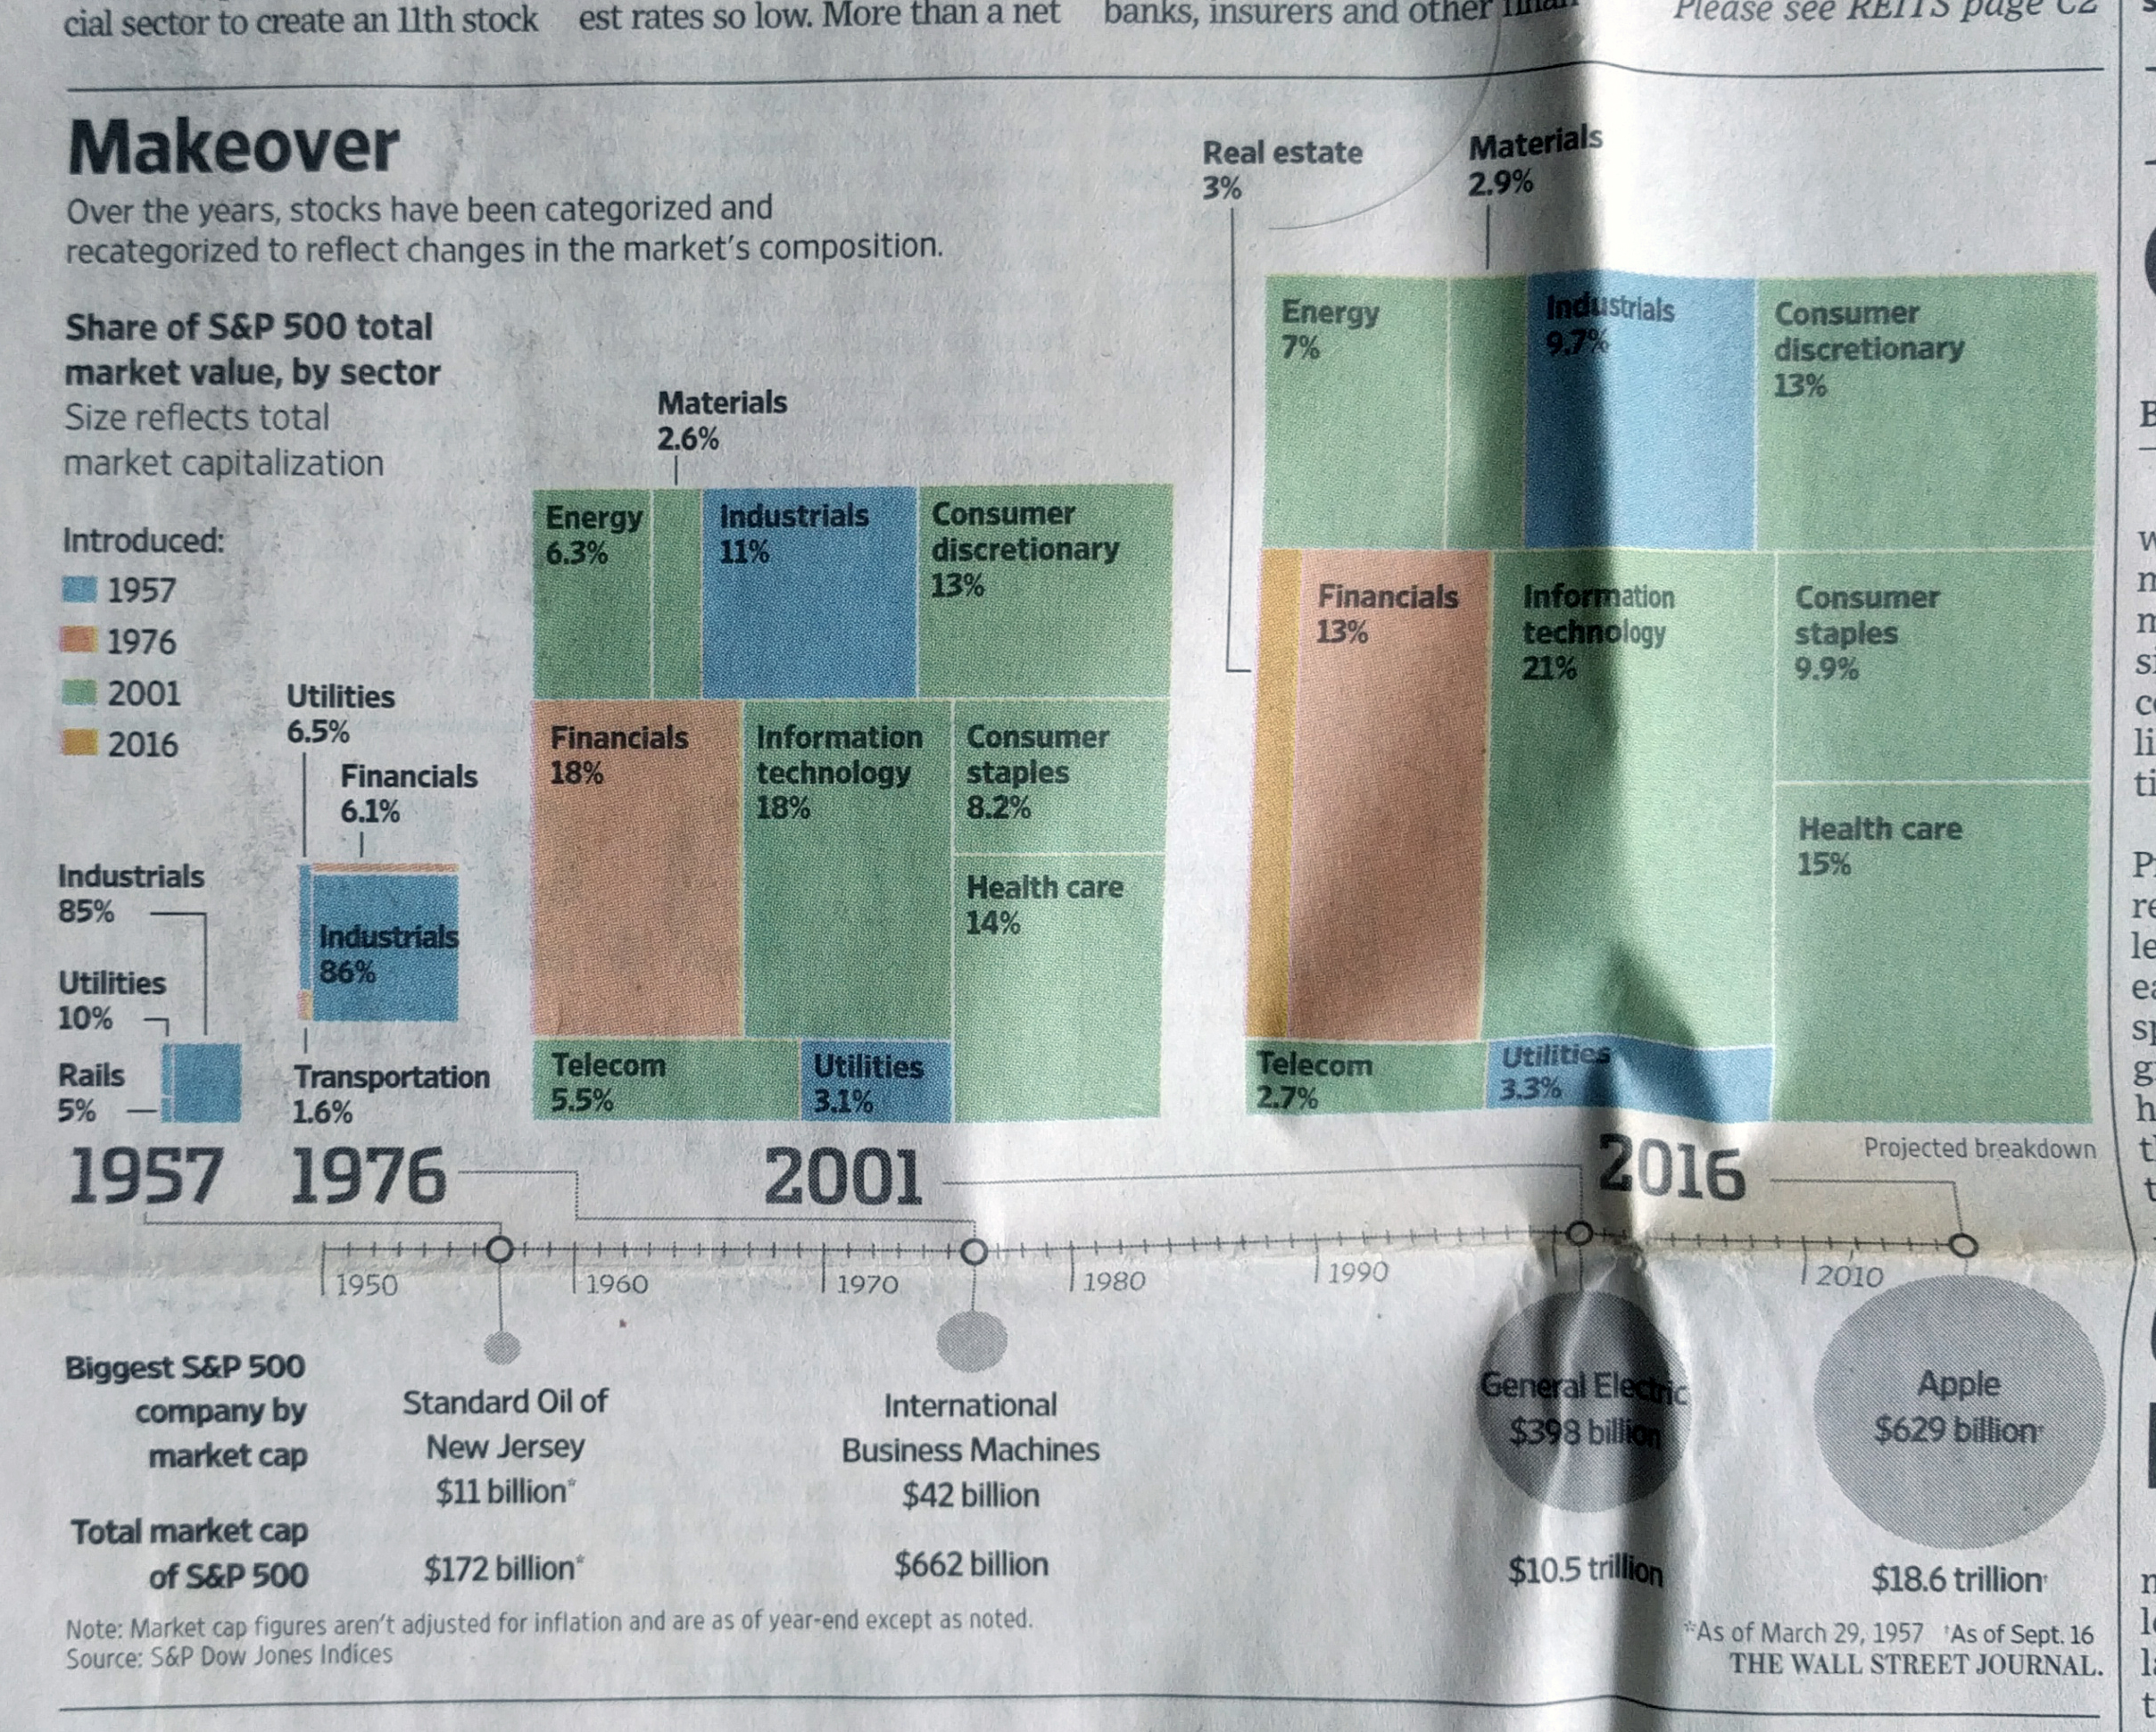
I found myself doing a bit of summer cleaning yesterday and I stumbled upon a few graphics of interest. This one comes from a September 2016 Wall Street Journal article about the changes in the S&P 500, a composite index of American stocks, some of the 500 largest.

In terms of the page design, if it were not for that giant 1/6 page advert in the lower right corner, this graphic could potentially dominate the visual page.  The bulk of it sits above the page’s fold and the only other competing element is a headshot to the upper-right. Regardless, it was clearly enough to grab my attention as I was going through some papers.

The overall page
The overall page

As for the graphic itself, I probably would have some done things differently.
Trees?
Trees?

To start, are these actual tree maps? Or are they things attempting to look like tree maps? It is difficult to tell. In an actual tree map, the rectangles are not just arranged by convenience, as they appear to be here. Instead, they are in descending—or perhaps occasionally ascending—area, within groupings.

The groupings would have been particularly powerful here.  Imagine instead of disparate blue boxes for industrials and utilities in the latter two years that they were combined into a single box. In 2001, that box may have been larger than the orange financials. Then by 2016, you would have seen those boxes switch places—in both years well behind the green boxes of 2001 debuts. If instead the goal was to show the percentages, as it might be given each percentage is labelled, a straight bar chart would have sufficed.

I am not always a fan of the circle for sizes along the bottom. But the bigger problem I have here is the alignment of the labelling and the pseudo-tree maps. One of my first questions was “how big are these years?”. However, that was one of the last points displayed, and it is separated from the tree maps from the listing of the largest company in the index from that year. I would have kept the total market cap closer to the trees, and perhaps used the whole length of line beneath the trees and instead pushed the table labels somewhere between the rather large gap from 1976 and 2001.

Credit for the piece goes to the Wall Street Journal graphics department.

The Affordable Care Act You Likely Know as Obamacare

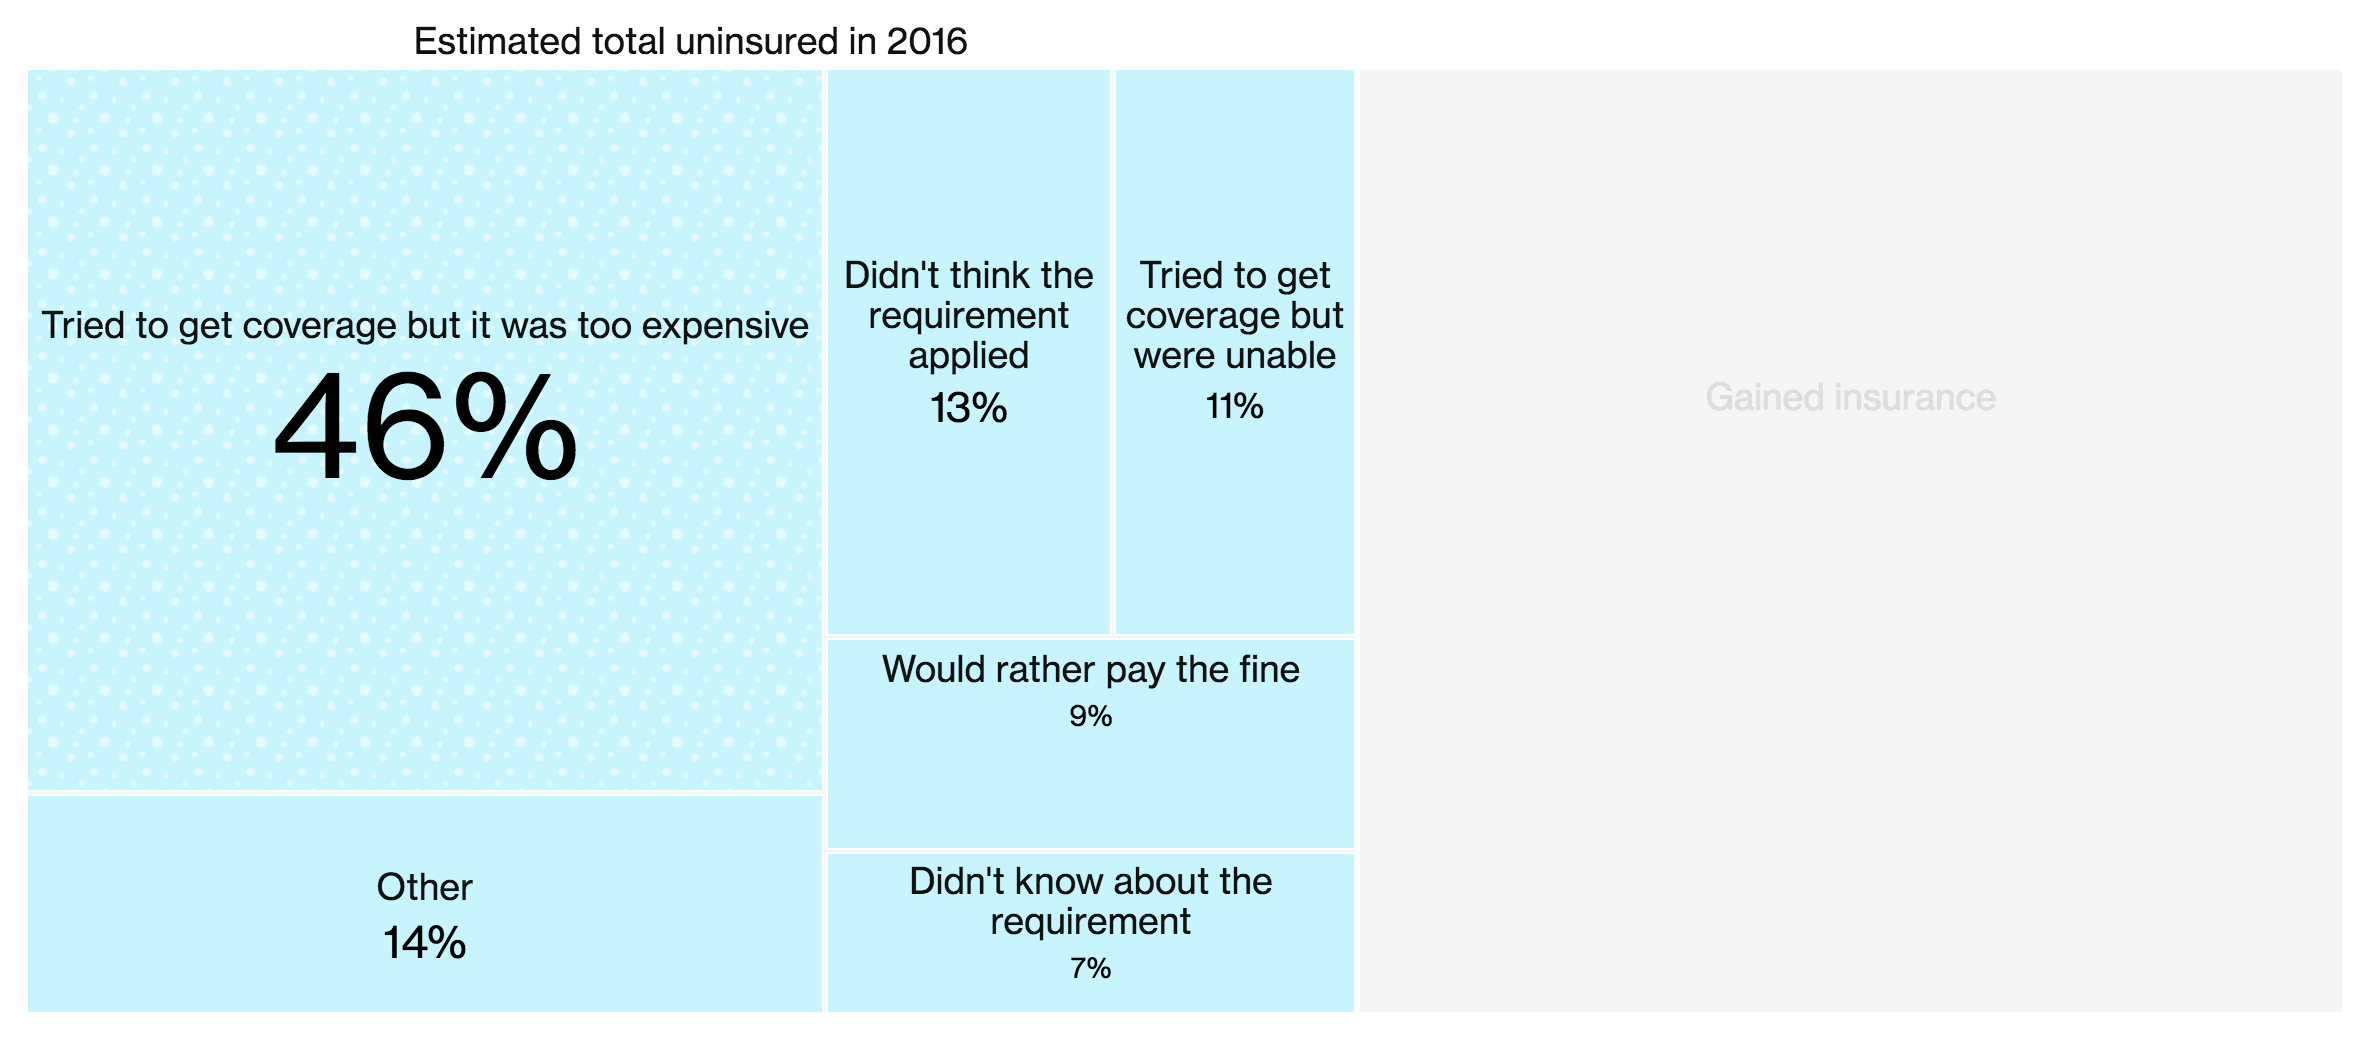
It just won’t die. Grandma, that is, in front of the death panels of Obamacare. Remember those? Well, even if you don’t, the Affordable Care Act (the actual name for Obamacare) is still around despite repeated attempts to repeal it. So in this piece from Bloomberg, Obamacare is examined from the perspective of leaving 27 million people uninsured. In 2010, there were 47 million Americans without insurance and so the programme worked for 20 million people. But what about those remaining 27?

I am not usually a fan of tree maps, because it is difficult to compare areas. However, in this piece the designers chose to animate each section of the tree as they move along their story. And because the data set remains consistent, e.g. the element of the 20 million who gained insurance, the graphic becomes a familiar part of the article and serves as a branching off point—see what I did there?—to explore different slices of the data.

This is a tree map I actually think works well

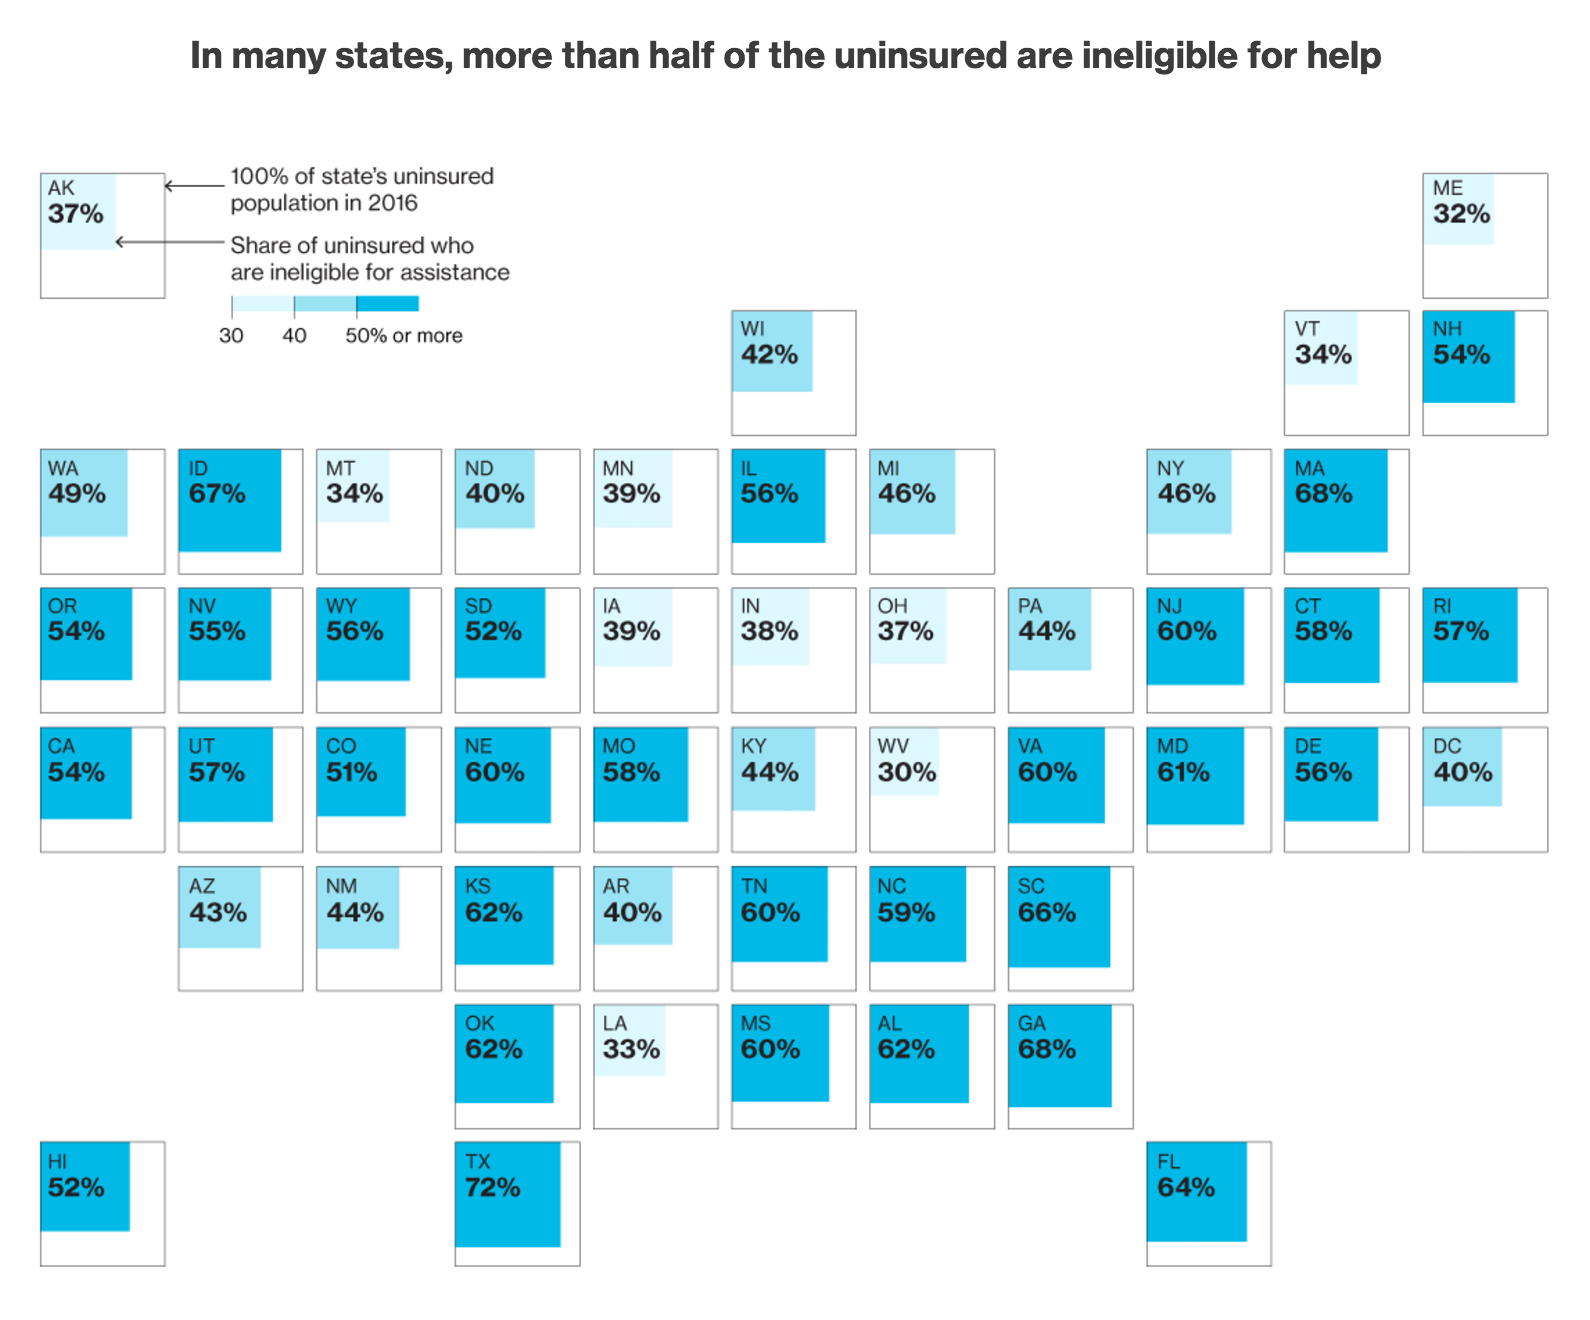
So in the end, this becomes one of those cases where I actually think the tree map worked to great effect. Now there is a cartogram in the article, that I am less sure about. It uses squares within squares to represent the number of uninsured and ineligible for assistance as a share of the total uninsured.

I'm not sure the map is necessary here
I’m not sure the map is necessary here

Some of the visible patterns come from states that refused to expand Medicaid. It was supposed to cover the poorest, but the Supreme Court ruled it was optional not mandatory and 19 states refused to expand the coverage. But surely that could have been done in a clearer fashion than the map?

Credit for the piece goes to Jeremy Scott Diamond, Zachary Tracer, and Chloe Whiteaker.

If the Government Were a Household

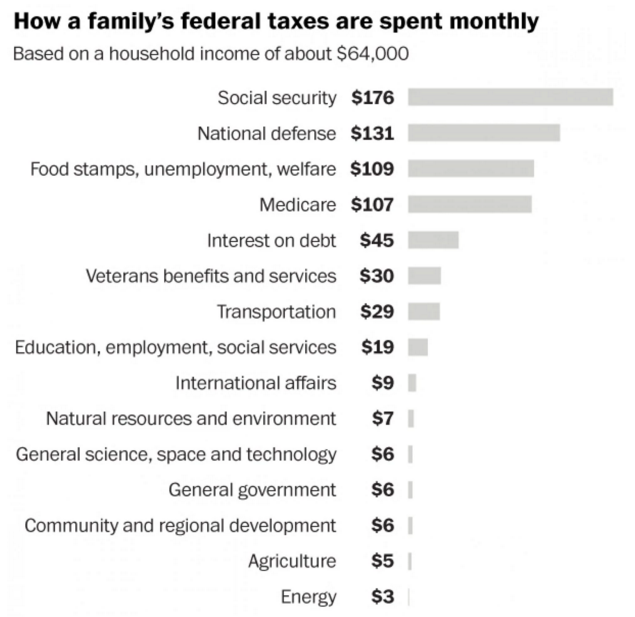
One of the things that irritates me about when people complain about government spending is the comparison against household budgeting. The two are very different. I mean on the surface, I suppose yes, both have income and both spend on stuff and services. But, to put it all in context there is this nice piece from the Washington Post that shows what US federal government monthly spending looks like from the perspective of a household earning $64k.

The government-is-a-household budget

I wish I could get away with that level of spending on housing and transportation…

Credit for the piece goes to the Washington Post graphics department.

The History and Future of Data Visualisation

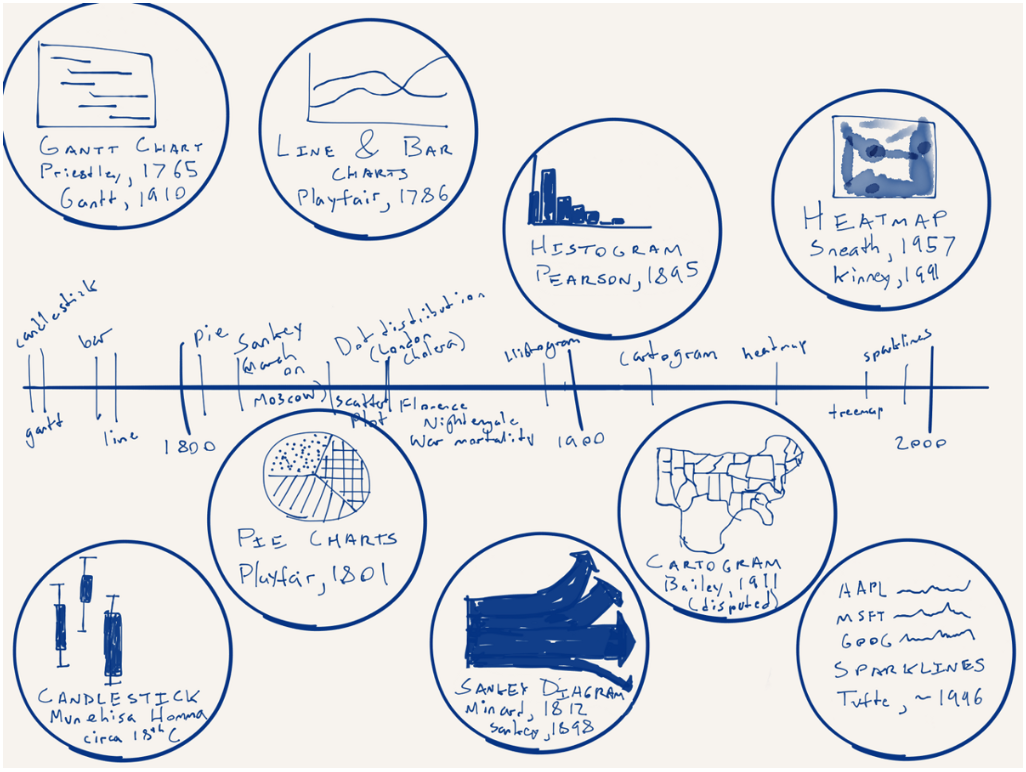
From time to time in my job I hear the desire or want for more different types of charts. But in this piece by Nick Brown over on Medium, we can see that there are really only a few key forms and some are already terrible—here’s looking at you, pie charts. How new are some of these forms? Turns out most are not that new—or very new depending on your history/timeline perspective. Brown illustrated that timeline by hand.

A timeline of chart forms

Worth the read is his thoughts on what is new for data visualisation and what might be next. No spoilers.

Credit for the piece goes to Nick Brown.

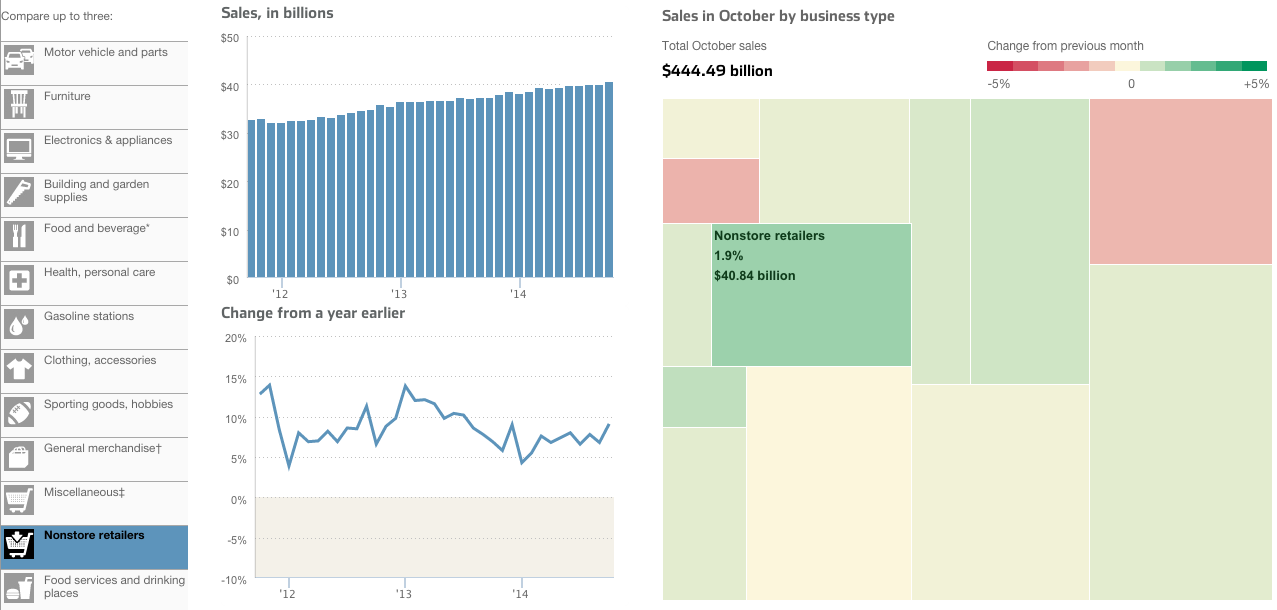
Whence do US Retail Sales Come?

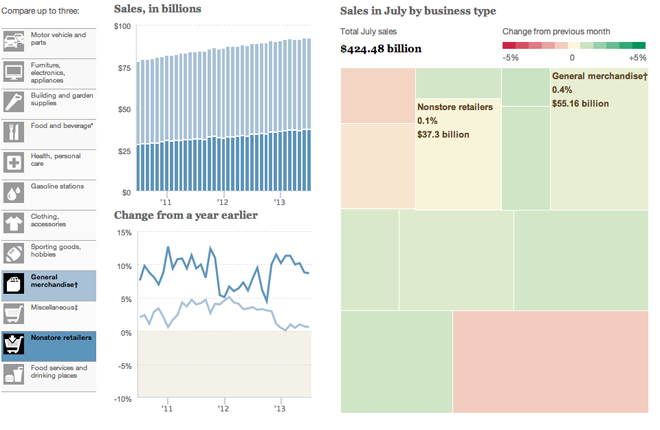
Today’s piece comes from the Wall Street Journal. It looks at US retail and foodservice spending through different types of stores.

Retail sales by store type

I take issue with a few things, firstly the tree map. Because it’s not really a tree map. Another thing I am not keen on is the comparison feature in the piece. The user can select up to three types of stores to compare. And while the result works in the line chart—three lines—the bar chart devolves into a near useless component. There is no easy way to compare the actual lengths of the individual bars short of mousing over and scribbling down each individual datapoint. In the particular case here, I likely would have changed from bars to line. Because that way I can compare the actual magnitude of each store type.

Credit for the piece goes to Dan Hill.

Average Ticket Prices in 2013

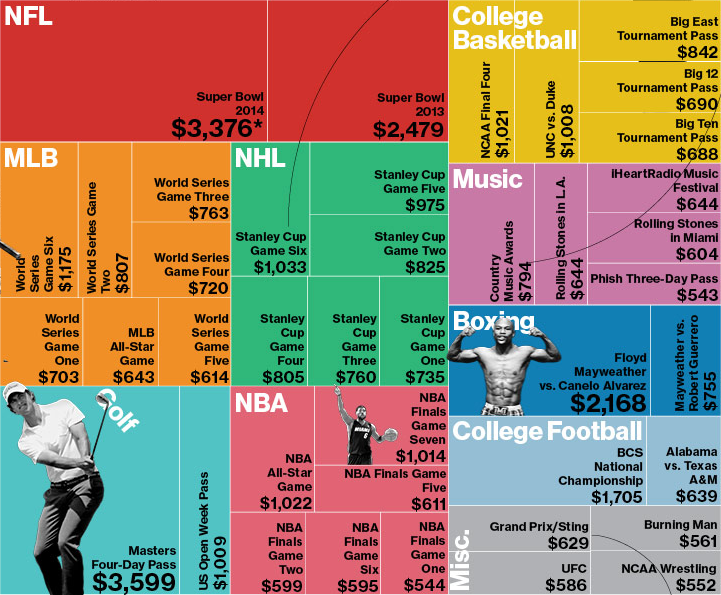
So yeah, the Super Bowl thing. Apparently tickets are expensive? Earlier, Bloomberg Businessweek took a look at average prices for the most expensive events of 2013. The only sentence supporting the graphic was that the most expensive event was not the Super Bowl. Okay, so what was?

Most Expensive Average Ticket Prices

I think this graphic actually makes it more difficult to tell. But beyond that, the decision to use the tree map confuses me. We are already looking at a subset of ticket prices—not all, but only the “most expensive”. What criteria determined that selection? After all, from my own experience and personal knowledge I know that Red Sox–Yankees game are also incredibly expensive. But those are not present in this set. And then if the idea is to undermine the common thought that the Super Bowl is the most expensive ticket, should the user be forced to find through each square—and no, the events are not squarified very nicely—the highest value?

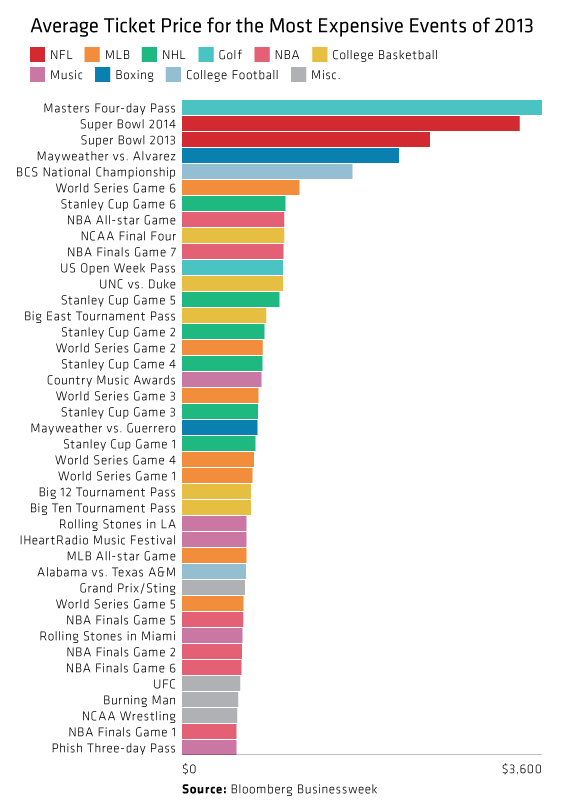
So I took an hour before the game to try a quick stab at quickly identifying the most expensive tickets. It turns out that the glorious bar chart more than suffices. It also then shows how quickly the remainder of the prices become quite comparable. (Ridiculous I suppose depends upon your preference for sport/event/disposable income.)

My quick take
My quick take

Credit for the original piece goes to Bloomberg Businessweek.

Deformed Tree Map

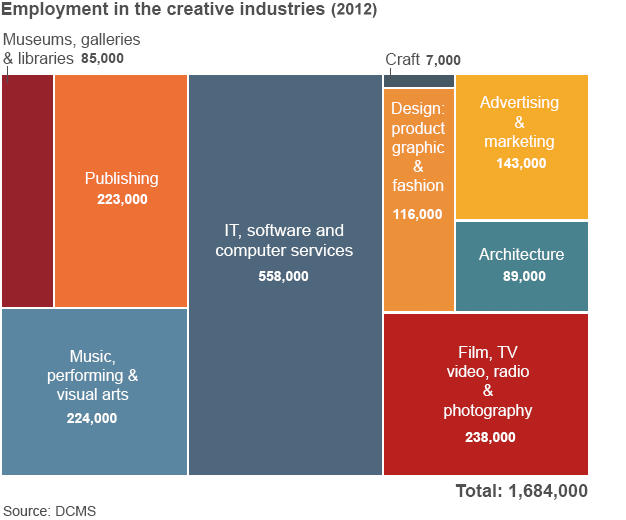
Yesterday the BBC published an article about the success of the United Kingdom’s creative industry especially given the not-so-successful economy of the last few years. Unfortunately, the article included the tree map below.

A not so necessary tree map

The problems are a few. First, a tree map is usually looking at two variables. One is encoded through the size of the block and the other often its colour. Here, colour means nothing. So you are instead looking at only the size of the blocks. Basically, the same type of information that would be clearer to differentiate if this were a bar chart.

Second, a tree map has a hierarchy of placement. In other words, even if you cannot tell how much larger one block is from another—we all know we are not so great at comparing areas—you know which block is larger than the other by their arrangement in the map. Here we see no such hierarchy. The smallest block follows the largest block, which itself follows three other blocks.

Now that arrangement would be acceptable if the tree map were nested. That is to say if the different industries were grouped within like industries. Because then you would order those nested blocks. But that is also something not happening here.

All in all, this would have been a lot more effective of a chart if it had simply been made into a bar chart.

Credit for the piece goes to the BBC graphics department.

Consumer Spending by Store Type

Today’s post is a small interactive from the Wall Street Journal that allows the user to explore consumer spending not by category of spending, but rather the type of store in which they are spending, e.g. grocery retailers. Consumer spending is a fairly important measure of the US economy since so much of our economy depends upon it (I want to say roughly two-thirds, but I cannot recall exactly).

Comparing retail spending by type of store

This piece has a few interesting things going for it. Firstly is the ability to compare and contrast three different retail channels (My screenshot compares only two). An unlimited amount would have been far too many, but three is a manageable number, especially in the various charting components used.

The tree map is interesting. I like the idea of using them, but I am not sure this is the best application. First, a tree map is fantastic for showing hierarchy. If, for example, there were sub-channels of the big retailing types, they could be nested within, well, squares or rectangles. But here the size and growth could have been compared perhaps more easily in a scatter plot. Secondly, I cannot determine the order for which the channels have been arranged. Clearly it is not by size, because the small ones are near the top. Nor is it reverse, because there are smaller ones where there should be larger ones.

Then the bar chart. An interesting idea, to be sure, of aggregating the sales per channel to see their total value. But if the goal is to compare them, would not a line chart looking at both separately not in aggregate show size and relative gains/declines against the other?

Credit for the piece goes to Dan Hill.

Campaign Contributions

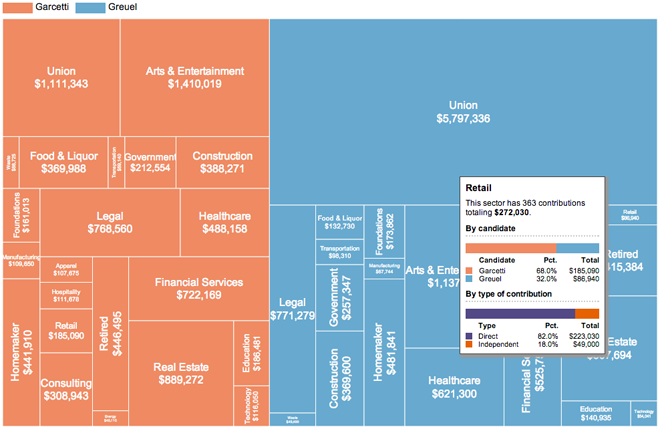
On 21 May, Angelenos went to the polls to elect the next mayor of Los Angeles. The contest followed an earlier vote that prompted the day’s run-off election. This graphic from the Los Angeles Times examined the contributions to the campaigns of the two finalists, Eric Garcetti and Wendy Greuel.

The overall piece features an interesting interactive component that allowed the user to switch from a scatter plot view to a stacked bar chart view and then filter those results based on whether they were direct or indirect contributions. Generally speaking, that element worked. However, I want to focus on the second big component: an interactive tree map.

Tree map with rollover

While not all tree maps have to be squarified, by converting datapoints to (roughly) similar shapes the user should have an easier time comparing the area of the objects. This tree map is not squarified and so the user must strain to convert all the different shapes into roughly equal shapes for a visual comparison. Nor is there an inherent ranking within the map—at least not that I can find. That would also help.

So while the tree map is not a success in and of itself, the rollover condition makes for a more interesting overview of the different sectors of contributions. But despite this added value in the rollover,  the data powering the tree map would still be better presented in a different format.

Credit for the piece goes to Maloy Moore and Anthony Pesce.

Average Household Spending

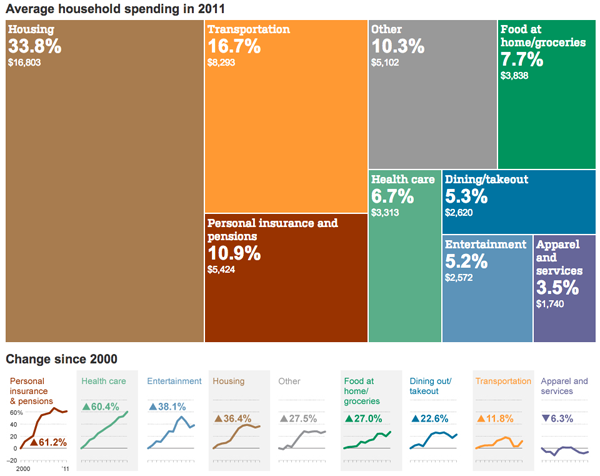
This tree map from the Wall Street Journal looks at an interesting subject: average household spending. How much are we spending on housing, on food, on transportation, &c.?

Household spending
Household spending

But I’m not so sure that the main visualisation is necessary. I appreciate the big colour and splashiness, but the space use seems inefficient. Perhaps if the colours had been tied, as is commonly seen, to another variable, the tree map would be more useful. Imagine if the chart looked at the spending value and the average growth over the last ten years, with the year-by-year value still plotted below.