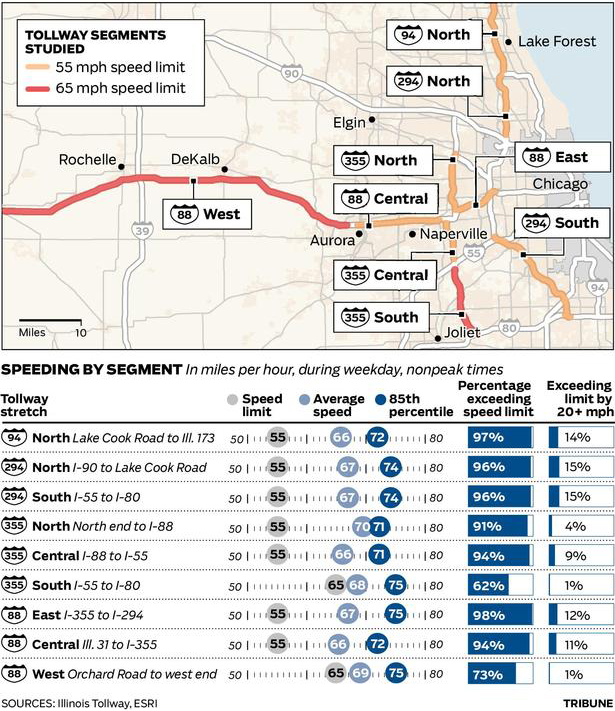
The Illinois Tollways will be raising speed limits starting 1 January. Part of that process includes researching current driving habits and patterns. This graphic by the Chicago Tribune looks at some of the results. While the map part is necessary to show the routes themselves and the limits on those routes, the more interesting part is the dot plot below.
Credit for the piece goes to the Chicago Tribune’s graphic department.
Leave a Reply
You must be logged in to post a comment.