Baltimore is going crazy, if you haven’t heard. So the LA Times put together a set of maps putting the riots in context. They look at the racial makeups of the neighbourhoods with the violence along with median income and education.
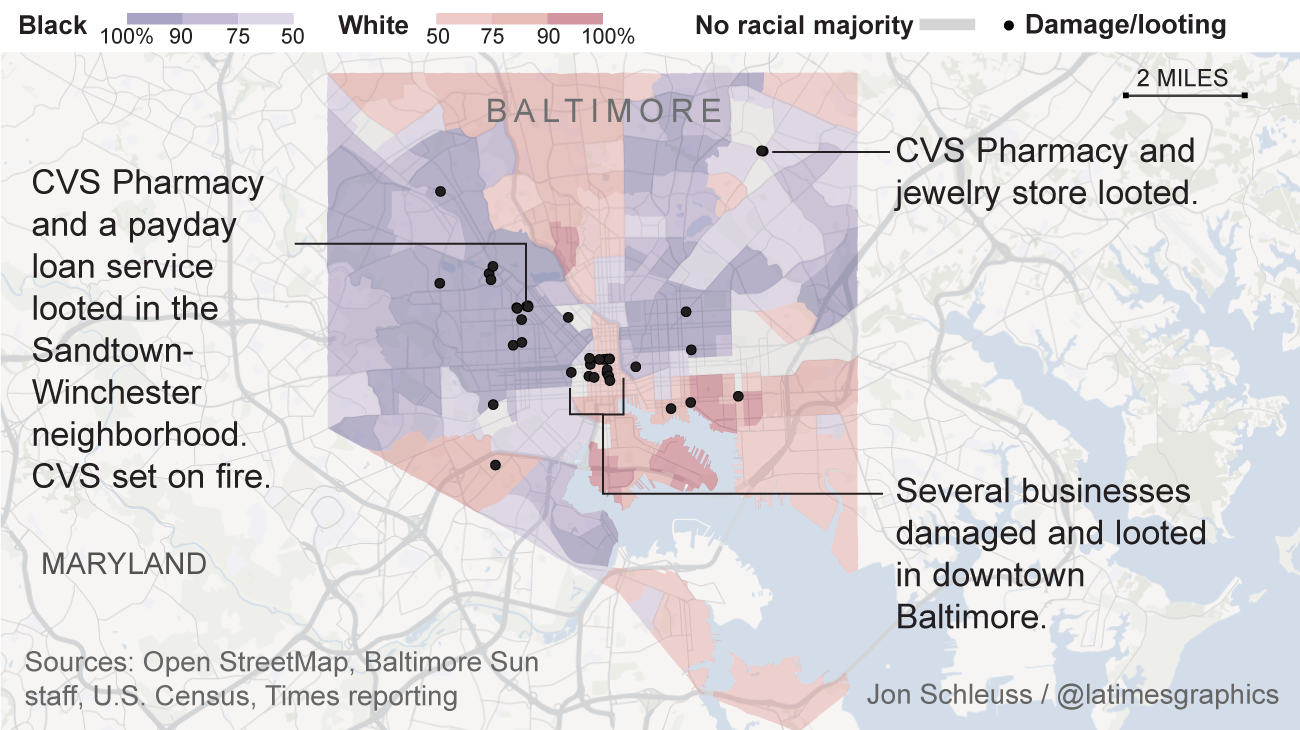
Credit for the piece goes to Jon Schleuss, Kyle Kim, and the LA Times graphics department.
Leave a Reply
You must be logged in to post a comment.