Earlier this week I read an Associated Press (AP) article about Poland’s economic growth since the end of Communism in the former Soviet-bloc state. Generally speaking, things are good in Eastern Europe, though a revanchist Russia to Poland’s east rekindles memories of an earlier era and the disaster after the Molotov–Ribbentrop Pact.
The article included a few charts showing the growth of the Polish economy since 1990 and I instantly had to flag it and bookmark it to bring it up here on Coffeespoons.
It started off fine with a big bar chart.
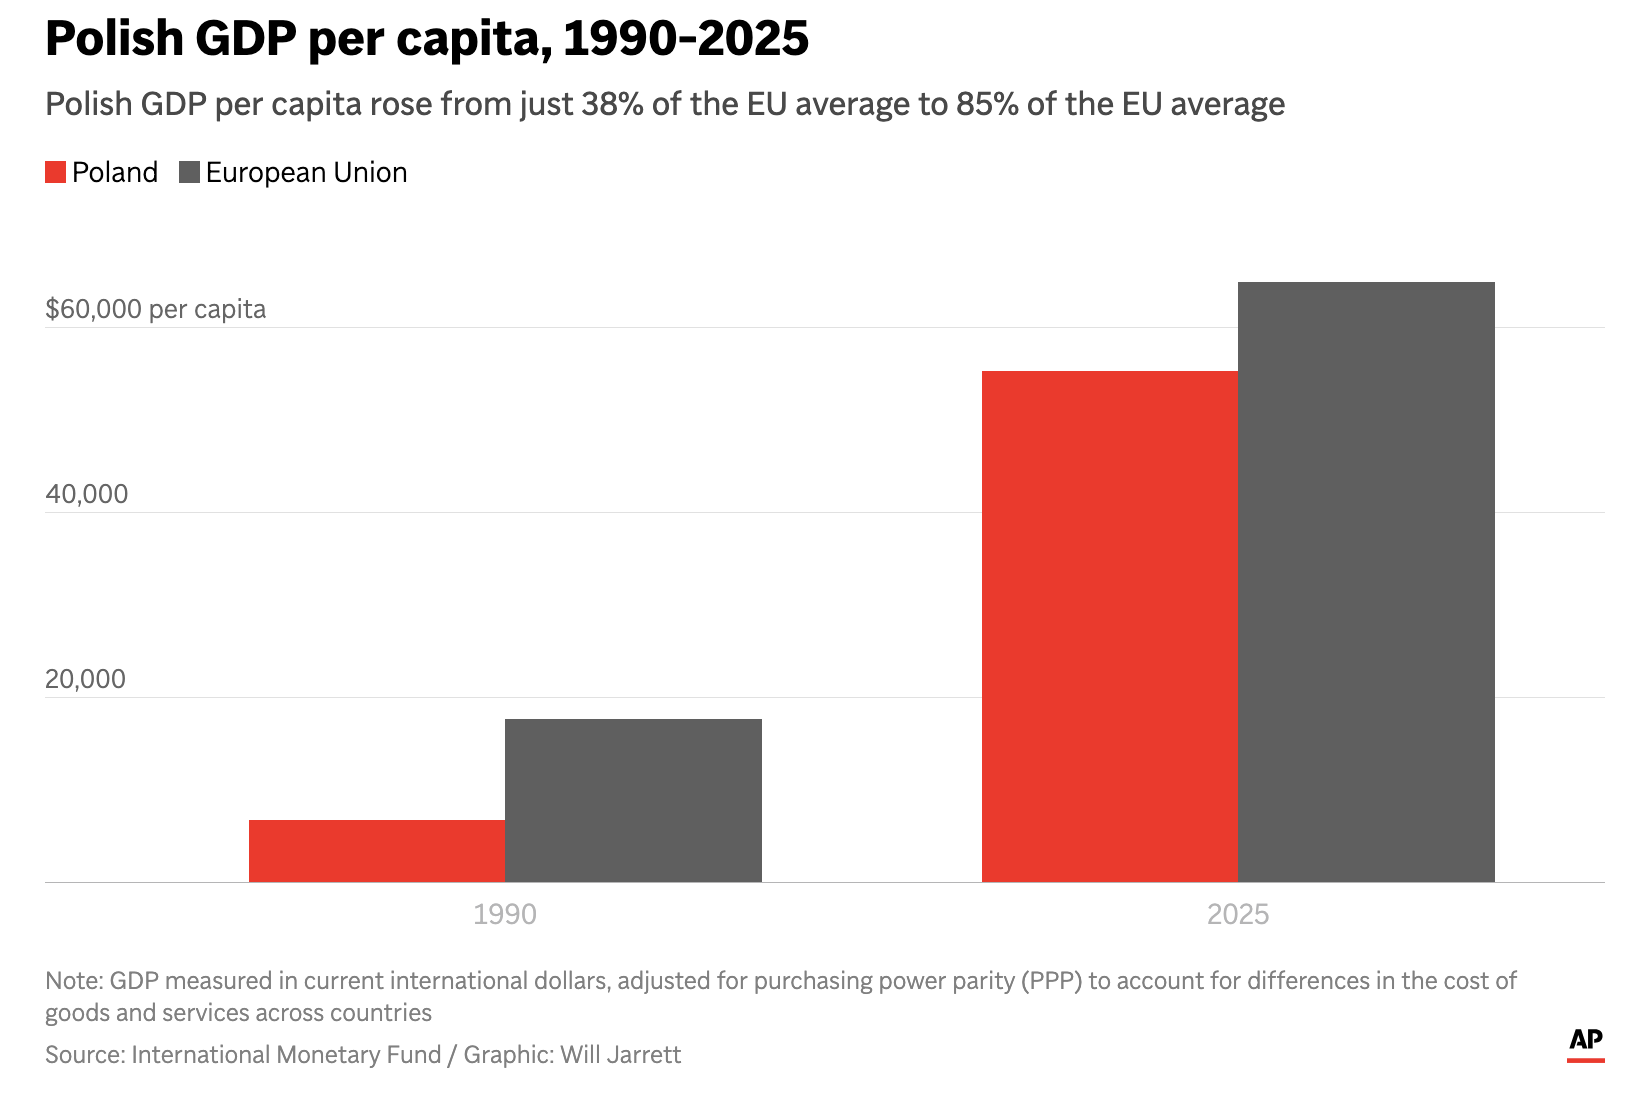
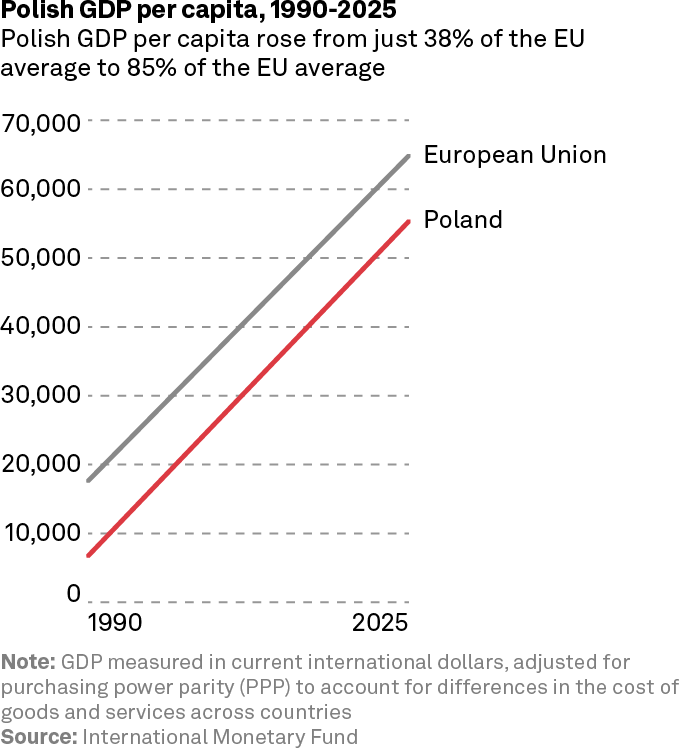
Nothing too glaringly off about this. I could argue this chart need not be this large as it contains only four data points. A significantly smaller line chart could work in its place. I took a few minutes and threw one together and set it here just to show how that could work.
A significantly smaller line chart could work in its place. I took a threw minutes and made one, trying to emulate AP’s style, and uploaded it to this post and set it as a half-column image. If I nitpicked and tweaked this a bunch more, I think I could dial it in and get it work even more smoothly—looking at you WordPress padding here—but you get the point. A full-column width image for the above image is not necessarily needed.
The article makes use of some nice photography to break things up, including a shot of the famous Palace of Culture and Science in Warsaw. Back in 2013 I had a layover in Warsaw and I can still remember seeing said building standing as more or less of an outlier. Not so today as it is surrounded by modern high-rises. My point is that nice photography balances out the article.
But then we have two more charts. We can look at the screenshots in quick succession here.
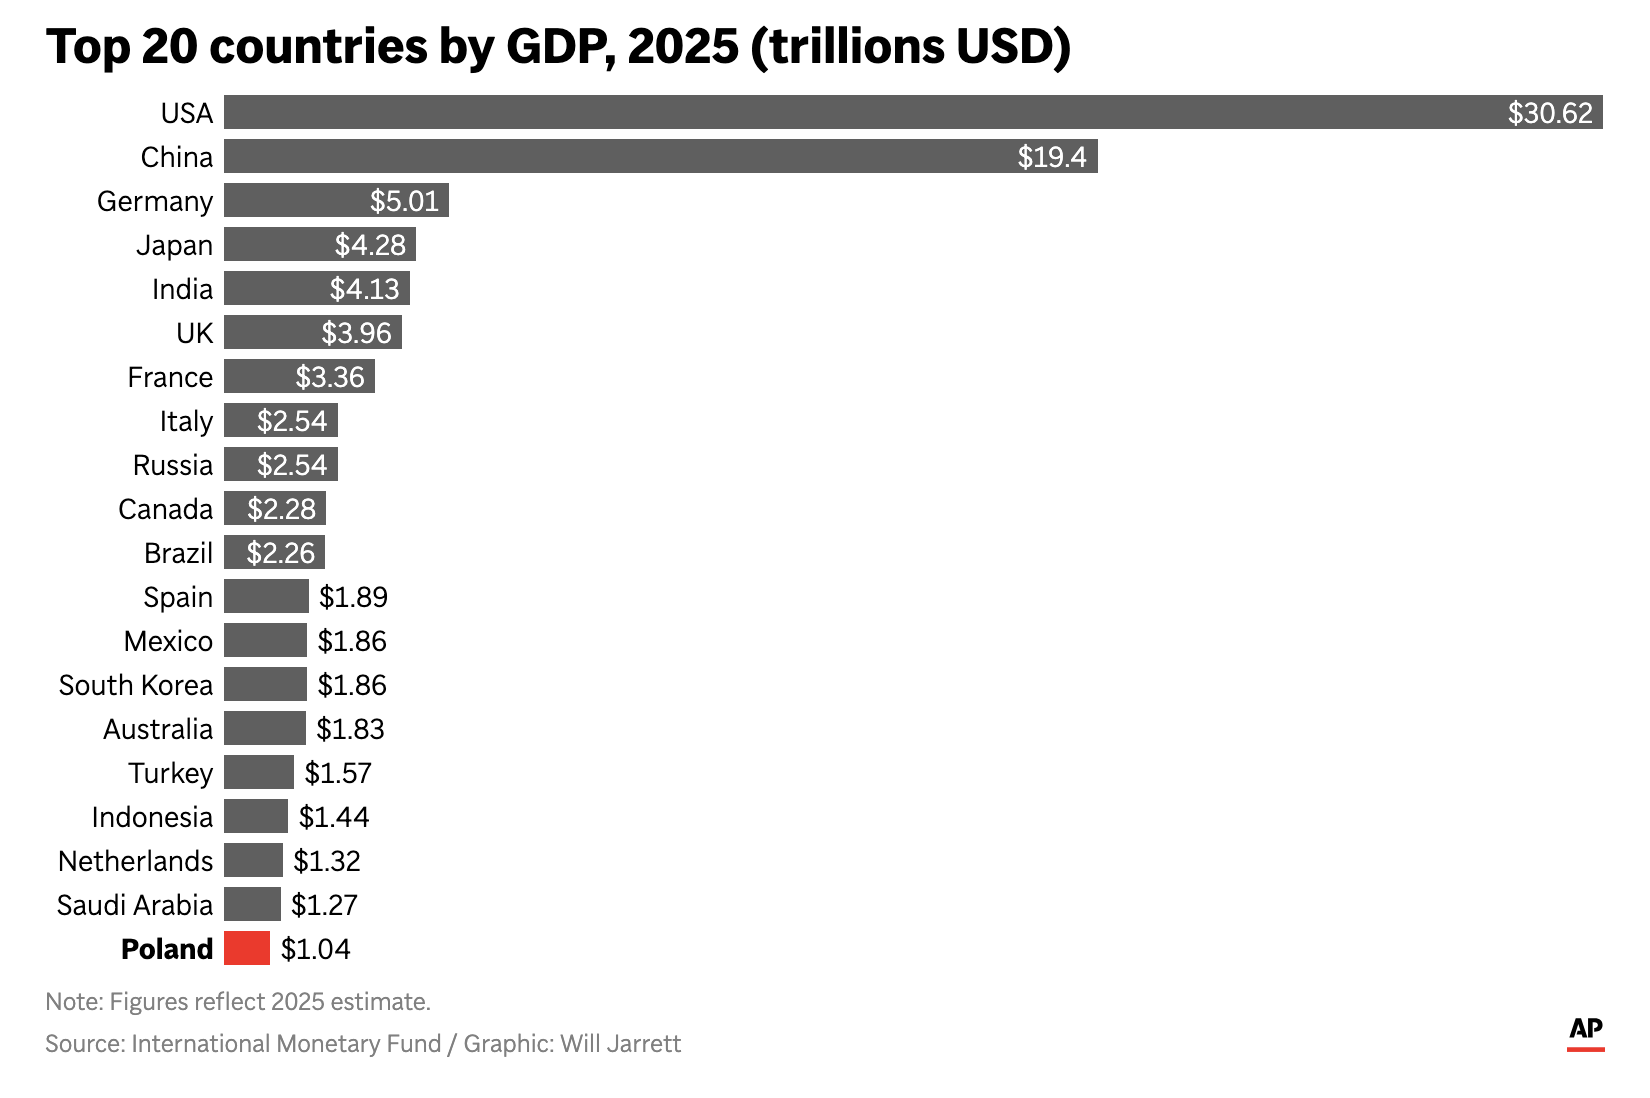
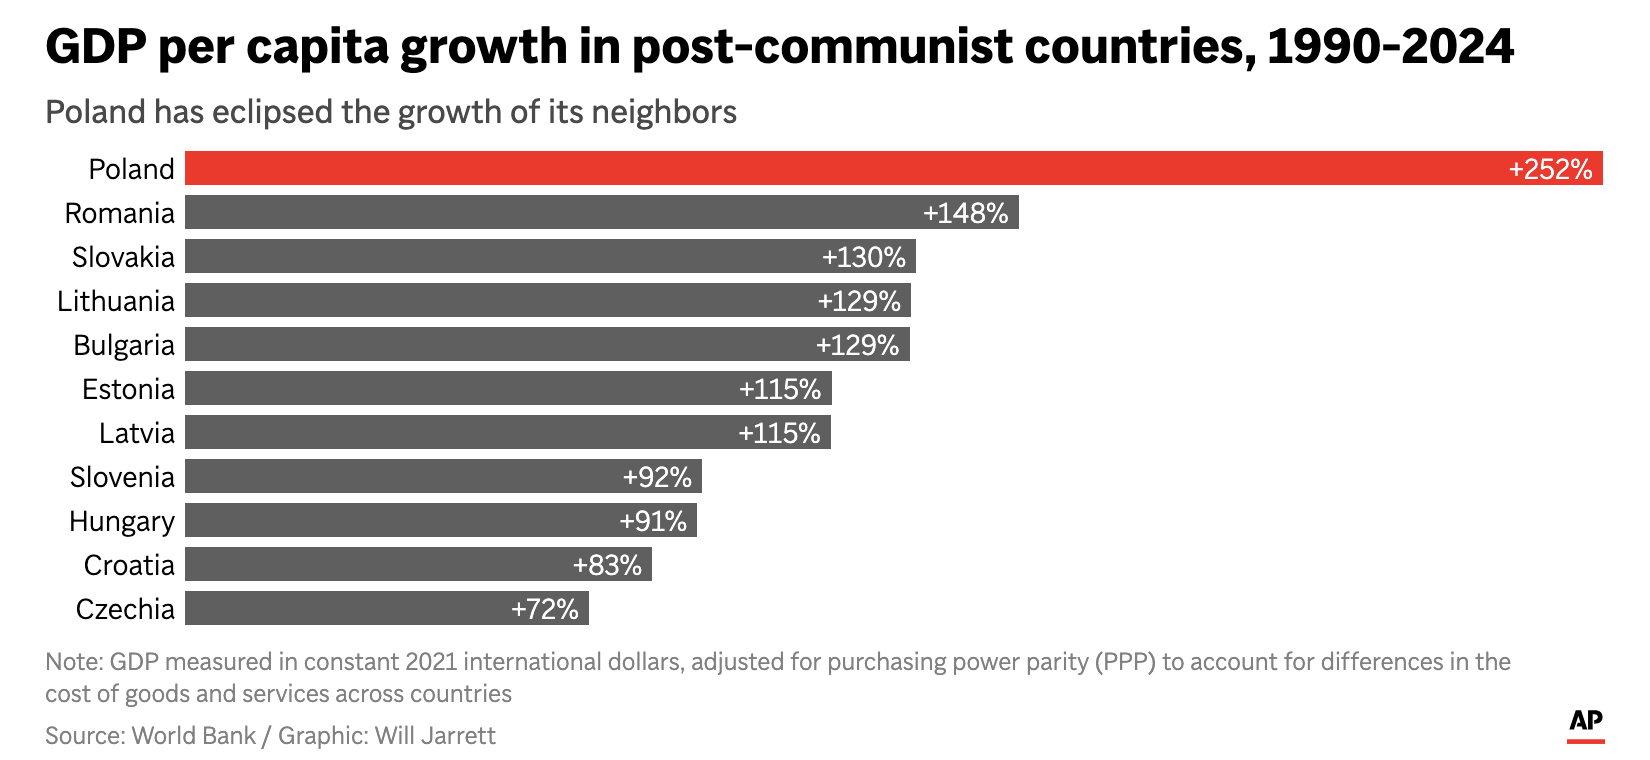
At first glance, these are fine. Bar charts highlighting Poland in red. But when I read more closely, I noticed there were no axis lines. No axis labels. Instead, the designer labelled every individual bar. As if the critical knowledge were that Spain’s GDP was $1.89 tn vs. Mexico’s $1.86 tn. Spoiler: that is not critical.
All the individual labels add visual clutter and distraction to the graphics when simple axis lines would allow the reader to more clearly see the visual pattern in the data. If the reader or user truly needs to know the value of the data point to the hundredths of a degree, a table is a better and clearer way of organising the information.
What truly mystified me, though, was that the first graphic solved this issue easily. Mousing over each bar revealed the data points for that series.
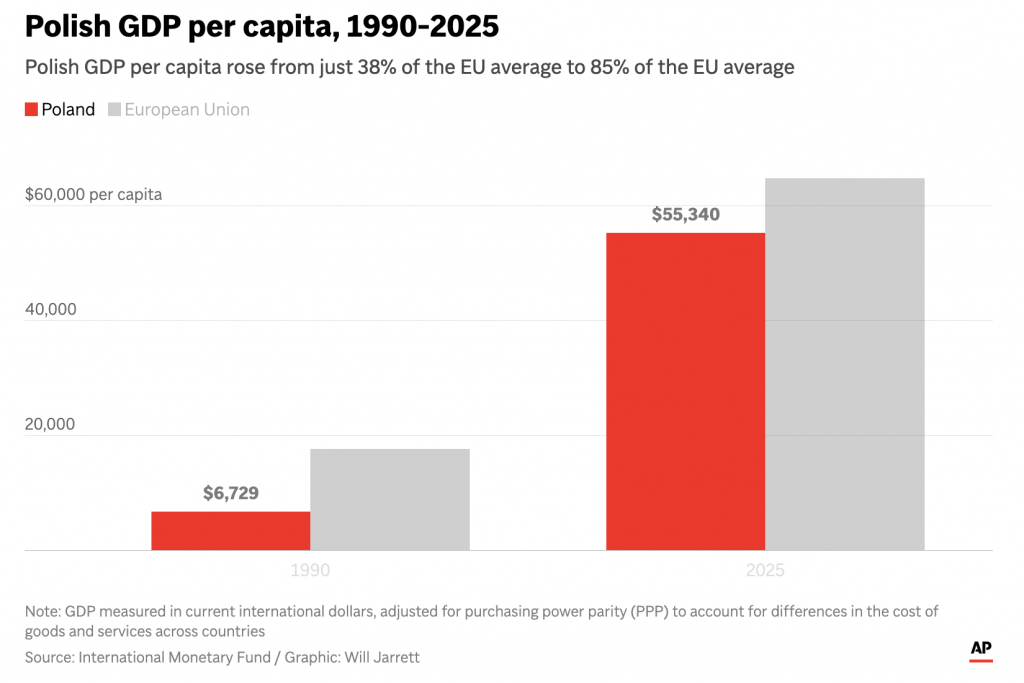
This really is the ideal scenario. If the user must absolutely and truly know to the single digit the GDP per capita of Poland in 1990, this hover state does a great job of revealing the context as an additional layer. The visual clutter and distraction is not first presented to the user.
Clearly the technology exists within AP’s system. The second two graphics left me stunned.
On the data side, I had a minor issue too. The second graphic looked as post-communist countries, but I could find neither rhyme nor reason as to how the countries were selected. A list of post-communist countries would surely include Russia, no? Perhaps it was excluding the former Soviet Union countries? But then Estonia, Latvia, and Lithuania are right there. But missing are Georgia, Armenia, Azerbaijan, et al. If it is supposed to limit itself to non-Russia, eastern European countries, where are the former states of communist Yugoslavia? It is just an odd selection of states to include and leaves that little bit of doubt as to whether the set was cherry picked to leave Poland at the head of the class.
Overall, I enjoyed the article and found it informative. I just think a few more tweaks and it really could have shined.
Credit for the pieces goes to Will Jarrett.
Credit for the alternate version is mine.
Comments
One response to “The Axis in Poland”
[…] to which countries are labelled, I do have some questions, but not like I had in my graphics about Poland the other day. Saudi Arabia, Oman, Iraq, and Turkey all make sense as all have been hit by missiles or drones. […]