Covid-19 Data from Monday

Monday’s Covid-19 data for Pennsylvania, New Jersey, Delaware, Virginia, and Illinois provided a glimmer of good news, most notably in Pennsylvania. That, however, occurred on the same day as a protest in Harrisburg that could set the state back days if not weeks. More on that below.
The situation in Pennsylvania

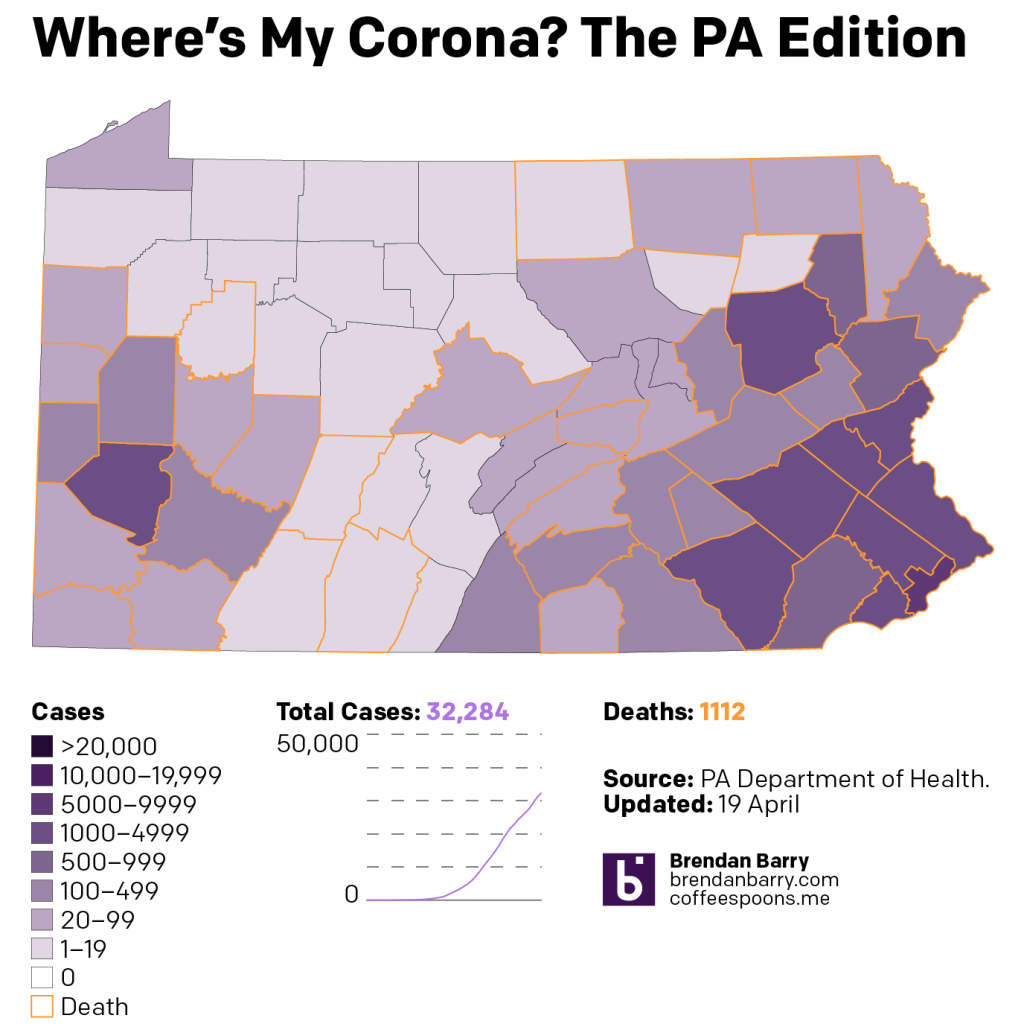
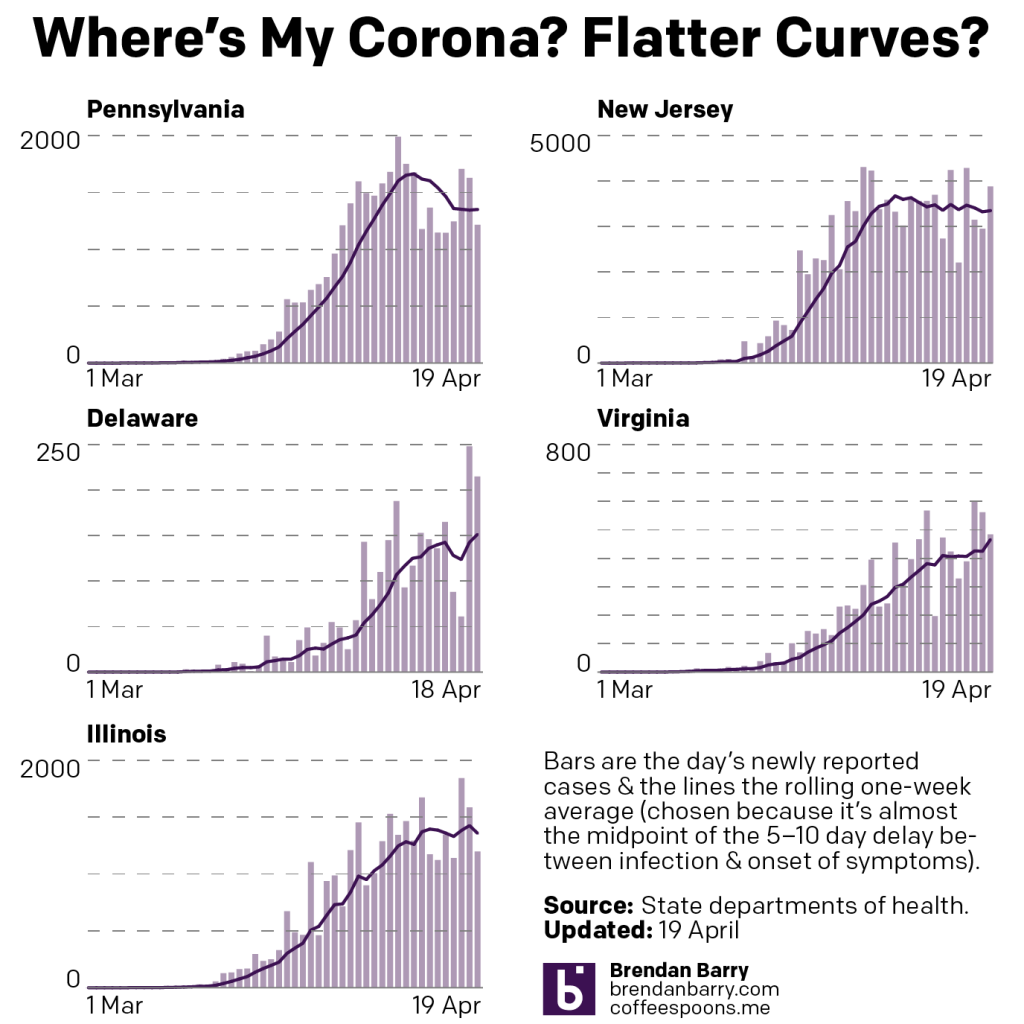
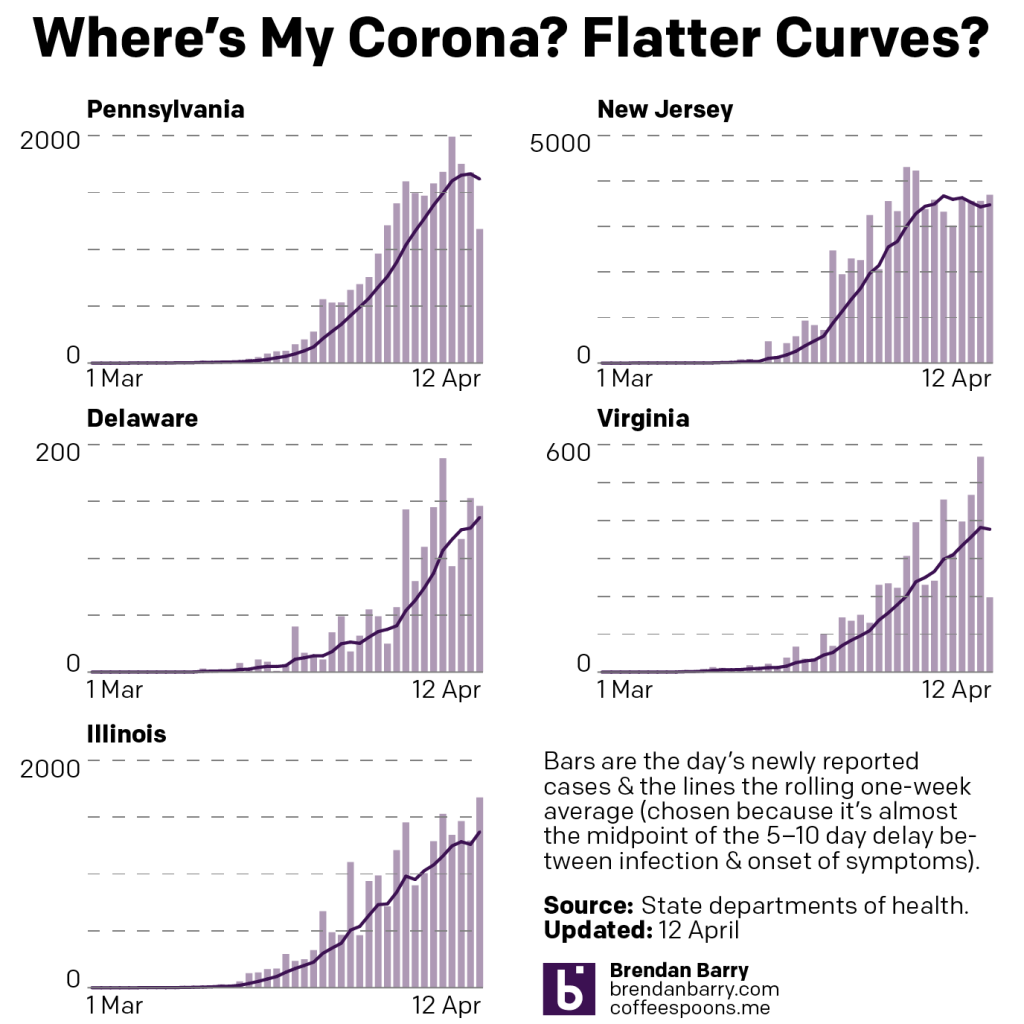
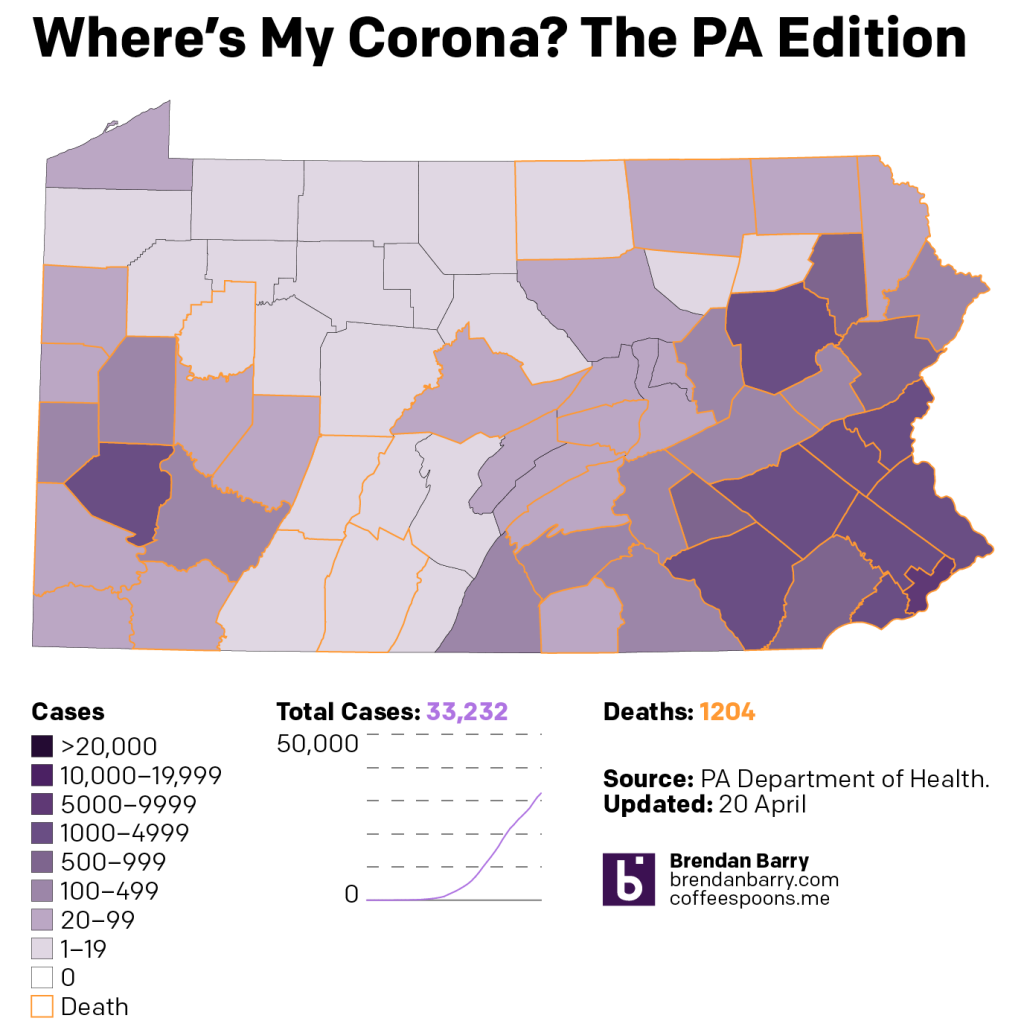
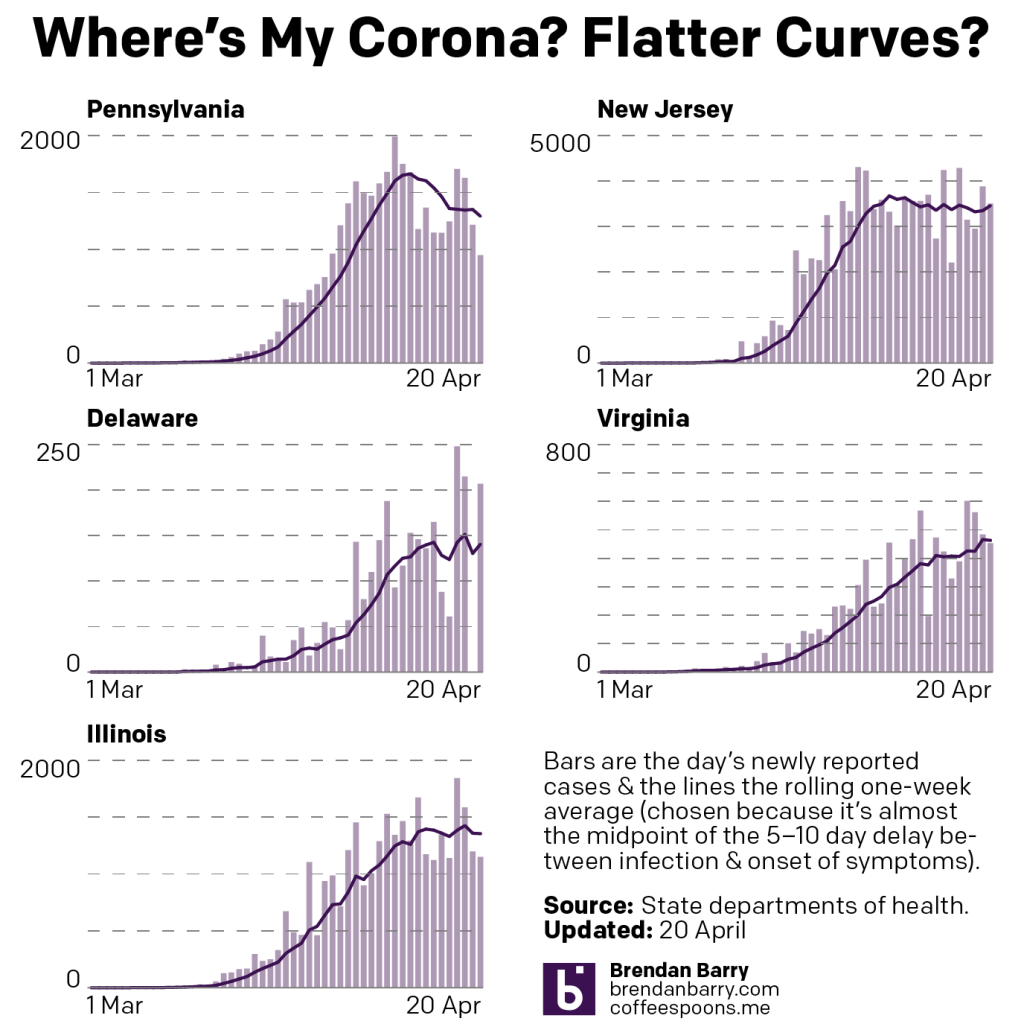
Pennsylvania saw fewer than 1000 new cases for the first time since 1 April. The curve here may be doing more than flattening, but it might actually be falling. That is to say the infection rate is decreasing rather than stabilising and holding steady, as it appears to be doing in New Jersey. That said, new cases are appearing sporadically in the rural and less dense areas of the state. Problematically, protestors arrived in Harrisburg to let it be known they are unhappy with the quarantine. Because the rest of us are.

The problem is that it appears a significant percentage of those infected with the virus are asymptomatic carrier, i.e. they are sick, but do not show any symptoms like fever, coughing, difficulty breathing. Critically, they may not appear sick, but they can spread the sickness. And so a gathering of several hundred people in close quarters? Not ideal.

Compare that to a Christian cultish church in Daegu, South Korea. There, an infected parishioner did not heed government calls to isolate and instead attended a church service. The average infected person spreads this virus to two or three people. This congregant? They infected 43 people who then went on to infect other people.

It is quite possible that someone in that Harrisburg protest was an asymptomatic carrier. And given the lack of social distancing, the lack of masks, and the general reckless behaviour, it is quite possible that the rally could be a super-spreading event. But we won’t know for 5–10 days, the apparent incubation period of the virus. Hopefully we dodge the proverbial bullet. But it is quite easy to see how these kinds of protests could lead to surges in infections. And those surges would then force the government to extend its quarantine by weeks thereby defeating the entire point of the protestors.

We get it. Quarantine sucks. But we all have to suck it up.
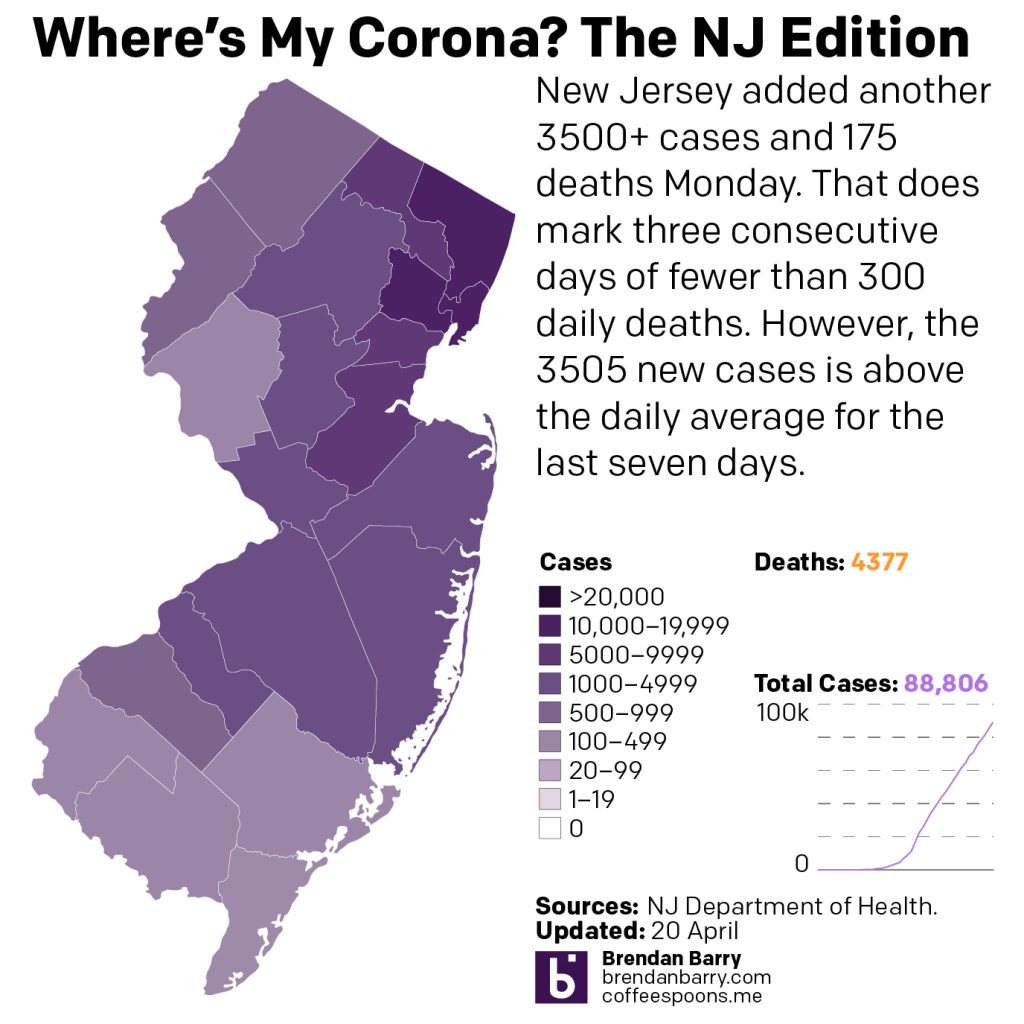
The situation in New Jersey

Moving on to New Jersey, where we see continuing evidence of the plateauing of cases. The bulk of the cases remain in the north in the New York suburban counties with the fewest numbers in the counties in South Jersey. However, averages of nearly 3500 new cases daily remains quite high and the death toll of 4377 is likely to continue to climb higher, even if Monday’s 175 new deaths was lower than most days in recent weeks.
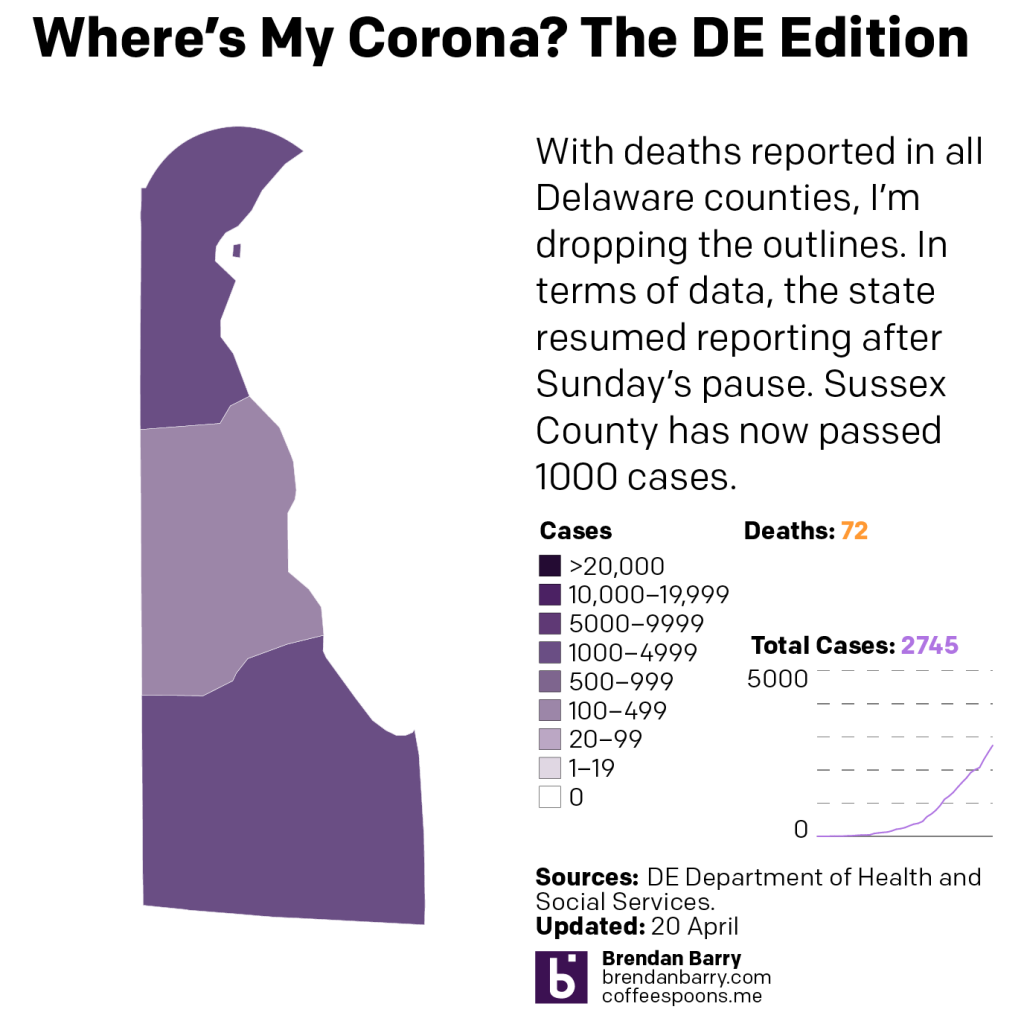
The situation in Delaware

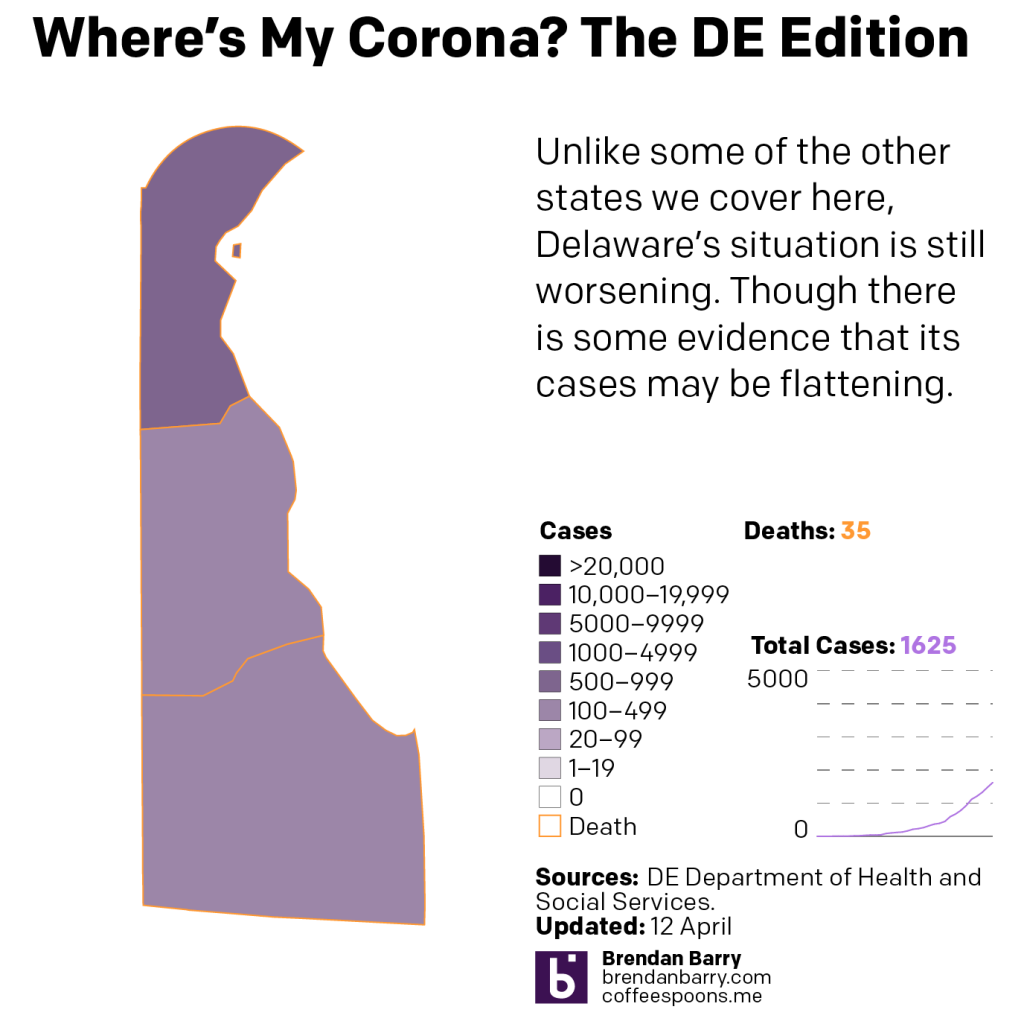
Delaware is back to reporting its figures. And in that release, we had Sussex County in the south climb above 1000 total cases. The levels or curves chart at the end will also show how the state might be flattening and stabilising its infection rate, but we will need several days of uninterrupted reporting to make that determination.
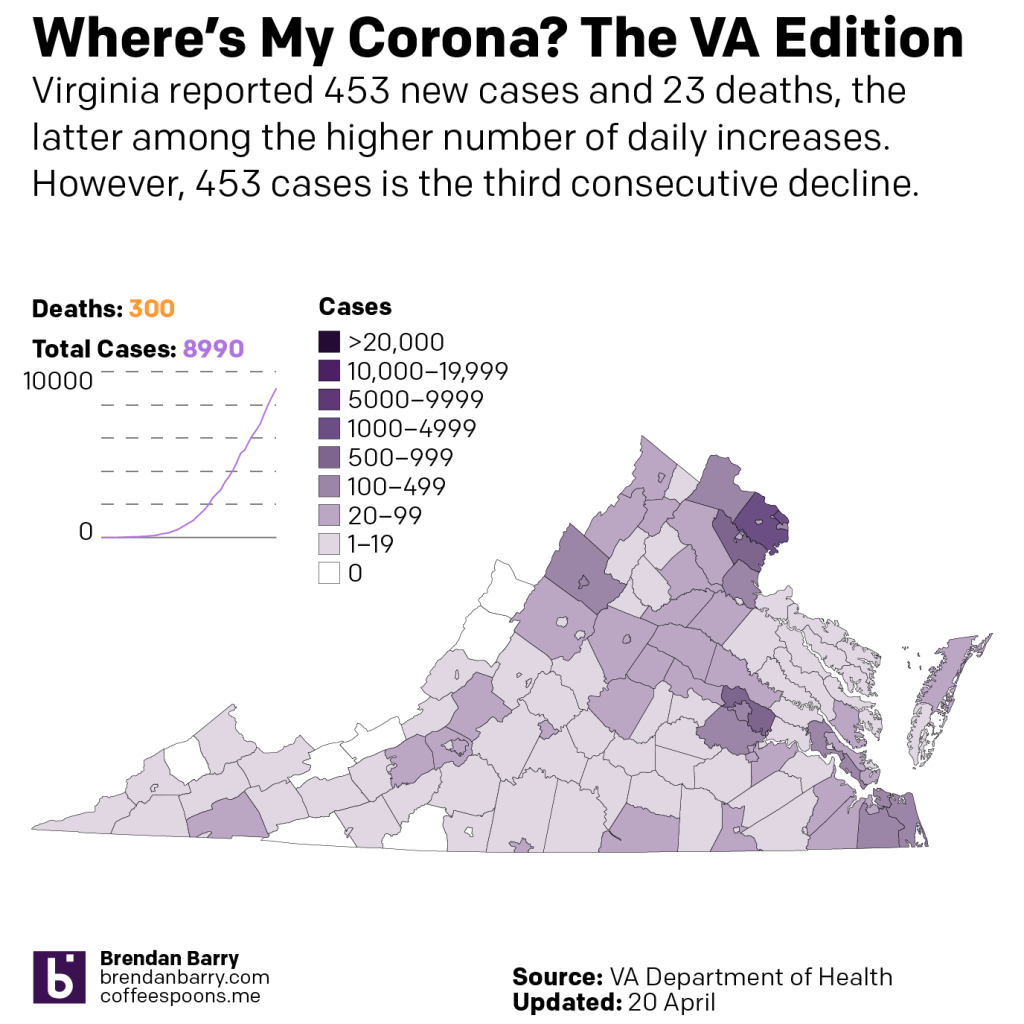
The situation in Virginia

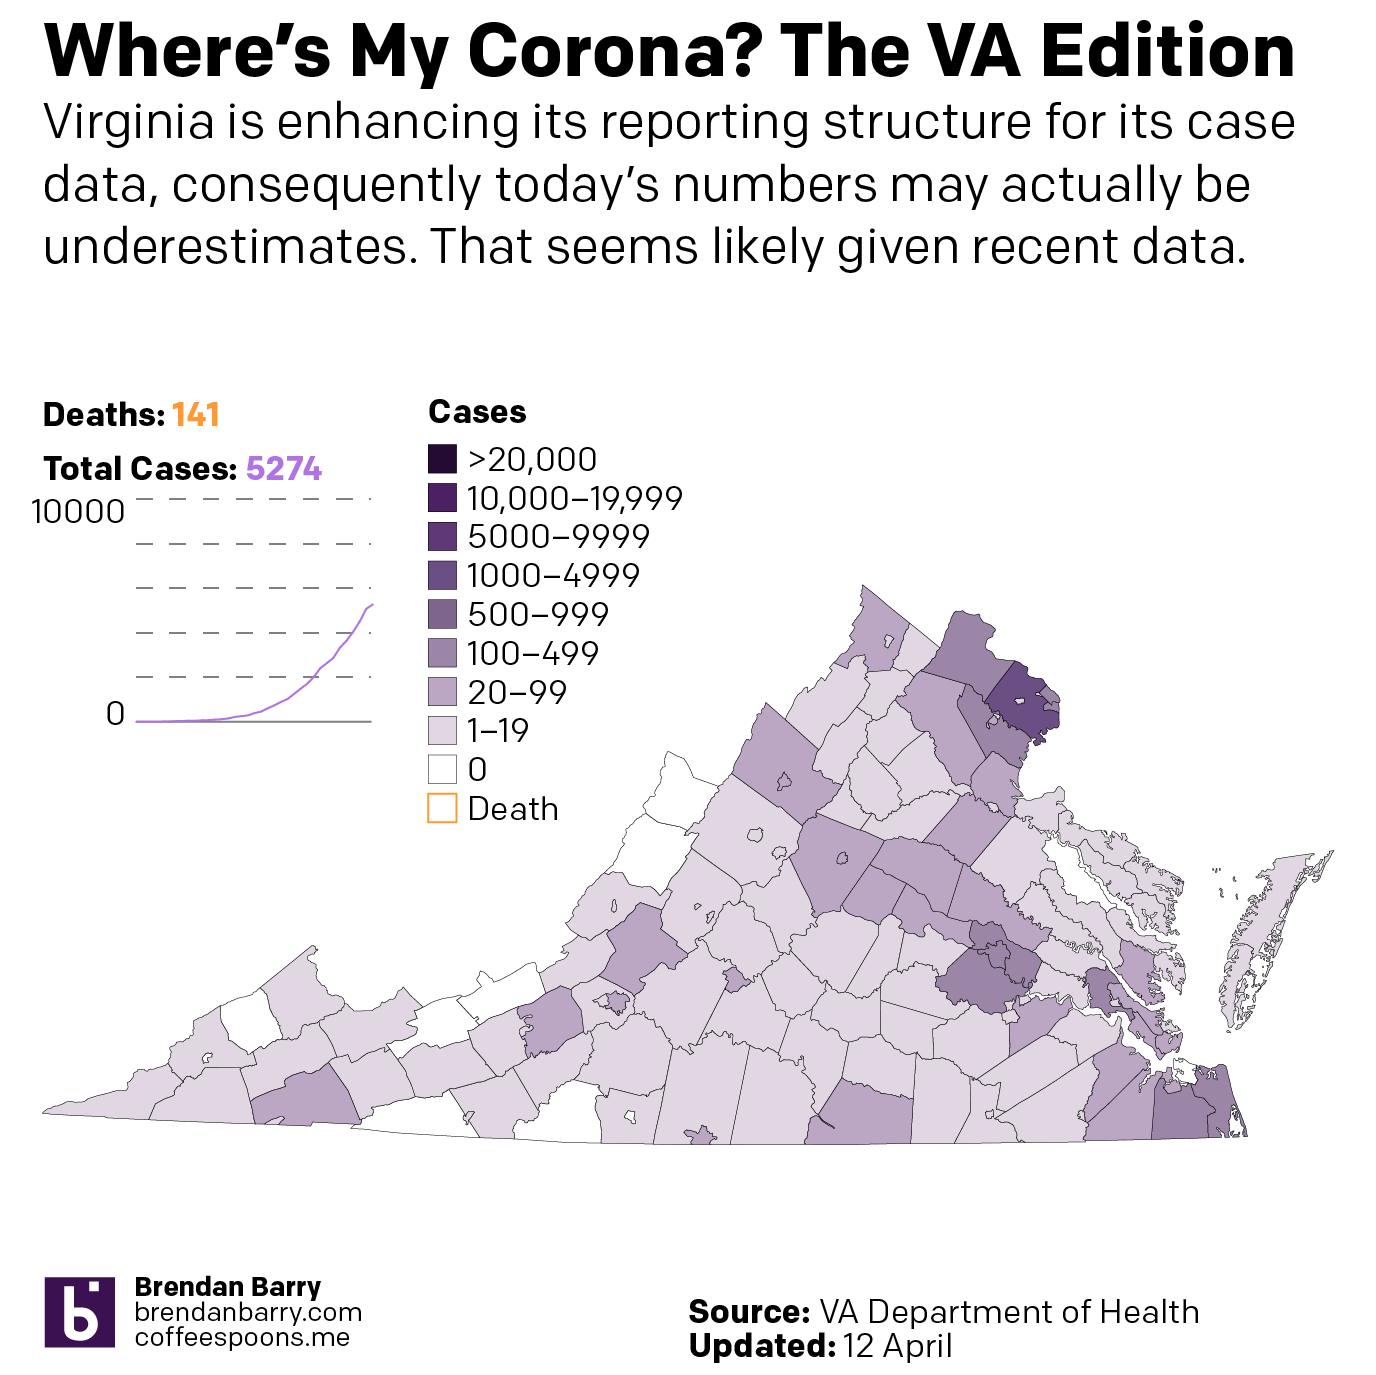
Virginia might be worrying. Or it might not be. Cases continue to increase in the big metropolitan counties like Fairfax and Henrico. But, there are still several counties out in the west that remain unaffected. And the curves chart at the end shows how there has not yet been any sort of even a near-exponential growth curve. Instead we just see a steady, slow increase in the number of cases. That in its own way makes it more difficult to see when the curve flattens, because it was already a relatively flat curve.
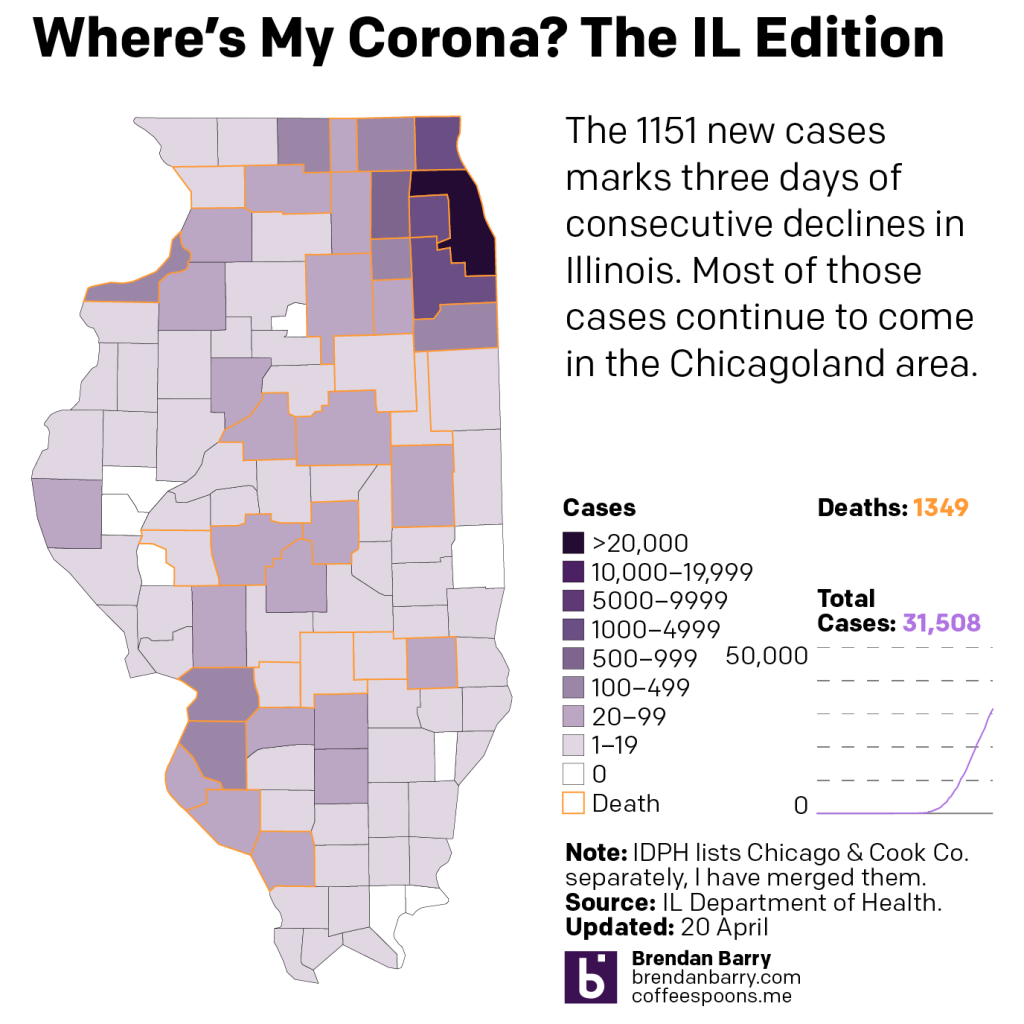
The situation in Illinois

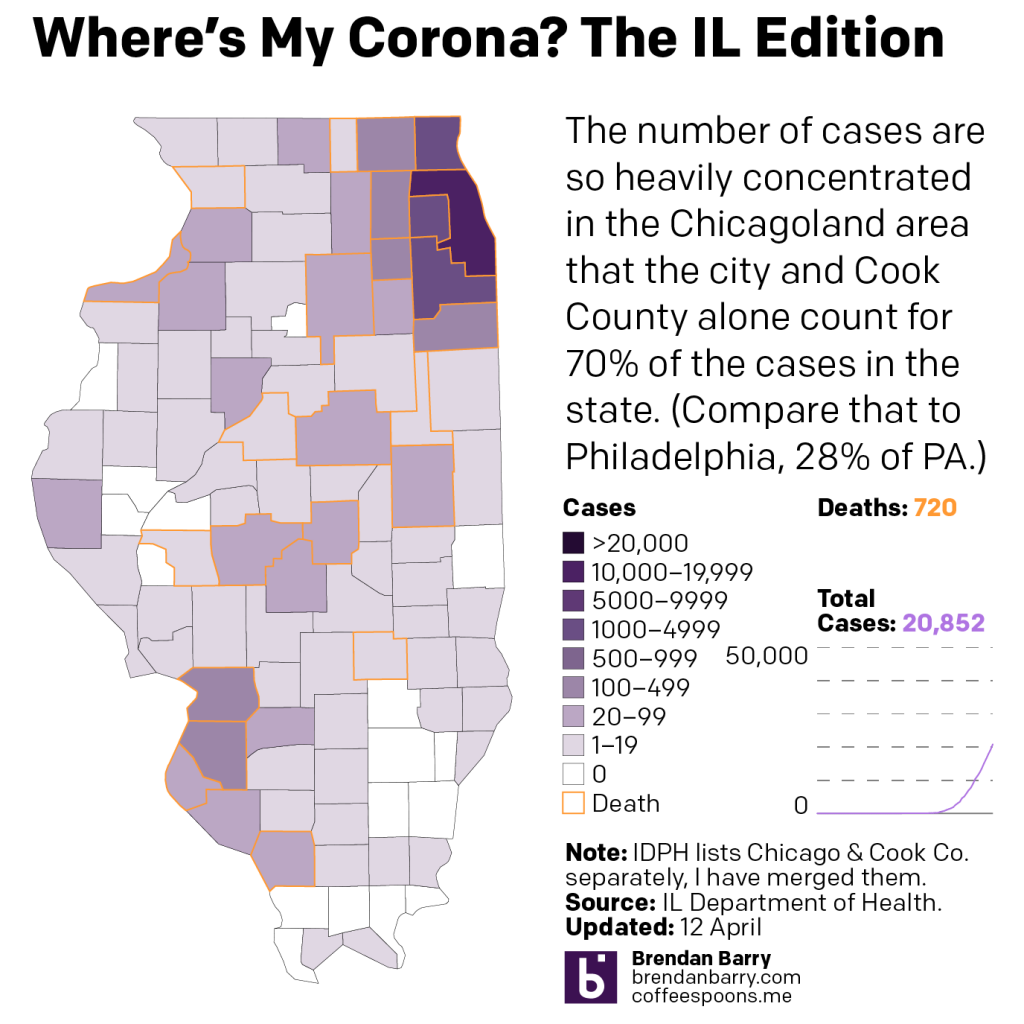
Illinois continues to be the tale of two states: Chicago vs. everywhere else. The combined Chicago and Cook County have over 20,000 total cases and the surrounding counties add a few thousand more, which gets you over 2/3 of the state’s 31,000 cases. That said, new cases and new fatalities are beginning to pop up in downstate counties.
Looking at the curves

Lastly a look at the curves. As I noted above when talking about Pennsylvania, you can clearly see the downward slope of the state’s new cases curve. Compare that to the plateau-like shape of New Jersey. Delaware and Illinois might be approaching a New Jersey-like curves. But I would want to see more data and in Delaware less volatility. But like I said, Virginia is a tricky one to read.

Credit for the pieces is mine.

Sunday’s Covid-19 Data

Here is a look at the data from Sunday’s releases on the COVID-19 outbreak in Pennsylvania, New Jersey, Virginia, and Illinois. I’ve omitted Delaware because they paused reporting on Sunday to move to a noontime release instead of their previous end-of-day.

I’m not exactly certain what that means for the data on Delaware and reporting time series. But, my guess is that will be more like a hole in the time series. I need to spend some time looking at that. But, anyways, on to the states for which we did have data on Sunday.

The situation in Pennsylvania

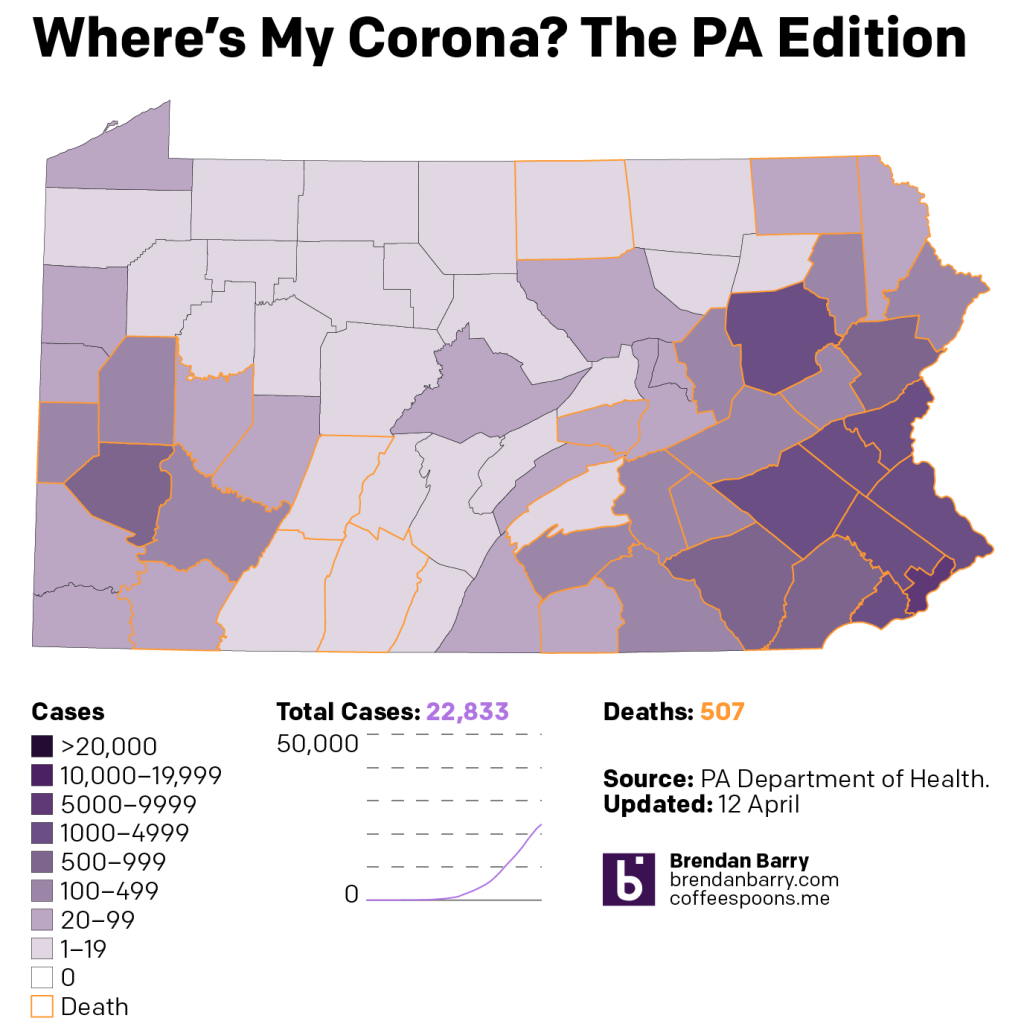
Pennsylvania continues to see growth in cases, but as we’ll get to with the levels, that appears to at least be stabilising. But in the spread of the outbreak, we are beginning to see the T of the state, that more rural and less densely populated area, beginning to fill in with cases. These are of course the areas of concern, the areas with shuttered rural hospitals, lack of comparatively developed infrastructure, where the impacts could be proportionately more severe than in the bigger cities. In terms of deaths, they have now spread almost across the state from east to west. I am still waiting until two adjacent counties connect before I make that final pronouncement.

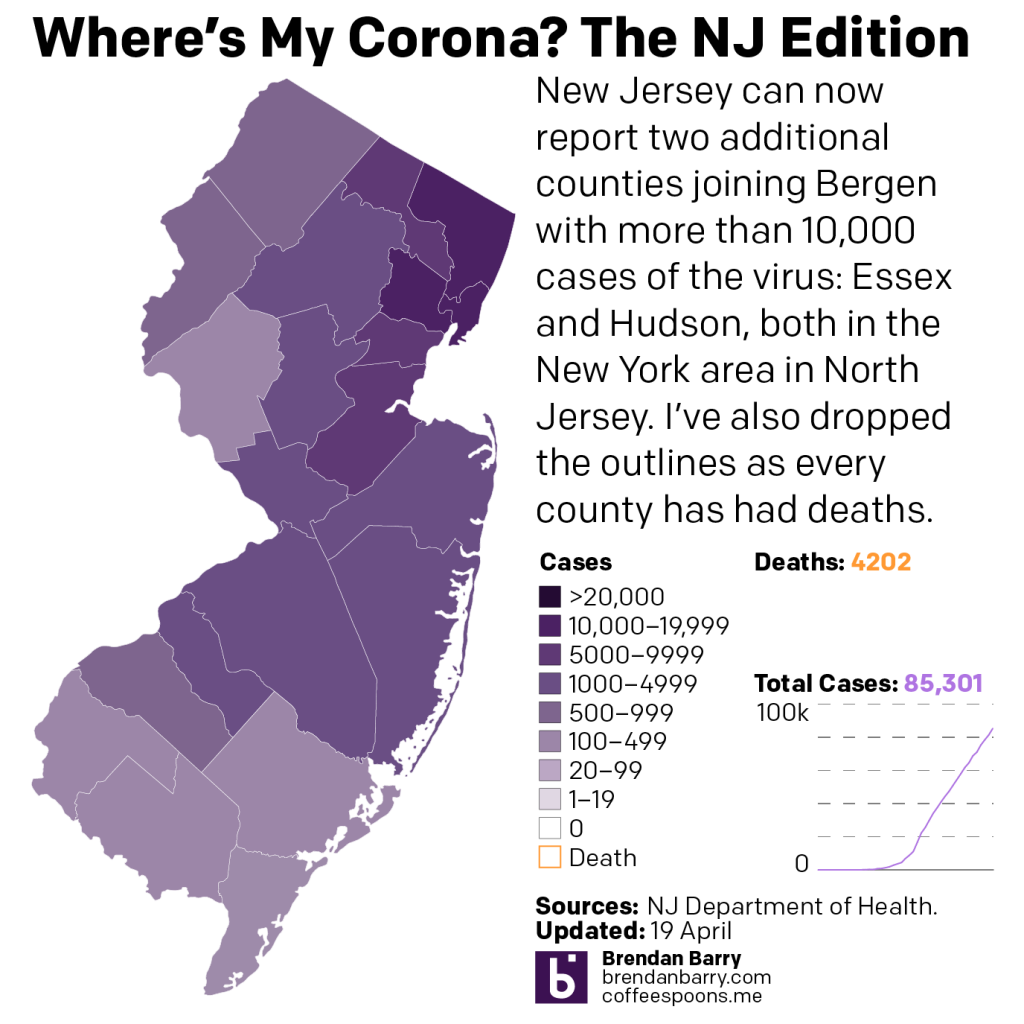
The situation in New Jersey

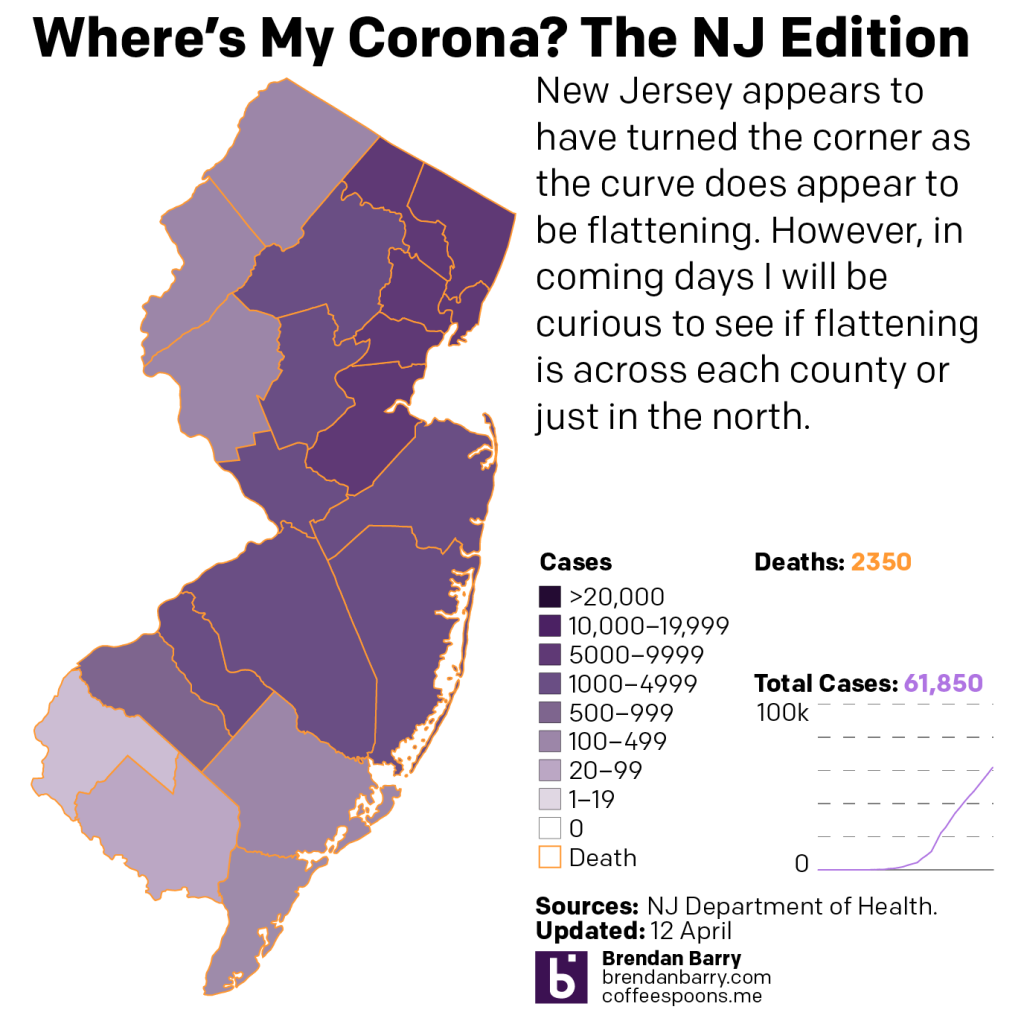
For New Jersey, I have removed the orange outlines around each county. The initial idea was to show where deaths had occurred. But now that they have been reported in every county, they don’t seem to be as helpful as the small number I provide in the graphic. Regardless, 4200 deaths is a lot. But the approximately 200 new deaths is the lowest number reported in several days.

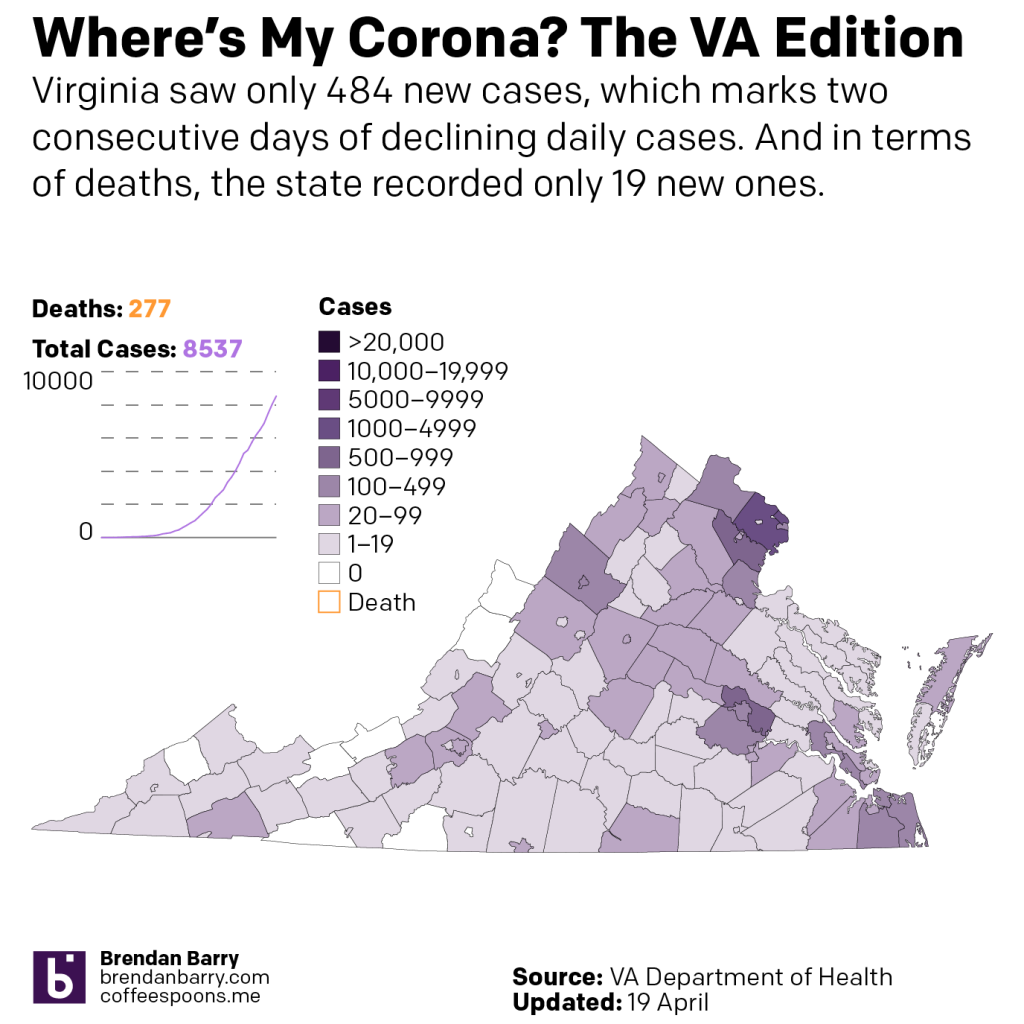
The situation in Virginia

Virginia is a weird state. When we see the levels chart below, you will see how its uptick has been far more gradual, and to this point it does not yet appear to have peaked or begun to stabilise. Most of the reported cases continue to be in and around the state’s big cities, notably the DC metro area, but also Richmond.

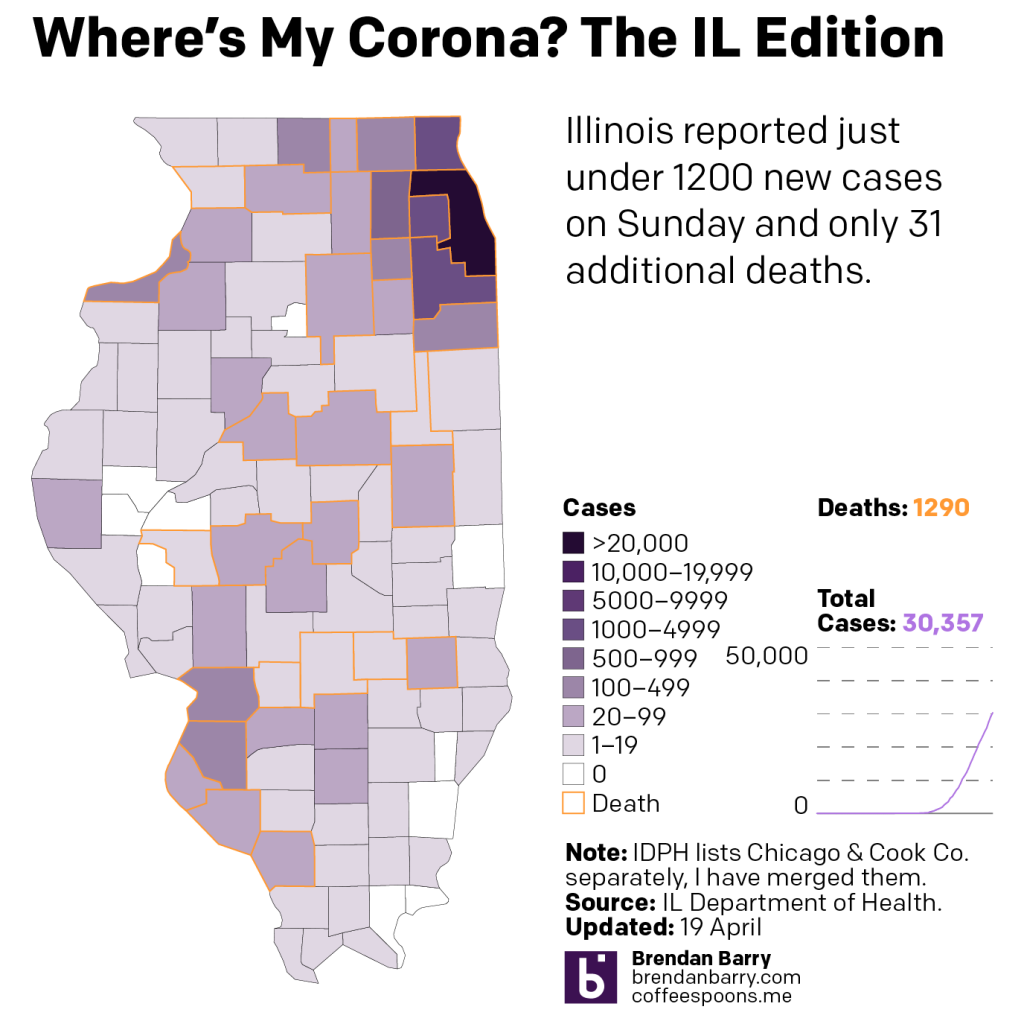
The situation in Illinois

Illinois has now seen cases from north at the Wisconsin border all the way south to Cairo. Most cases remain, however, concentrated in the Chicago metropolitan area, with lesser scale outbreaks occurring in the Quad Cities area and the suburban counties of Illinois this side of the Mississippi. Deaths continue to rise, and while most area again in the Chicago area, they are appearing increasingly at low levels in downstate counties.

But what about the curves?

But what about those curves? Excepting Delaware, which hasn’t reported new data, we can see that some states like Virginia continue to see increasing rates of infection. Others like New Jersey and Pennsylvania clearly have flattened and have entered a new phase. In New Jersey’s case it appears to be more of a stabilised plateau. In Pennsylvania, there was some evidence it was entering a declining rate phase, but that may now have begun to become more of a steady rate of infection like in New Jersey. Illinois is tough to read because of the variability of its data. It might be more of a pause in the rate of increase, or it may have begun to stabilise. We need more data.

Credit for the pieces is mine.
Sunday Covid-19 Data

Another day, more cases of coronavirus and Covid-19. So let’s take a look at Sunday’s data as there were some interesting things going on.

First, let’s dispense with Virginia. The state is enhancing its reporting structure, and so they admit the data is likely an underestimate of the present situation in Virginia. So here’s Virginia, nothing really changed.

The situation in Virginia

Moving on, we have Pennsylvania. Here we are beginning to truly see the disparity between the cities in the southeast and southwest, namely Philadelphia and Pittsburgh, and the T that describes what sometimes is used to describe Pennsyltucky. (Though it also includes cities like Harrisburg, the state capital.) The point is that the T of Pennsylvania has yet to suffer greatly from the outbreak. Of course, it’s also the part of the state least equipped to deal with a pandemic.

The situation in Pennsylvania

New Jersey is just bad. One can make the argument that South Jersey is hanging on. (Though I will touch on that later with an idea for today’s afterwork work.) Bergen County in the northeast is likely to surpass 10,000 cases on its own today. And that will put it above most states.

The situation in New Jersey

Delaware is tough because it sits as a small state next to several much larger ones. But, the numbers seem to indicate the outbreak is still worsening. Though in terms of geographic spread, there’s little to say other than that New Castle County, home to Wilmington, in the north is the heart of the state’s outbreak.

The situation in Delaware

Illinois is a fascinating state, because of how dissimilar it is compared to Pennsylvania, a state which has a similar number of people.

The situation in Illinois

The map shows that geographic spread still has a little way to go before reaching every county in the state. But the outbreak has been there longer than in Pennsylvania. And most of the darker purples are concentrated in the northeast, in Chicago and its collar counties. Compare that to Pennsylvania above where you will see dark purple scattered across the cities of its eastern third, e.g. Allentown and Scranton, and in the western parts near Pittsburgh. This too could be worth exploring in depth in the future.

Lastly I want to get to the cases curves charts. Here we look at the daily new cases in each state.

The curves, flattening or otherwise, of the five states.

And unfortunately Sunday’s numbers will impact the Virginia curve, but it overall looks as if the state is worsening. I would argue that Illinois, which appears to be bending towards a steadying condition is likely in a weird weekly pattern where it appears to stabilise on weekends and then resumes reported infections come Monday. Pennsylvania might well be flattening its curve. I would want to see a few more days’ worth of data before stating that more definitively. Let’s give it to Wednesday or Thursday.

And then in New Jersey we have a fascinating trend. The curve of increasing number of cases has clearly broken. But it also is not shrinking. Instead, it seems to be more of a plateau. And in that case, the outbreak in New Jersey is not getting worse, but it’s also not getting any better. At least not numerically. However, the goal of flattening the curve is to create a slower, more steady increase in case numbers to help hospitals cope with surge volumes. So good news?

Credit for the pieces is mine.
Philly Rules

Yo. C’mon, bro. This jawn is getting tired. Just stop already.

If you did not catch it this week, the most important news was Donald Trump disinviting the Super Bowl champions Eagles to the White House to celebrate their victory over the Patriots. He then lied about Eagles players kneeling during the US anthem—no player did during the 2017 season. He then claimed that the Eagles abandoned their fans. Yeah, good luck convincing the city of that.

So naturally we have a Friday graphic for youse.

That's 25,304.
That’s 25,304.

Full disclosure: I root for the Patriots. But I mean, seriously, can’t youse guys do the math?

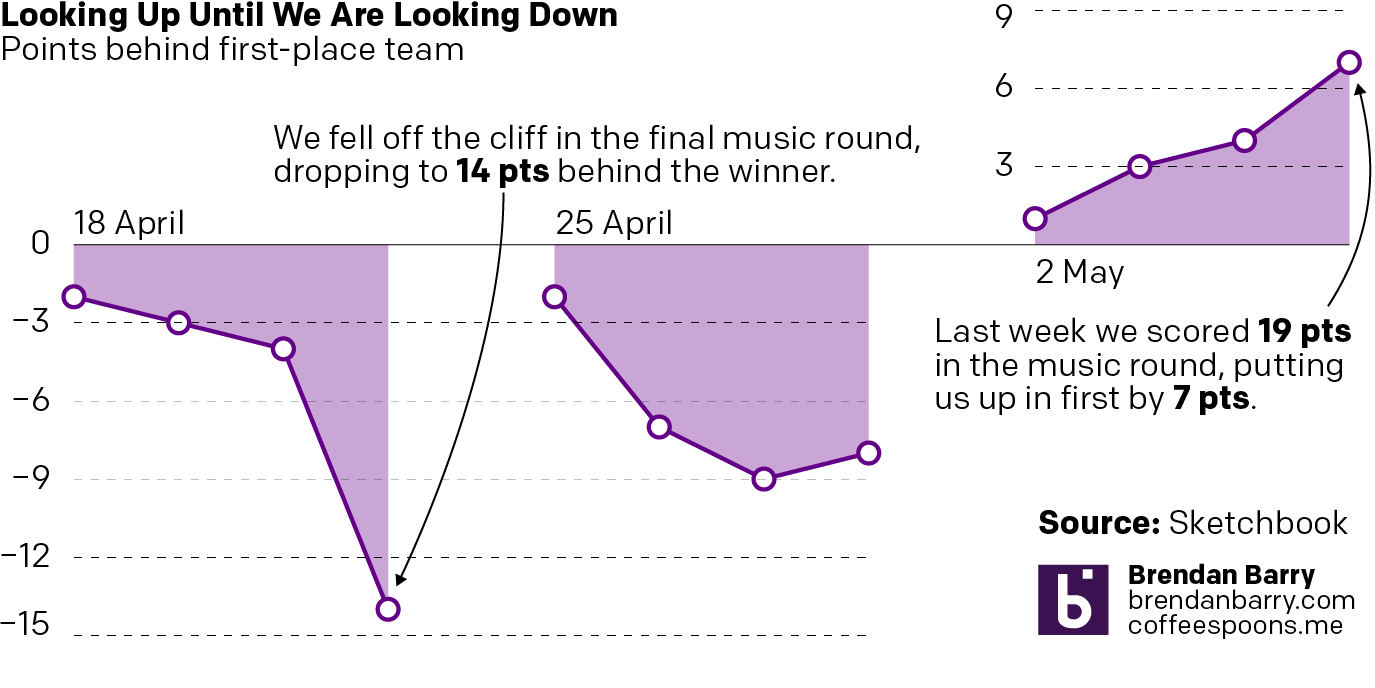
The Short Arc of Pub Trivia Scores Bends Towards Victory

Well, at least over the last three weeks it did. In previous examples of my pub trivia team’s performance, we have had a lacklustre performance. But a few weeks we had an epic collapse. Having been in 4th place out of 10 in the penultimate round we ultimately finished in 8th out of 9—somebody left early—and 14 points out of first place. It probably didn’t help we put Beyonce down as the artist for three different songs. It probably really didn’t help that none of those artists were Beyonce. And it probably definitely didn’t help that we had no idea who those three artists were.

Then after a middling performance two weeks ago, last week we shocked even ourselves with our first victory since last autumn. Just how shocking? 19 points in that oft ill-fated music round. (It’s not really, but I’ll have to make another graphic about that.)

We were perhaps the most shocked of all that week.

Credit for the piece is mine. Credit for the score goes to my teammates.

US Steel Imports

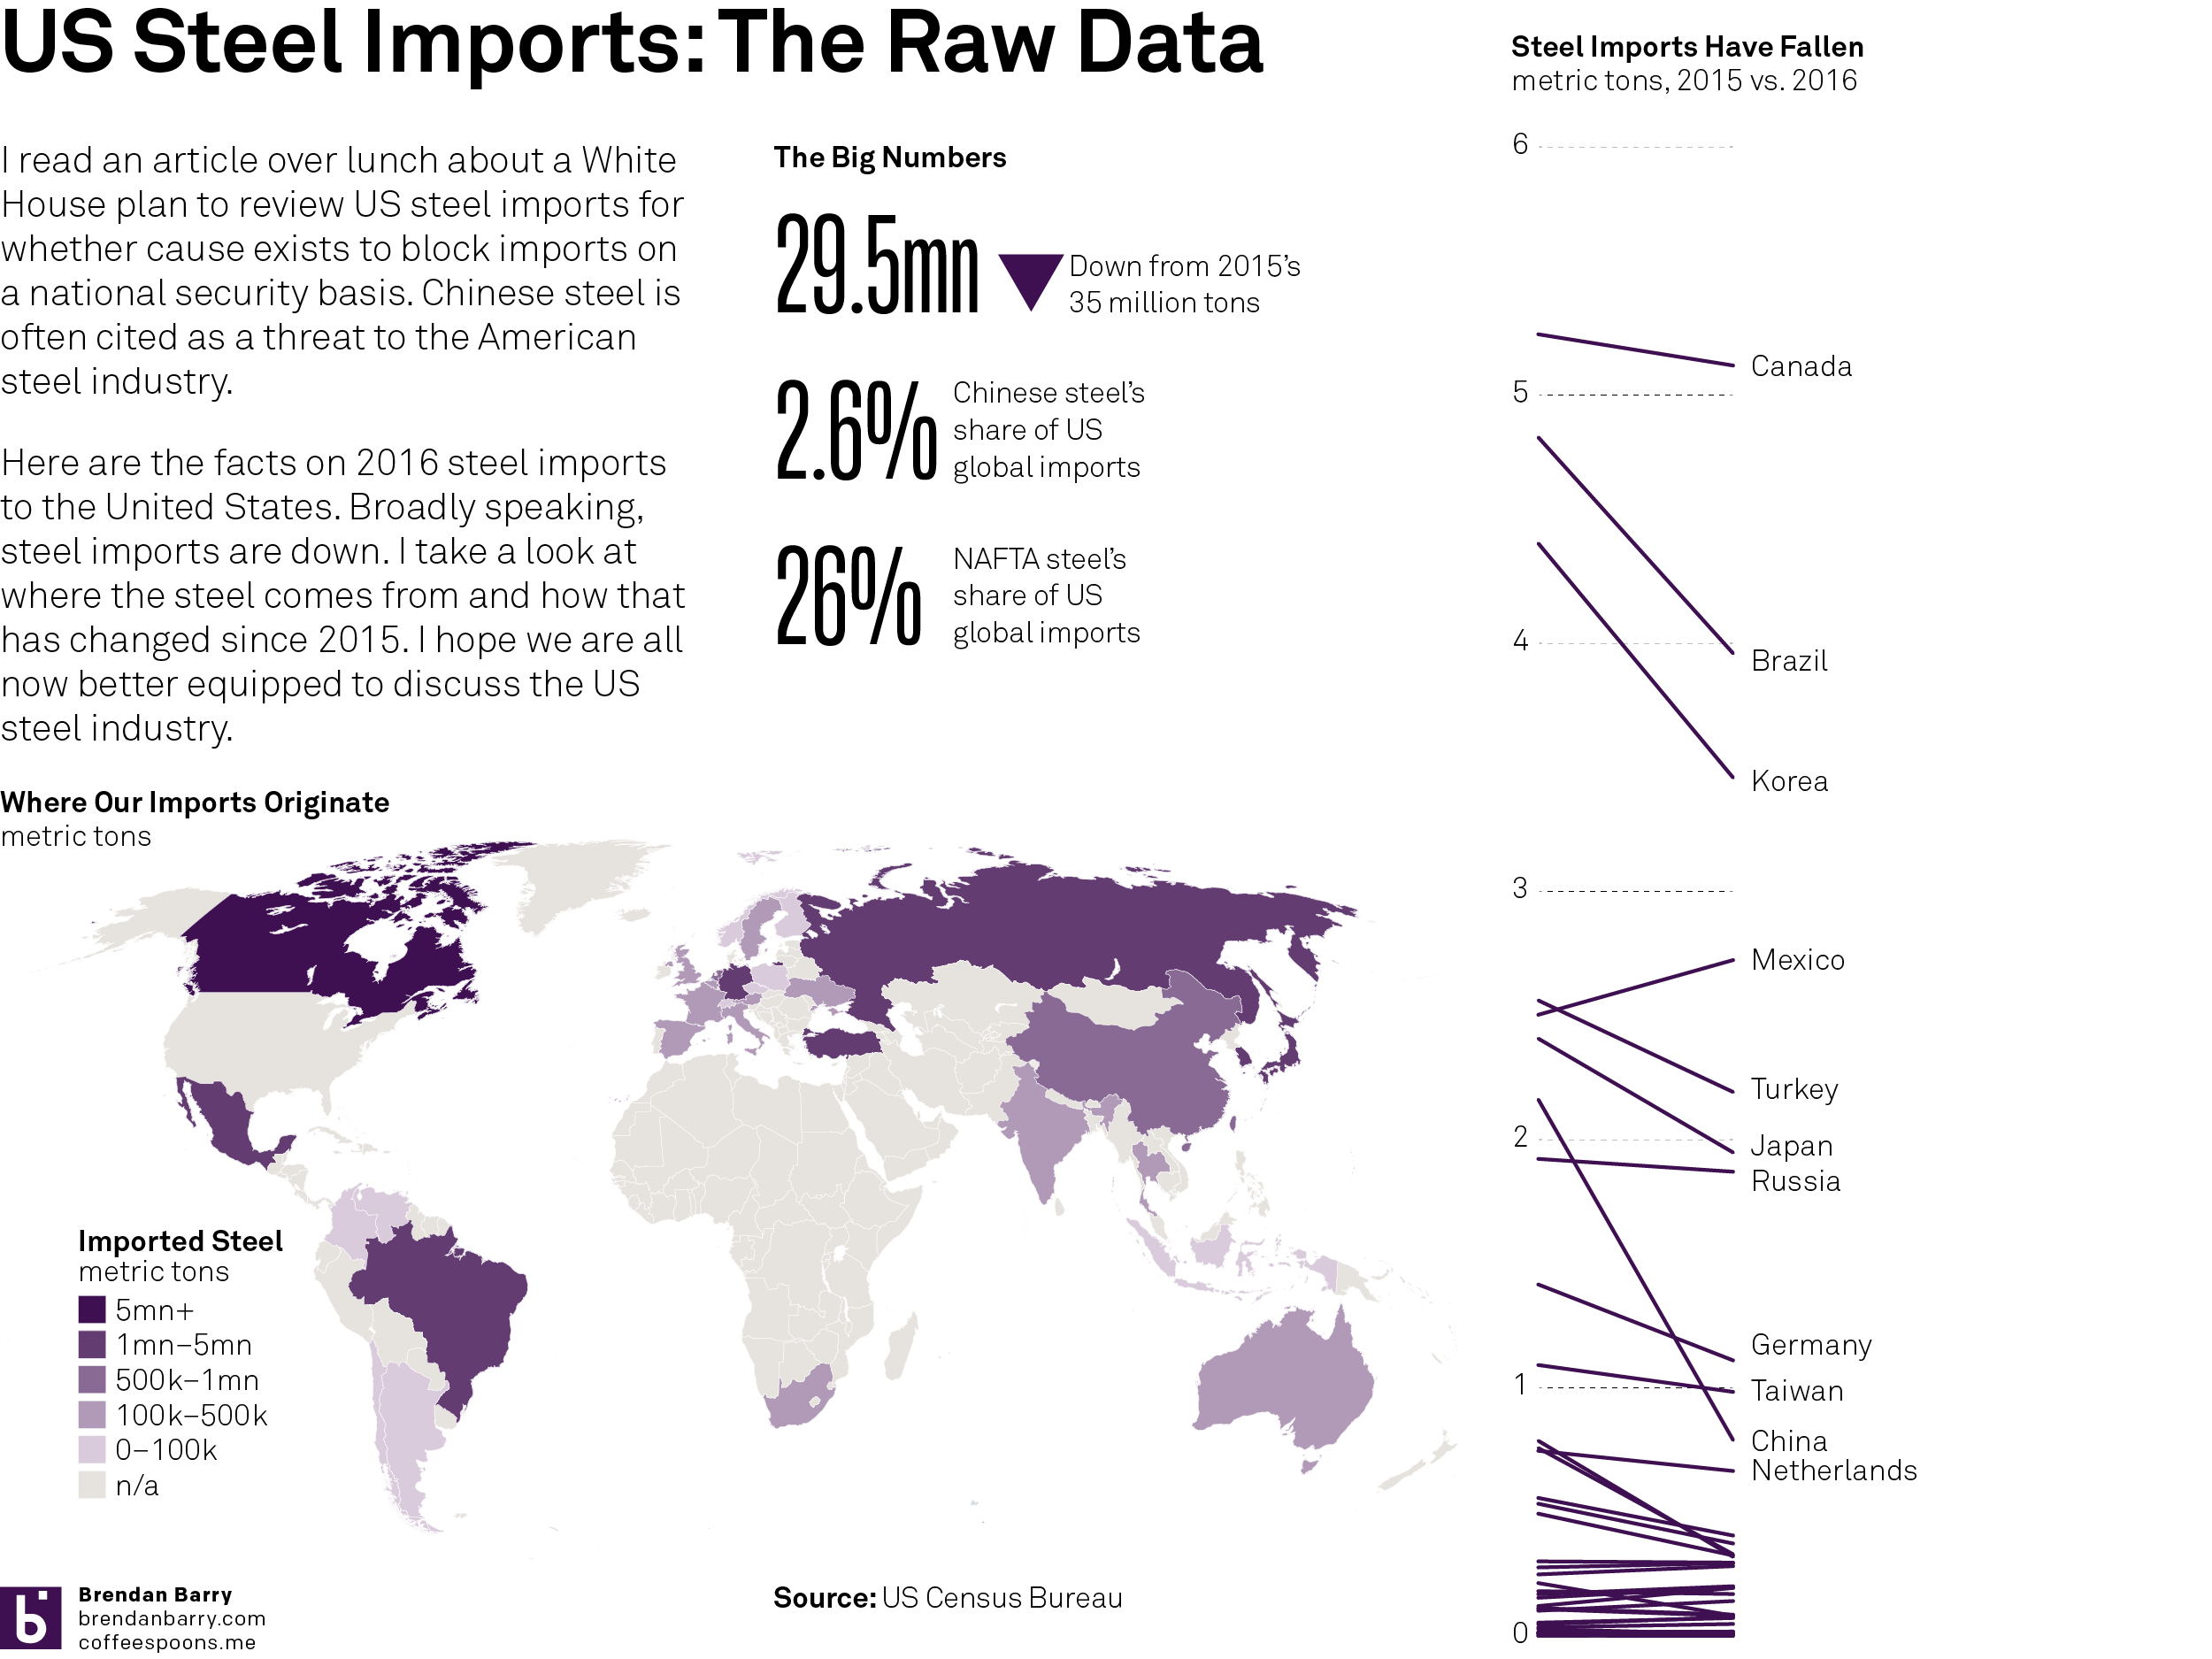
On Thursday President Trump announced that the Commerce Department would investigate imports of steel to the United States. This falls under the Buy American campaign pledge. A lot of talk in the media is, of course, about the threat of Chinese steel to the United States. So I dug into the Census Bureau’s website and found their data on steel imports.

Well, it turns out that steel imports were already down by over 5 million tons before Trump took office. And from 2015 to 2016, China fell sharply from 7th to 10th in a ranking of our import partners. In fact the only country from whom we import significant amounts of steel to see a rise over that period was Mexico.

But we’ll probably need their steel to build the wall to keep out their steel.

I visualised the data in this datagraphic. Enjoy. And look for a later post today in the usual, light-hearted vein.

The state of US steel imports

Credit for the data goes to the US Census Burea. The graphic is mine.