The Stunted Growth of North Korea

This piece from the BBC is a few years old, but it provides some interesting nuggets about North Korea. Unsurprisingly it appeared on my radar because of the coverage of the Trump–Kim summit in Vietnam. The article says it is nine charts that tell you all you need to know about North Korea. Now, I do not think that is quite true, but it does contain the following graphic—I hesitate to call it a chart—that illustrates one of my favourite details.
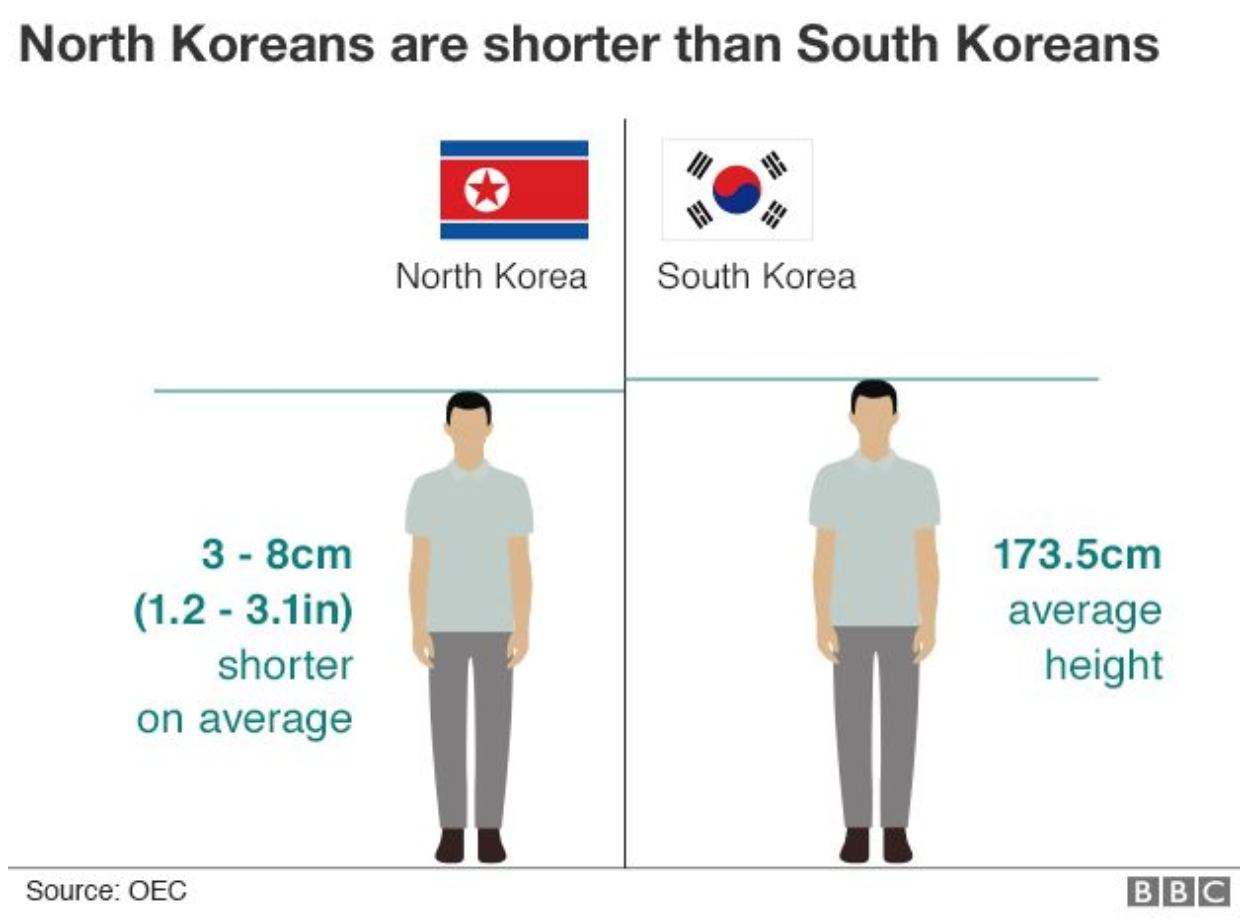
It's just a matter of inches
It’s just a matter of inches

The two figures illustrate the average height of a person from North Korea and then South Korea. What do you see? That the North Korean is shorter. This is despite the fact that the populations were the same just a few decades ago. The impact of years of malnutrition, undernourishment, and general lack of well-being have manifested themselves in the physical reduction of size of human beings compared to their nearly identical population to the south.

Thankfully the rest of the piece contains data on things like GDP, birth rates, and life expectancy. So there are some things in there that one should know about North Korea. As much as I find the story of height interesting, I struggle to think it is one of the nine things you should really know about the state.

Credit for the piece goes to Mark Bryson, Gerry Fletcher, and Prina Shah.

Are Baseball’s Big Contracts Worth It?

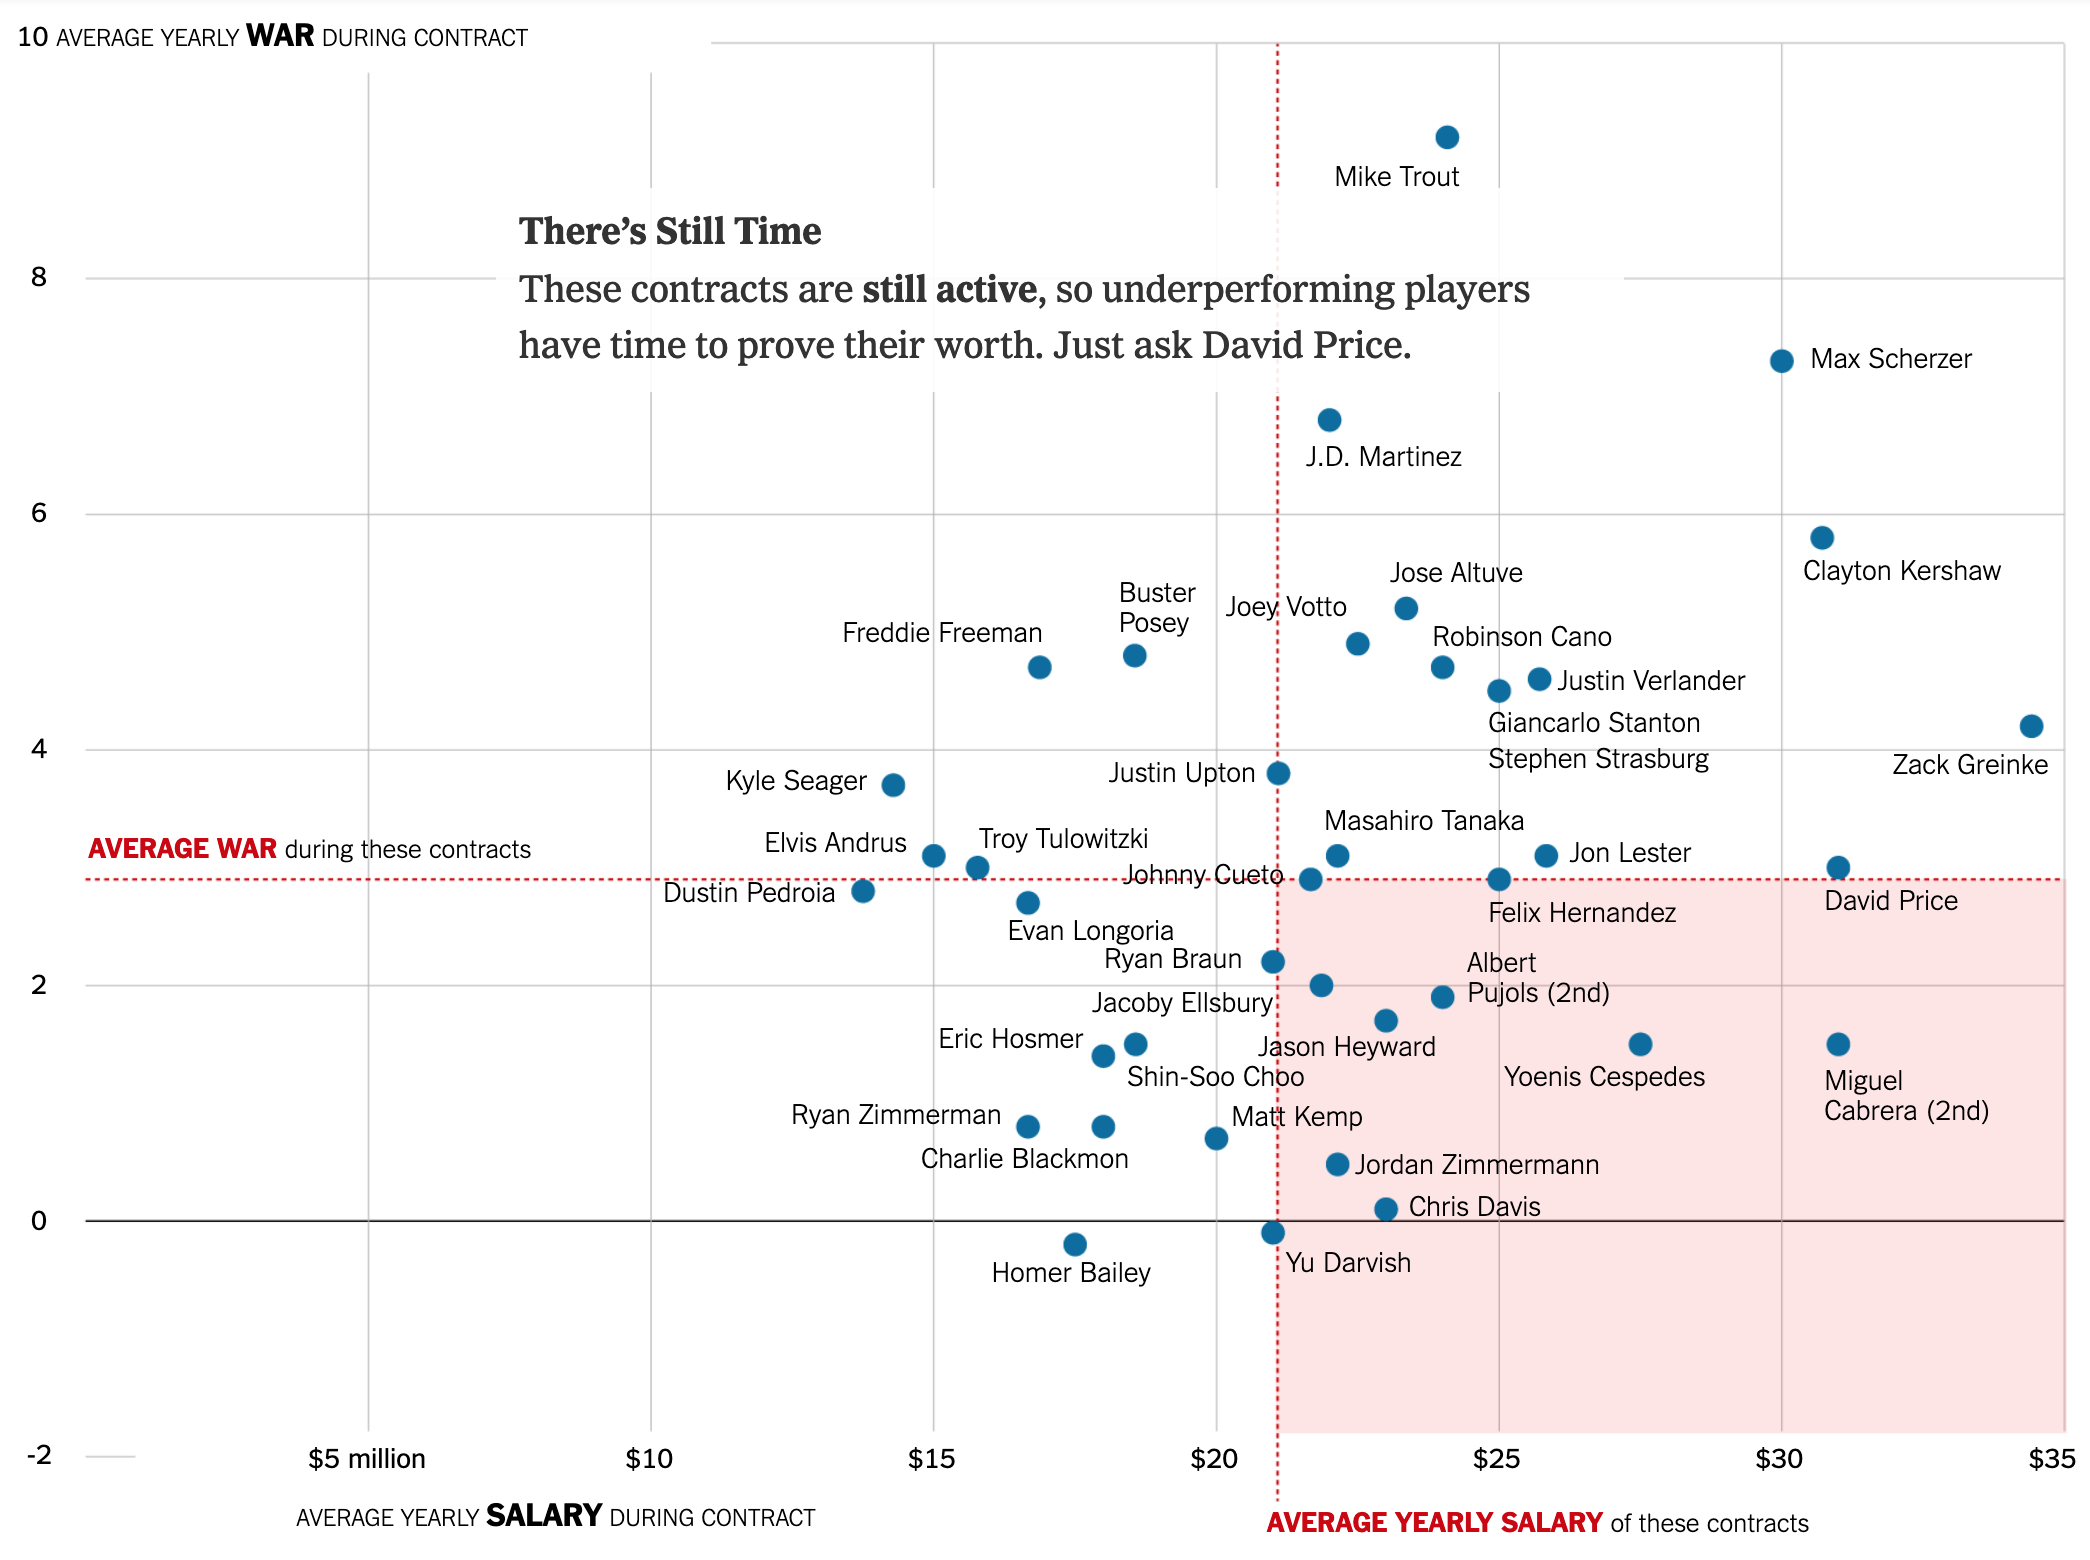
On Tuesday the San Diego Padres signed Manny Machado to a guaranteed contract worth $300 million over the next ten years—though he can opt out after five years. Machado was one of two big free agents on the market, the other being Bryce Harper. One question out there is whether or not these big contracts will be worth it for the signing teams. This piece yesterday from the New York Times tries to look at those contracts and how the players performed during them.

Oh, David Price…
Oh, David Price…

Like the piece we looked at Tuesday, this takes a narrative approach instead of a data exploratory approach—the screenshot above is halfway through the read. Unlike the Post piece, this one does not allow users to explore the data. Unlabelled dots do not reveal the player and there is no way to know who they are.

Overall it is a very strong piece that shows how large and long contracts are risky for baseball teams. The next big question is where, for how long, and how much will Bryce Harper sign?

Credit for the piece goes to Joe Ward and Jeremy Bowers.

Trump Keeps Attacking the Special Counsel

Yesterday the New York Times published a fascinating piece looking at the data on how often President Trump has gone after the Special Counsel’s investigation. (Spoiler: over 1100 times.) It makes use of a number of curvy line charts showing the peaks of mentions of topics and people, e.g. Jeff Sessions. But my favourite element was this timeline.

All the dots. So many dots.

It’s nothing crazy or fancy, but simple small multiples of a calendar format. The date and the month are not particular important, but rather the frequency of the appearances of the red dots. And often they appear, especially last summer.

Credit for the piece goes to Larry Buchanan and Karen Yourish.

Be Like Mike?

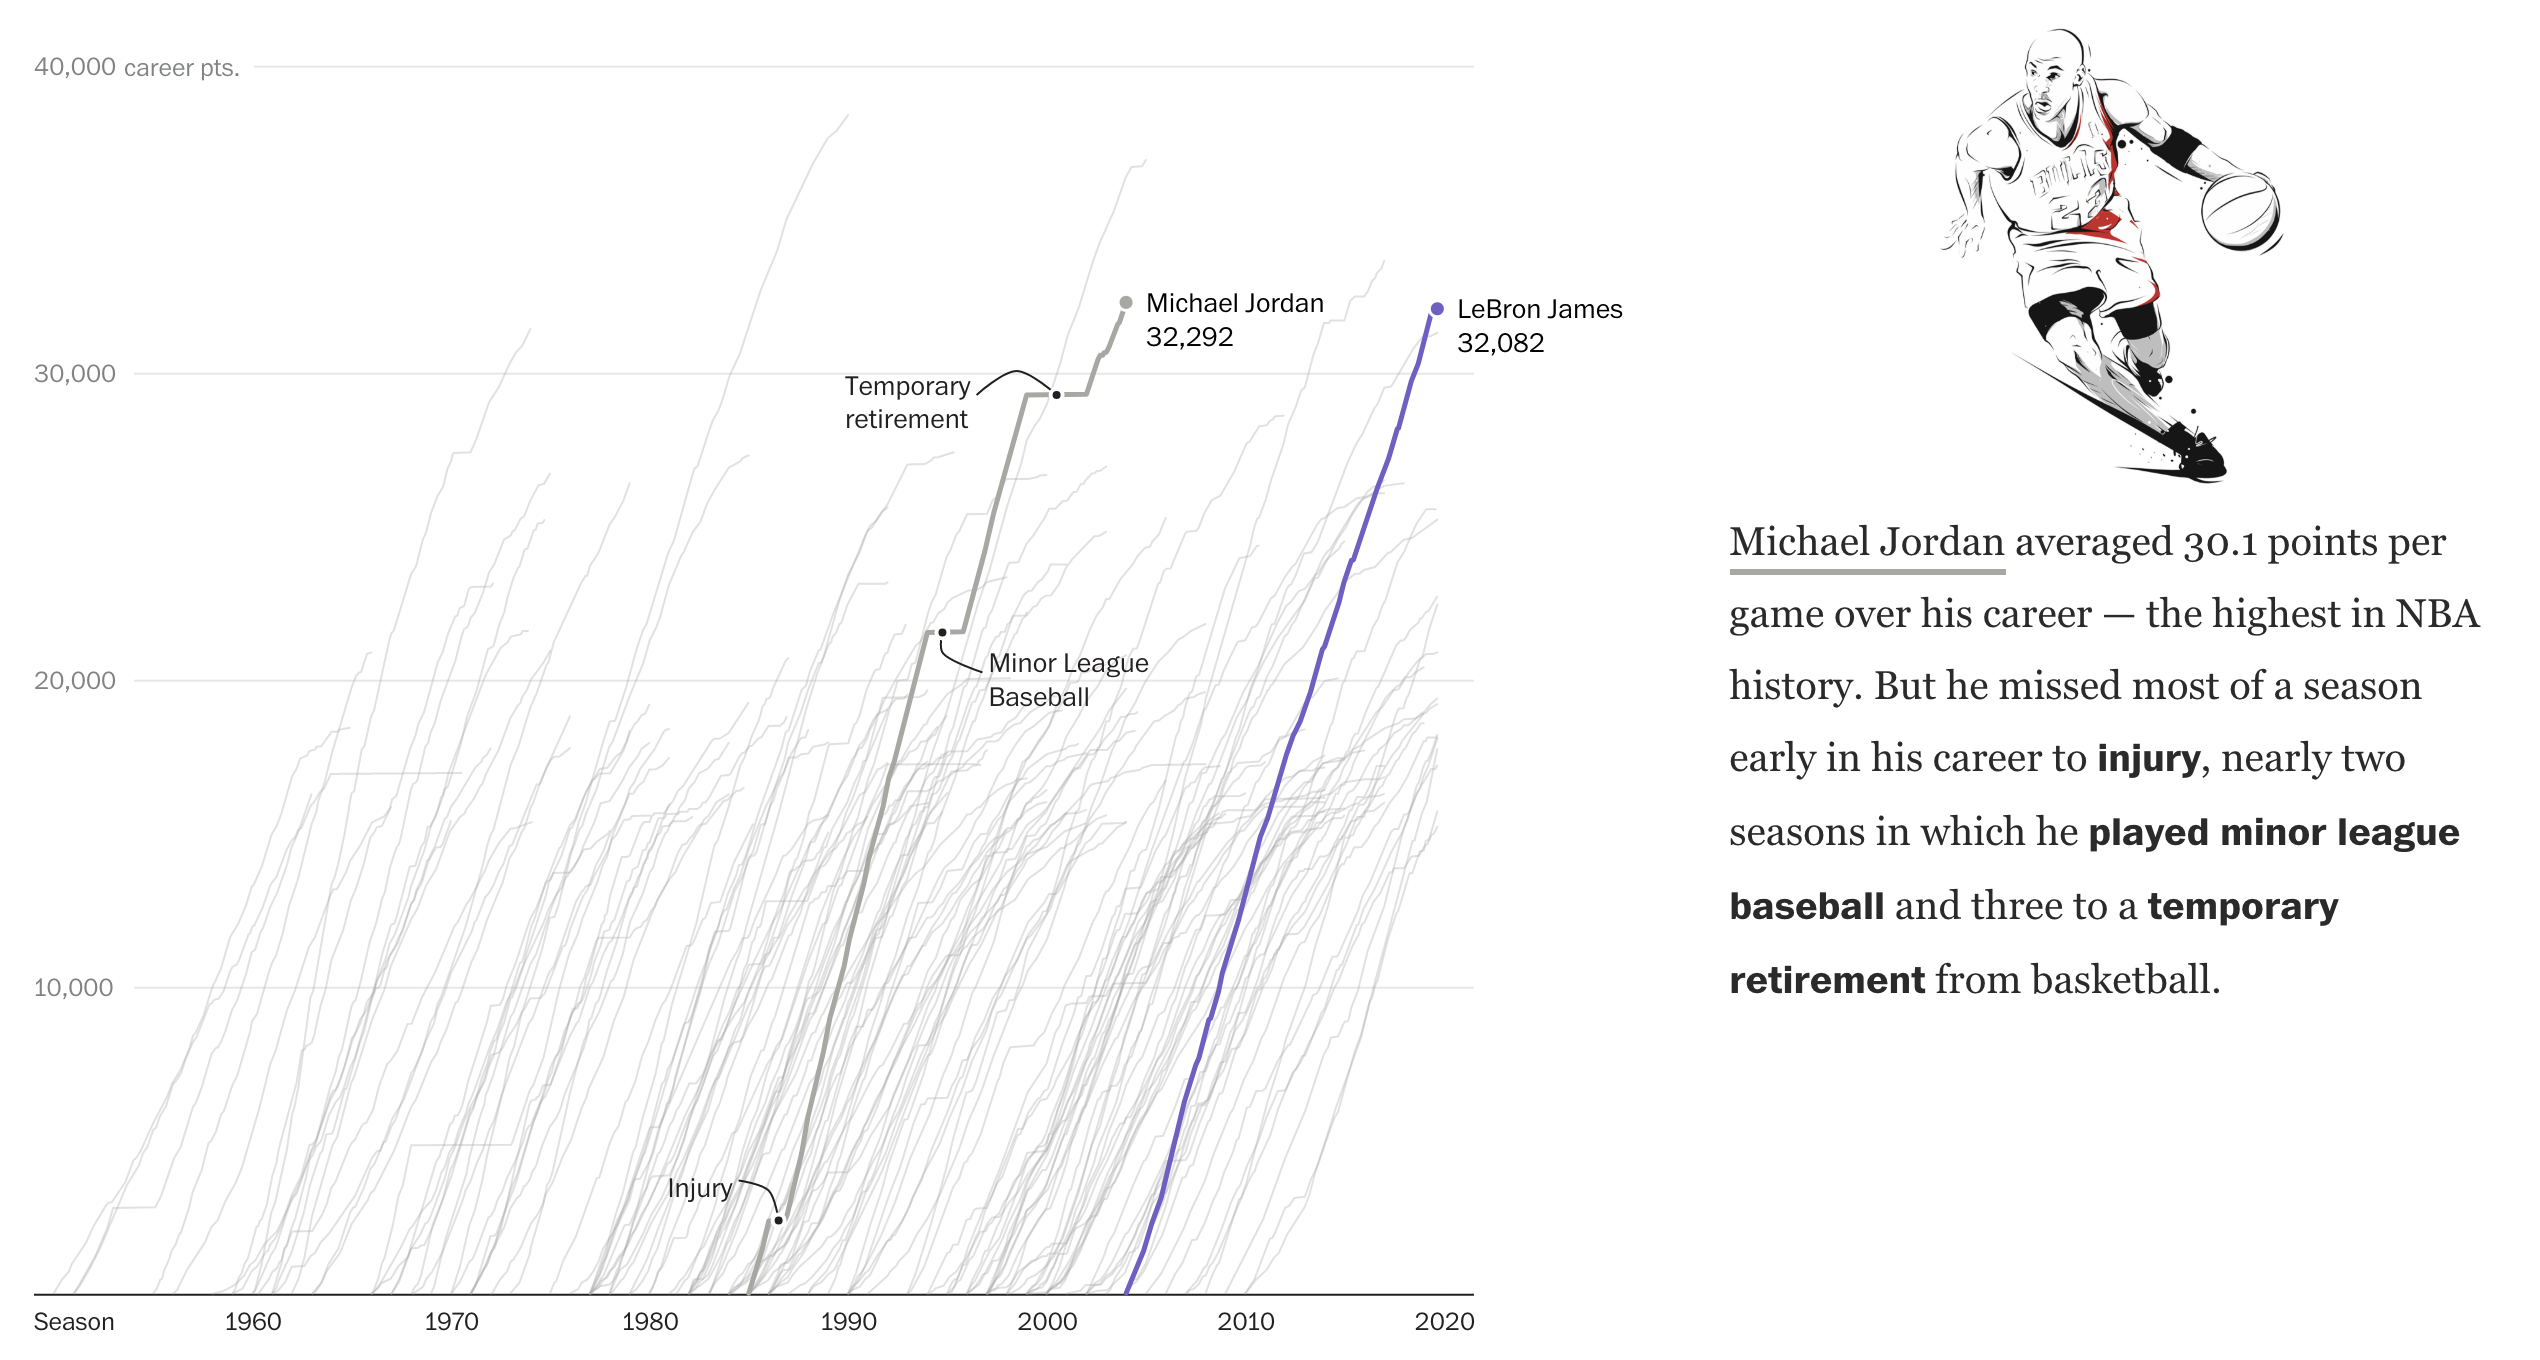
Back in 2012 the New York Times ran what is a classic data visualisation piece on Mariano Rivera. It tracked the number of saves the legendary Yankees closer had over his career and showed just how ridiculous that number was—and how quickly he had attained it. Last week, the Washington Post ran a piece that did something very similar about LeBron James, a future basketball legend, and Michael Jordan, definitely a basketball legend.

They might have game.

The key part of the piece is the line chart tracking points scored, screenshot above. It takes the same approach as the Rivera piece, but instead tracks scored points. Unlike the Rivera piece, which was more “dashboard” like in its appearance and function, allowing users to explore a dataset, this is more narratively constructed. The user scrolls through and reads the story the authors want you to read. Thankfully, for those who might be more interested in exploring the dataset, the interactivity remains intact as the user scrolls down the article.

While the main thrust of the piece is the line chart, it does offer a few other bar and line charts to put James’ career into perspective relative to the changing nature of NBA games. The line chart breaking down the composition of James’ scoring on a yearly basis is particularly fascinating.

But, don’t ask me about how he fits into the history of basketball or how he truly compares to Michael Jordan. Basketball isn’t my sport. But this is a great piece overall.

Credit for the piece goes to Armand Emamdjomeh and Ben Golliver.

A Macedonia by any Other Name

As someone who loves geography and maps, I have plenty of printed atlases and map books. One year, as a gift, my family gave me an early 20th century atlas. That one in particular is remarkable because of how much the world changed between 1921 and 2019—what was French West Africa is now several independent countries.

But our maps may be changing again as Greece has now formally recognised the Former Yugoslav Republic of Macedonia as North Macedonia, what most of the world simply calls Macedonia. But Greeks do not want you to confuse that Macedonia with the Macedonia (or Macedon) of Ancient Greece and Alexander the Great. The squabble over the name has prevented what will be North Macedonia from joining the European Union and NATO because of Greek objections.

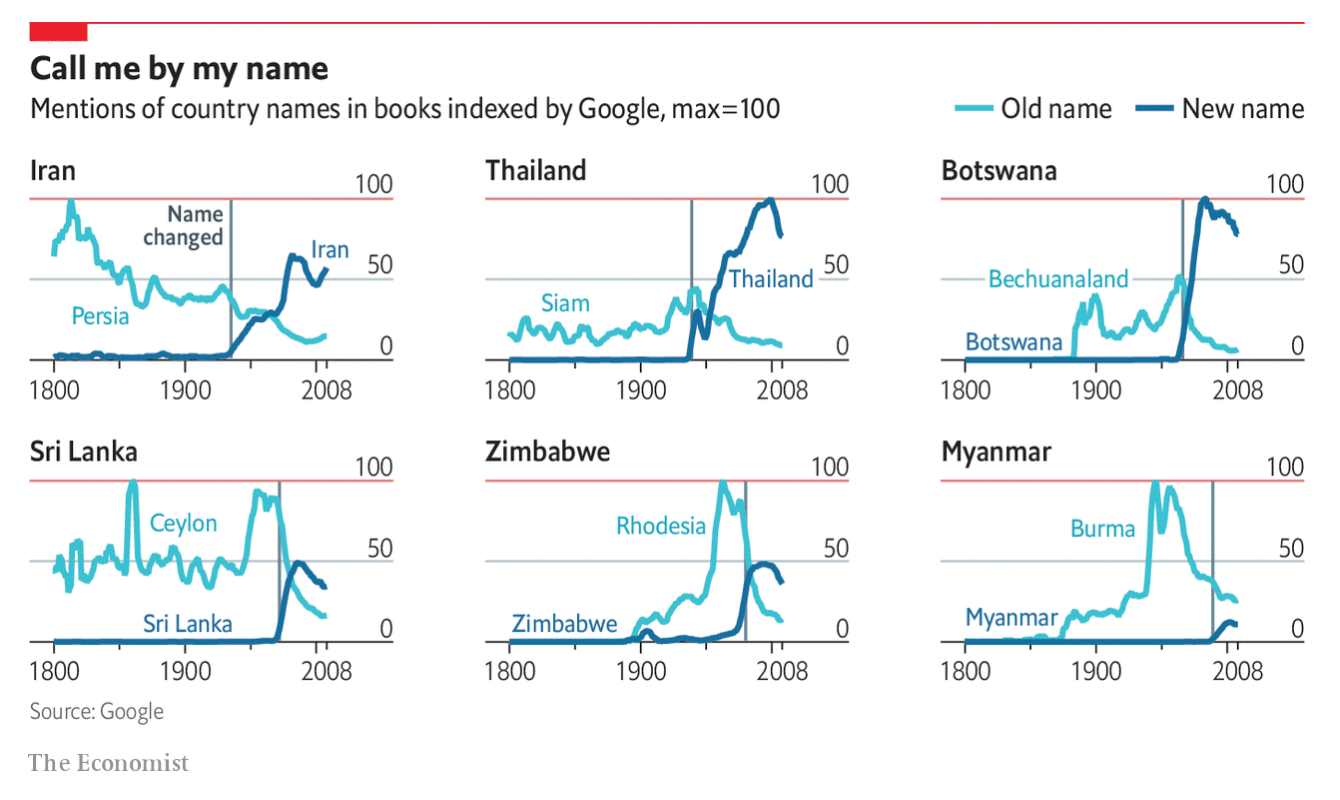
As the Economist recently showed, however, it might take a little while before the name Macedonia catches on with the public at large. (Note, I intended to type North Macedonia but instead went with Macedonia. I opted to leave it incorrect just to show how difficult it will be.)

What's in a name?
What’s in a name?

The plot uses my favourite small multiples to look at six countries whose names have changed. Some of you may be unfamiliar with the originals. Bechuanaland may be the most obscure, but Burma and Ceylon may be far more familiar. Of course the historian in me then wonders why the mentions of countries spiked in books. But small multiples are usually not the place to do detailed annotations to humour an audience of one.

In terms of its design, we have an effective use of colour and line. I may have dropped the thin red line for the max 100 value as it makes the piece a bit busy overall, but that might just be house style.

Of course for this graphic in particular, we will have to wait several years before we can add Macedonia/North Macedonia to the plot.

Credit for the piece goes to the Economist Data Team.

A Not so Dry January

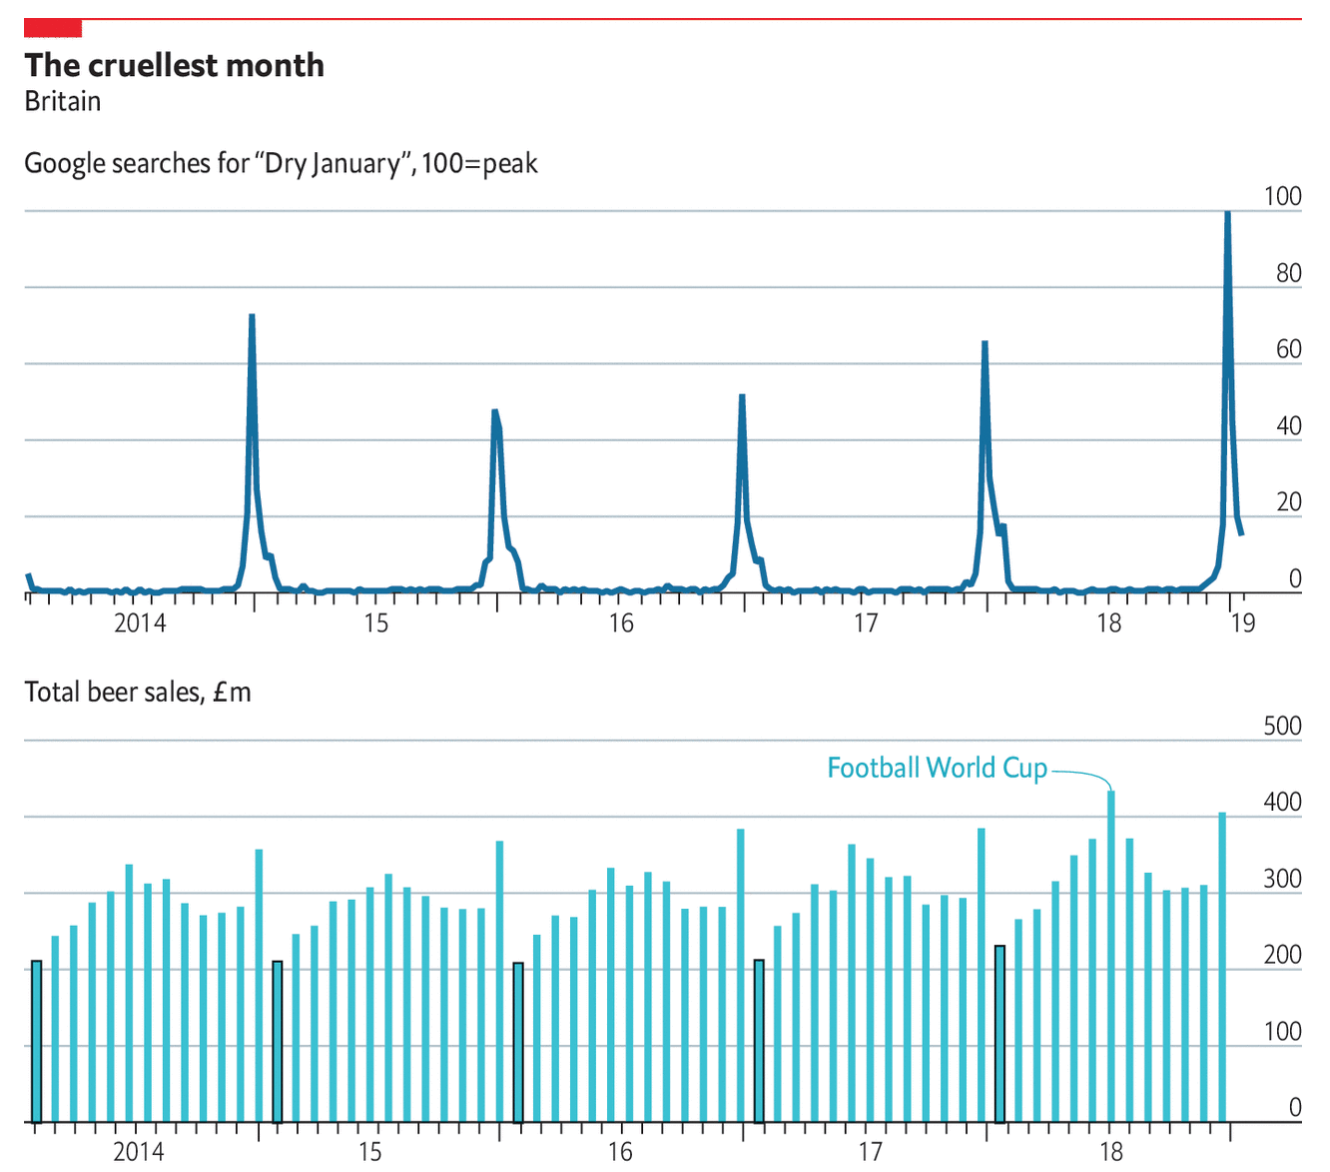
January has ended, and with it for, apparently, a very few Britons, Dry January. The Economist looked at alcohol consumption, using a proxy of beer sales, and compared that against the number of times people searched for “Dry January” on Google.

Not so dry after all…

What I really like about this chart is that it does not try to combine the two series into one. Instead, by keeping the series separate on different plots, the reader can clearly examine the trends in both searches and consumption.

You also run into the problem of how to overlay two different scales. By placing one line atop the other, the user might implicitly understand that as higher or better than the lower series when, one, that may not be true. Or, two, the scales are so different they prevent the direct comparison the chart would otherwise imply as possible.

Here, the designers rightly chose to separate the two plots, and then highlighted the month of January. (I also enjoy the annotation of the World Cup.) I might have gone so far as to further limit the palette and make both series the same colour, but I understand the decision to make them distinct.

But, overall, as the piece points out, drinking in Britain seems to correlate to the weather/temperature. People go out to the pubs more on warmer days than colder. But regardless of any post-holiday hangover, they still consumer beer in January.

I’ll drink to that.

Credit for the piece goes to the Economist Data Team.

More on California’s Dry Heat

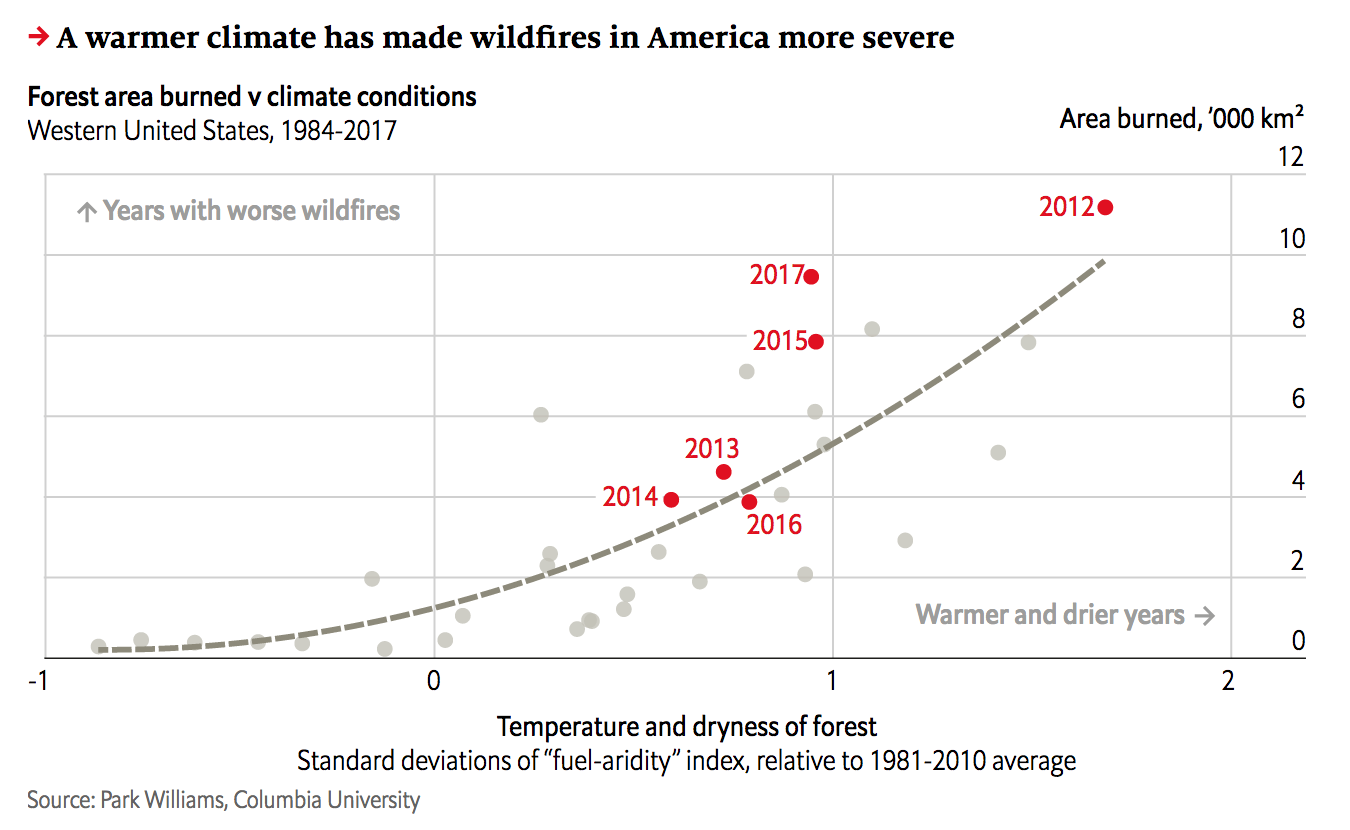
Yesterday we looked at the wildfire conditions in California. Today, we look at the Economist’s take, which brings an additional focus on the devastation of the fires themselves. However, it adds a more global perspective and looks at the worldwide decline in forest fires and both where and why that is the case.

California isn't looking too…hot. Too soon?
California isn’t looking too…hot. Too soon?

The screenshot here focuses on California and combines the heat and precipitation we looked at yesterday into a fuel-aridity index. That index’s actual meaning is simplified in the chart annotations that indicate “warmer and drier years” further along the x-axis. The y-index, by comparison, is a simpler plot of the acres burned in fires.

This piece examines more closely that link between fires and environmental conditions. But the result is the same, a warming and drying climate leaves California more vulnerable to wildfires. However, the focus of the piece, as I noted above, is actually on the global decline of wildfires.

Only 2% of wildfires are actually in North America, the bulk occur in Africa. And the piece uses a nice map to show just where those fires occur. In parallel the text explains how changing economic conditions in those areas are lessening the risk of wildfire and so we are seeing a global decline—even with climate change.

Taken with yesterday’s piece with its hyper-California focus, this provides a more global context of the problem of wildfires. It’s a good one-two read.

Credit for the piece goes to the Economist Data Team.

Dry Heat Is Only Part of California’s Problem

Wildfires continue to burn across in California. One, the Camp Fire in northern California near Chico, has already claimed 77 lives. But why has this fire been so deadly?

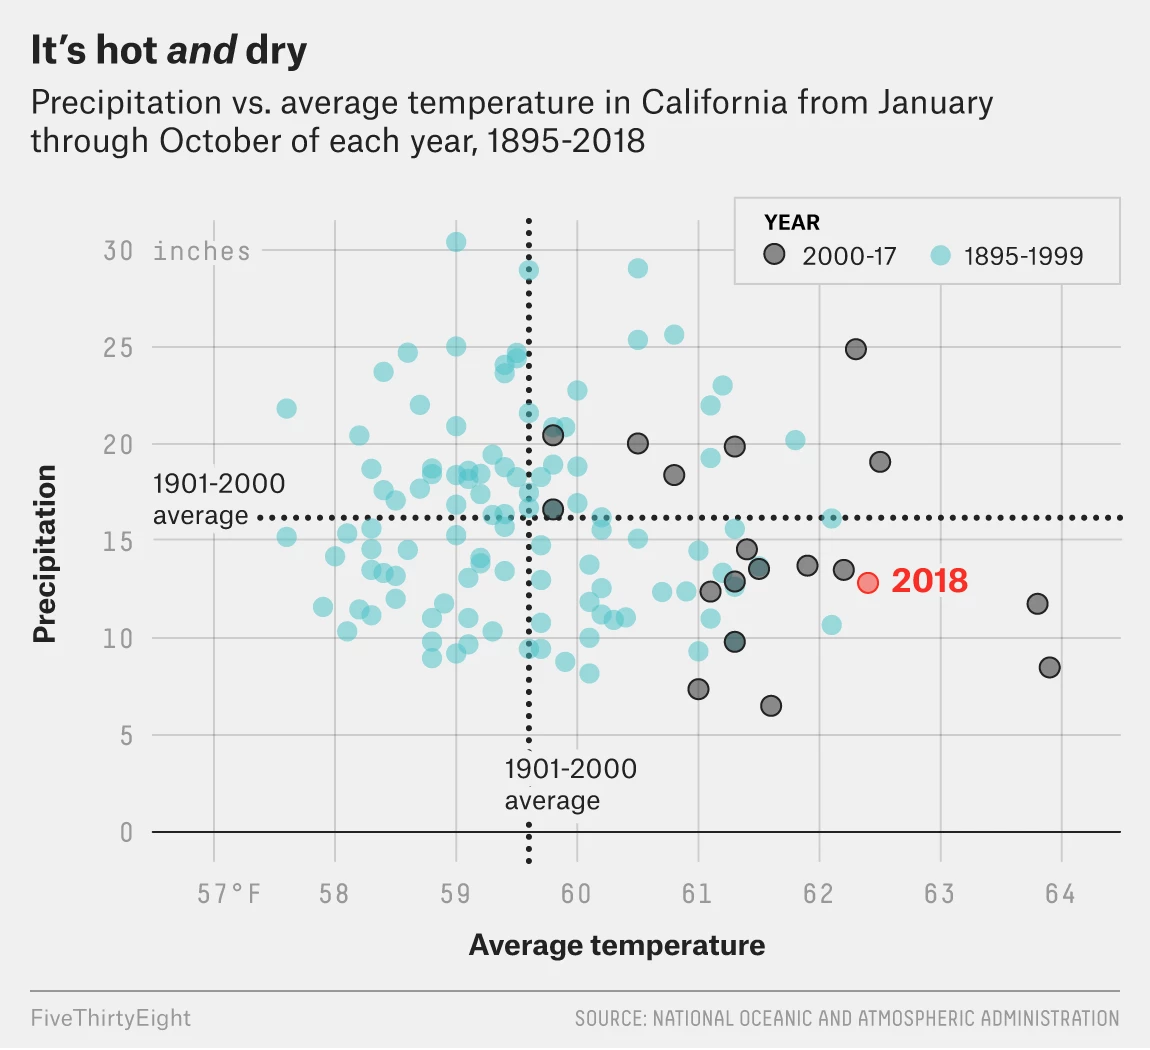
FiveThirtyEight explained some of the causes in an article that features a number of charts and graphics. The screenshot below features a scatter plot looking at the temperature and precipitation recorded from winter through autumn every year since 1895.

The evolving California climate

The designers did a good job of highlighting the most recent data, separating out 2000 through 2017 with the 2018 data highlighted in a third separate colour. But the really nice part of the chart is the benchmarking done to call out the historic average. Those dotted lines show how over the last nearly two decades, California’s climate has warmed. However, precipitation amounts vary. (Although they have more often tended to be below the long-term average.)

I may have included some annotation in the four quadrants to indicate things like “hotter and drier” or “cooler and wetter”, but I am not convinced they are necessary here. With more esoteric variables on the x- and y-axis they would more likely be helpful than not.

The rest of the piece makes use of a standard fare line chart and then a few maps. Overall, a solid piece to start the week.

Credit for the piece goes to Christie Aschwanden, Anna Maria Barry-Jester, Maggie Koerth-Baker and Ella Koeze.

The Midterms Are Not Over

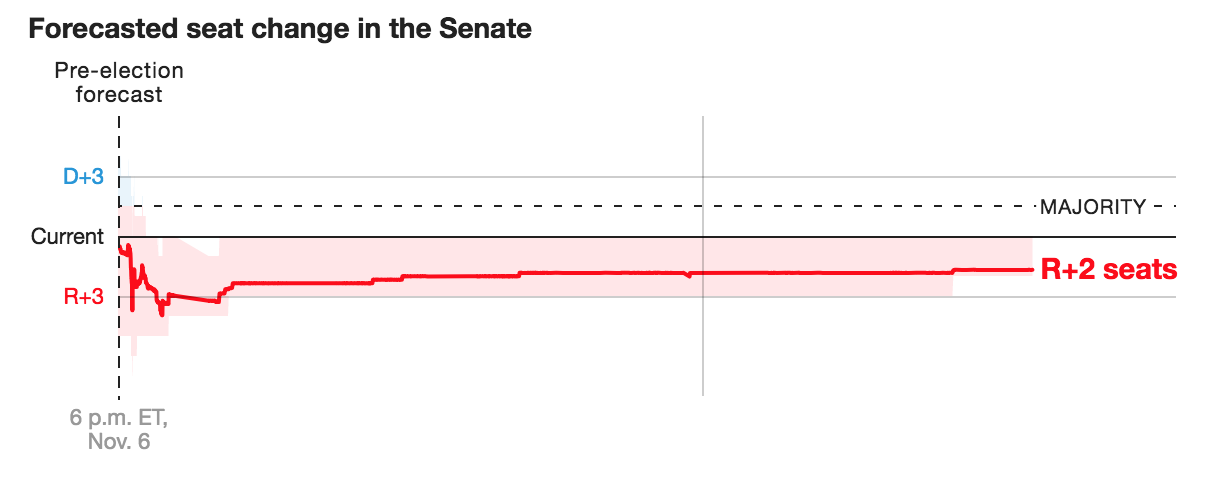
Your author is back after a few days out sick and then the Armistice Day holiday. But guess what? The elections are not yet all over. Instead, there are a handful of races to call. Below is a screenshot from a FiveThirtyEight article tracking those races still too close to call.

The Republican gain might not be as big as they had hoped

Why are there races? Because often time mail-in ballots need only be postmarked by Election Day. Therefore they can still be arriving in the days after the election and their total must be added to the race. (Plus uncounted/missed ballots et cetera.) For example, the late count and mail-in ballots are what tipped the Arizona senate seat. When we went to bed on Tuesday night—for me Wednesday morning—Arizona was a Republican hold, albeit narrowly. Now that the late count ballots have been counted, it’s a Democratic pickup.

The graphic above does a nice job showing how these races and their late calls are impacting seat changes. Their version for the House is not as interesting because the y-axis scale is so much greater, but here, the user can see a significant shift. The odds were always good that the Republicans would pick up seats—the question was how many. And with Arizona flipping, that leaves two seats on the table. Mississippi’s special election will almost certainly be a Republican hold. The question is what about Florida? The last I saw the race is separated by 0.15% of the vote. That’s pretty tiny.

Credit for the piece goes to the FiveThirtyEight graphics department.