Small Dog Days of Summer

For my readers in the northern hemisphere, which is the vast majority of you, we are in the middle of meteorological summer, the dog days. And whilst my UK and Europe readers continue to bake under temperatures greater than 40ºC (104ºF), the northeast United States and Philadelphia in particular is looking at a heatwave starting today that’s forecast to peak at a temperature of 38ºC (100ºF) this weekend and a heat index reaching 41ºC (106ºF) tomorrow.

Not cool.

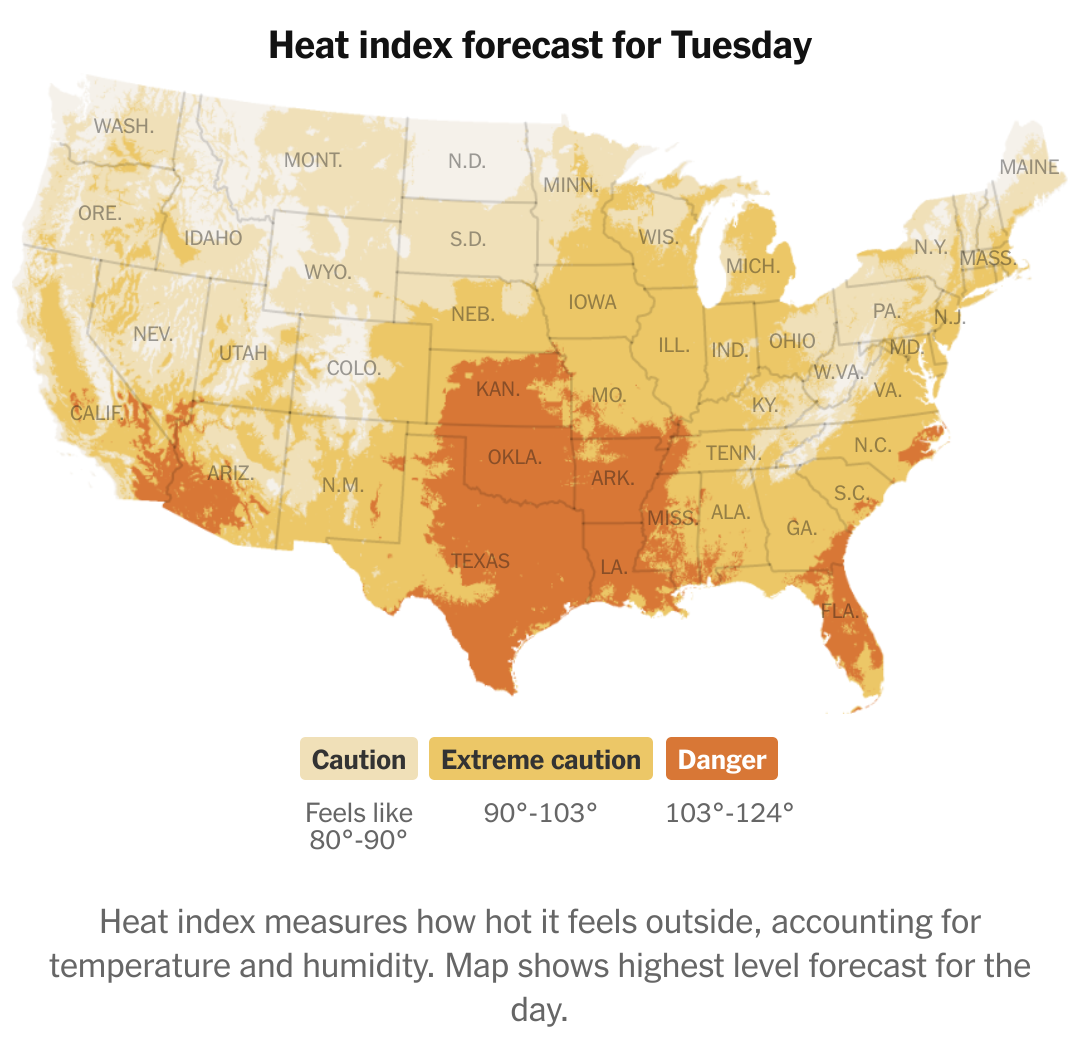
Yesterday we examined a completely different topic, property tax increases in Philadelphia, but we contrasted that work with a heat index map from the New York Times. With the heatwave beginning this afternoon, however, it seemed apropos to revisit that contrasting article.

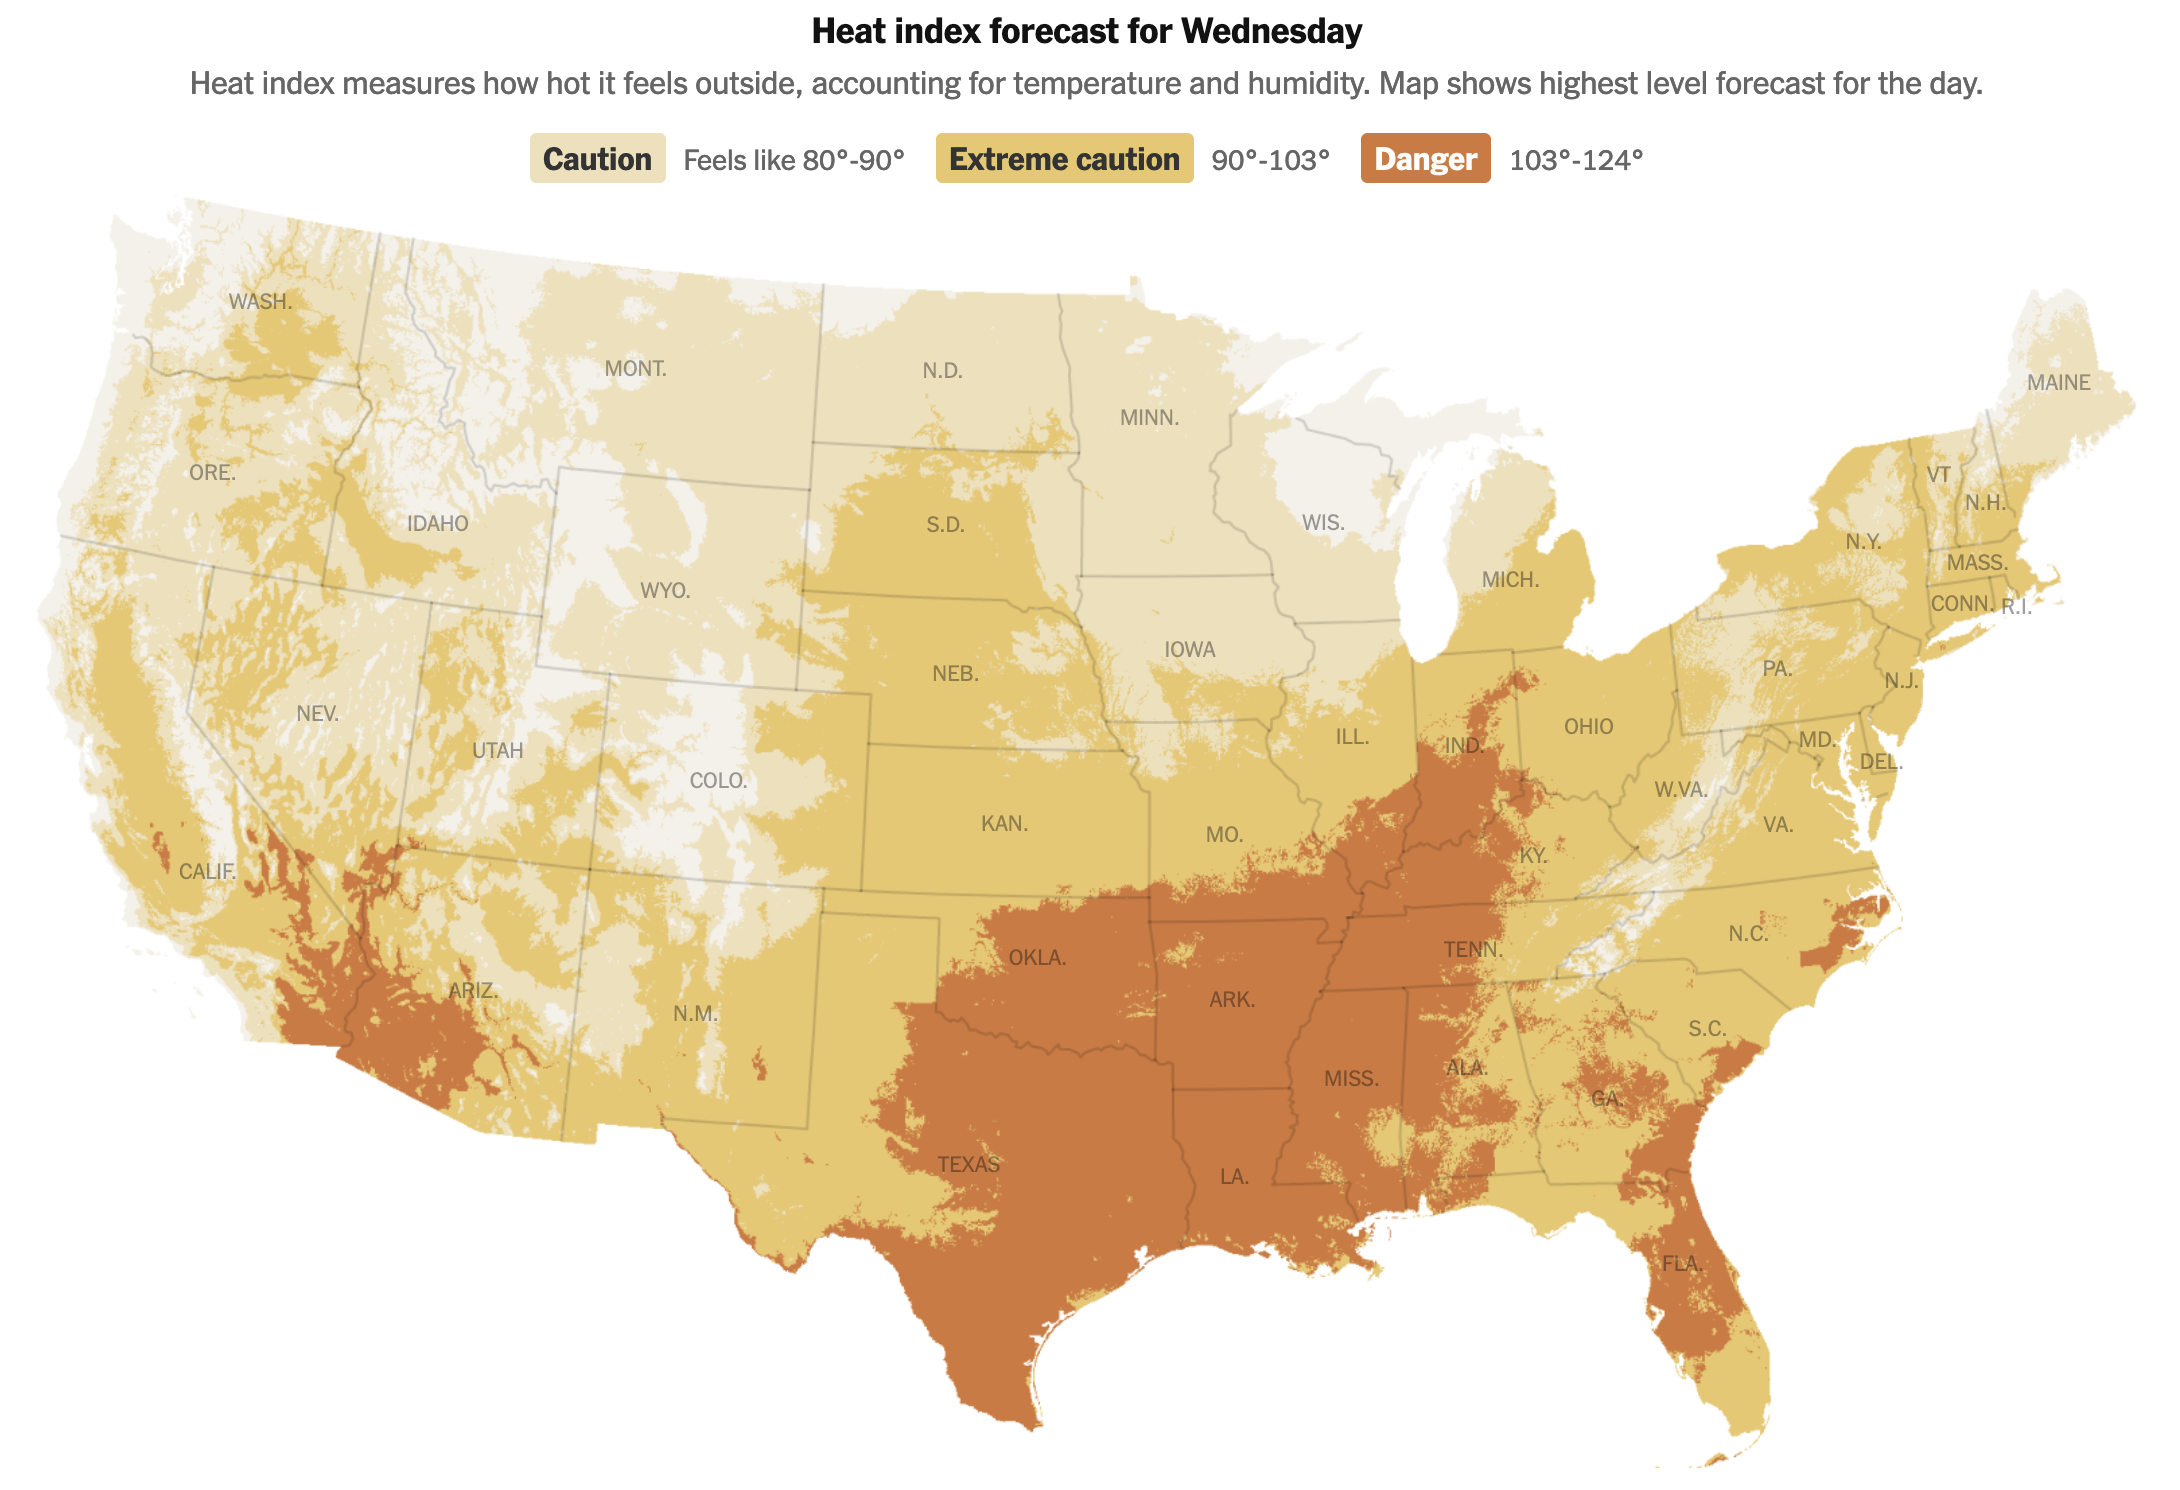
It begins with the map that we looked at yesterday. Of course yesterday was Tuesday. Today is Wednesday, and so you can already compare these two maps to see how and where the heat has shifted. Spoiler: the Southeast and Midwest.
Definitely not cooler.

It does so with a nice simple three-colour unidirectional spectrum from a light yellow to a burnt orange. And you can see the orange spreading up from the Gulf Coast and along the southeastern Atlantic Seaboard.

For those not familiar, the heat index is basically what the air “feels like” taking into consideration the actual temperature and the relative humidity in the air. Humans cool themselves via perspiration and when the air is excessively humid our ability to perspire decreases and thus the body begins to run hotter. Warmer temperatures allow the atmosphere to increase the amount of moisture it can contain and you can see all that Gulf and subtropical moisture carrying itself into the hot air moving up from the south.

Very not cool.

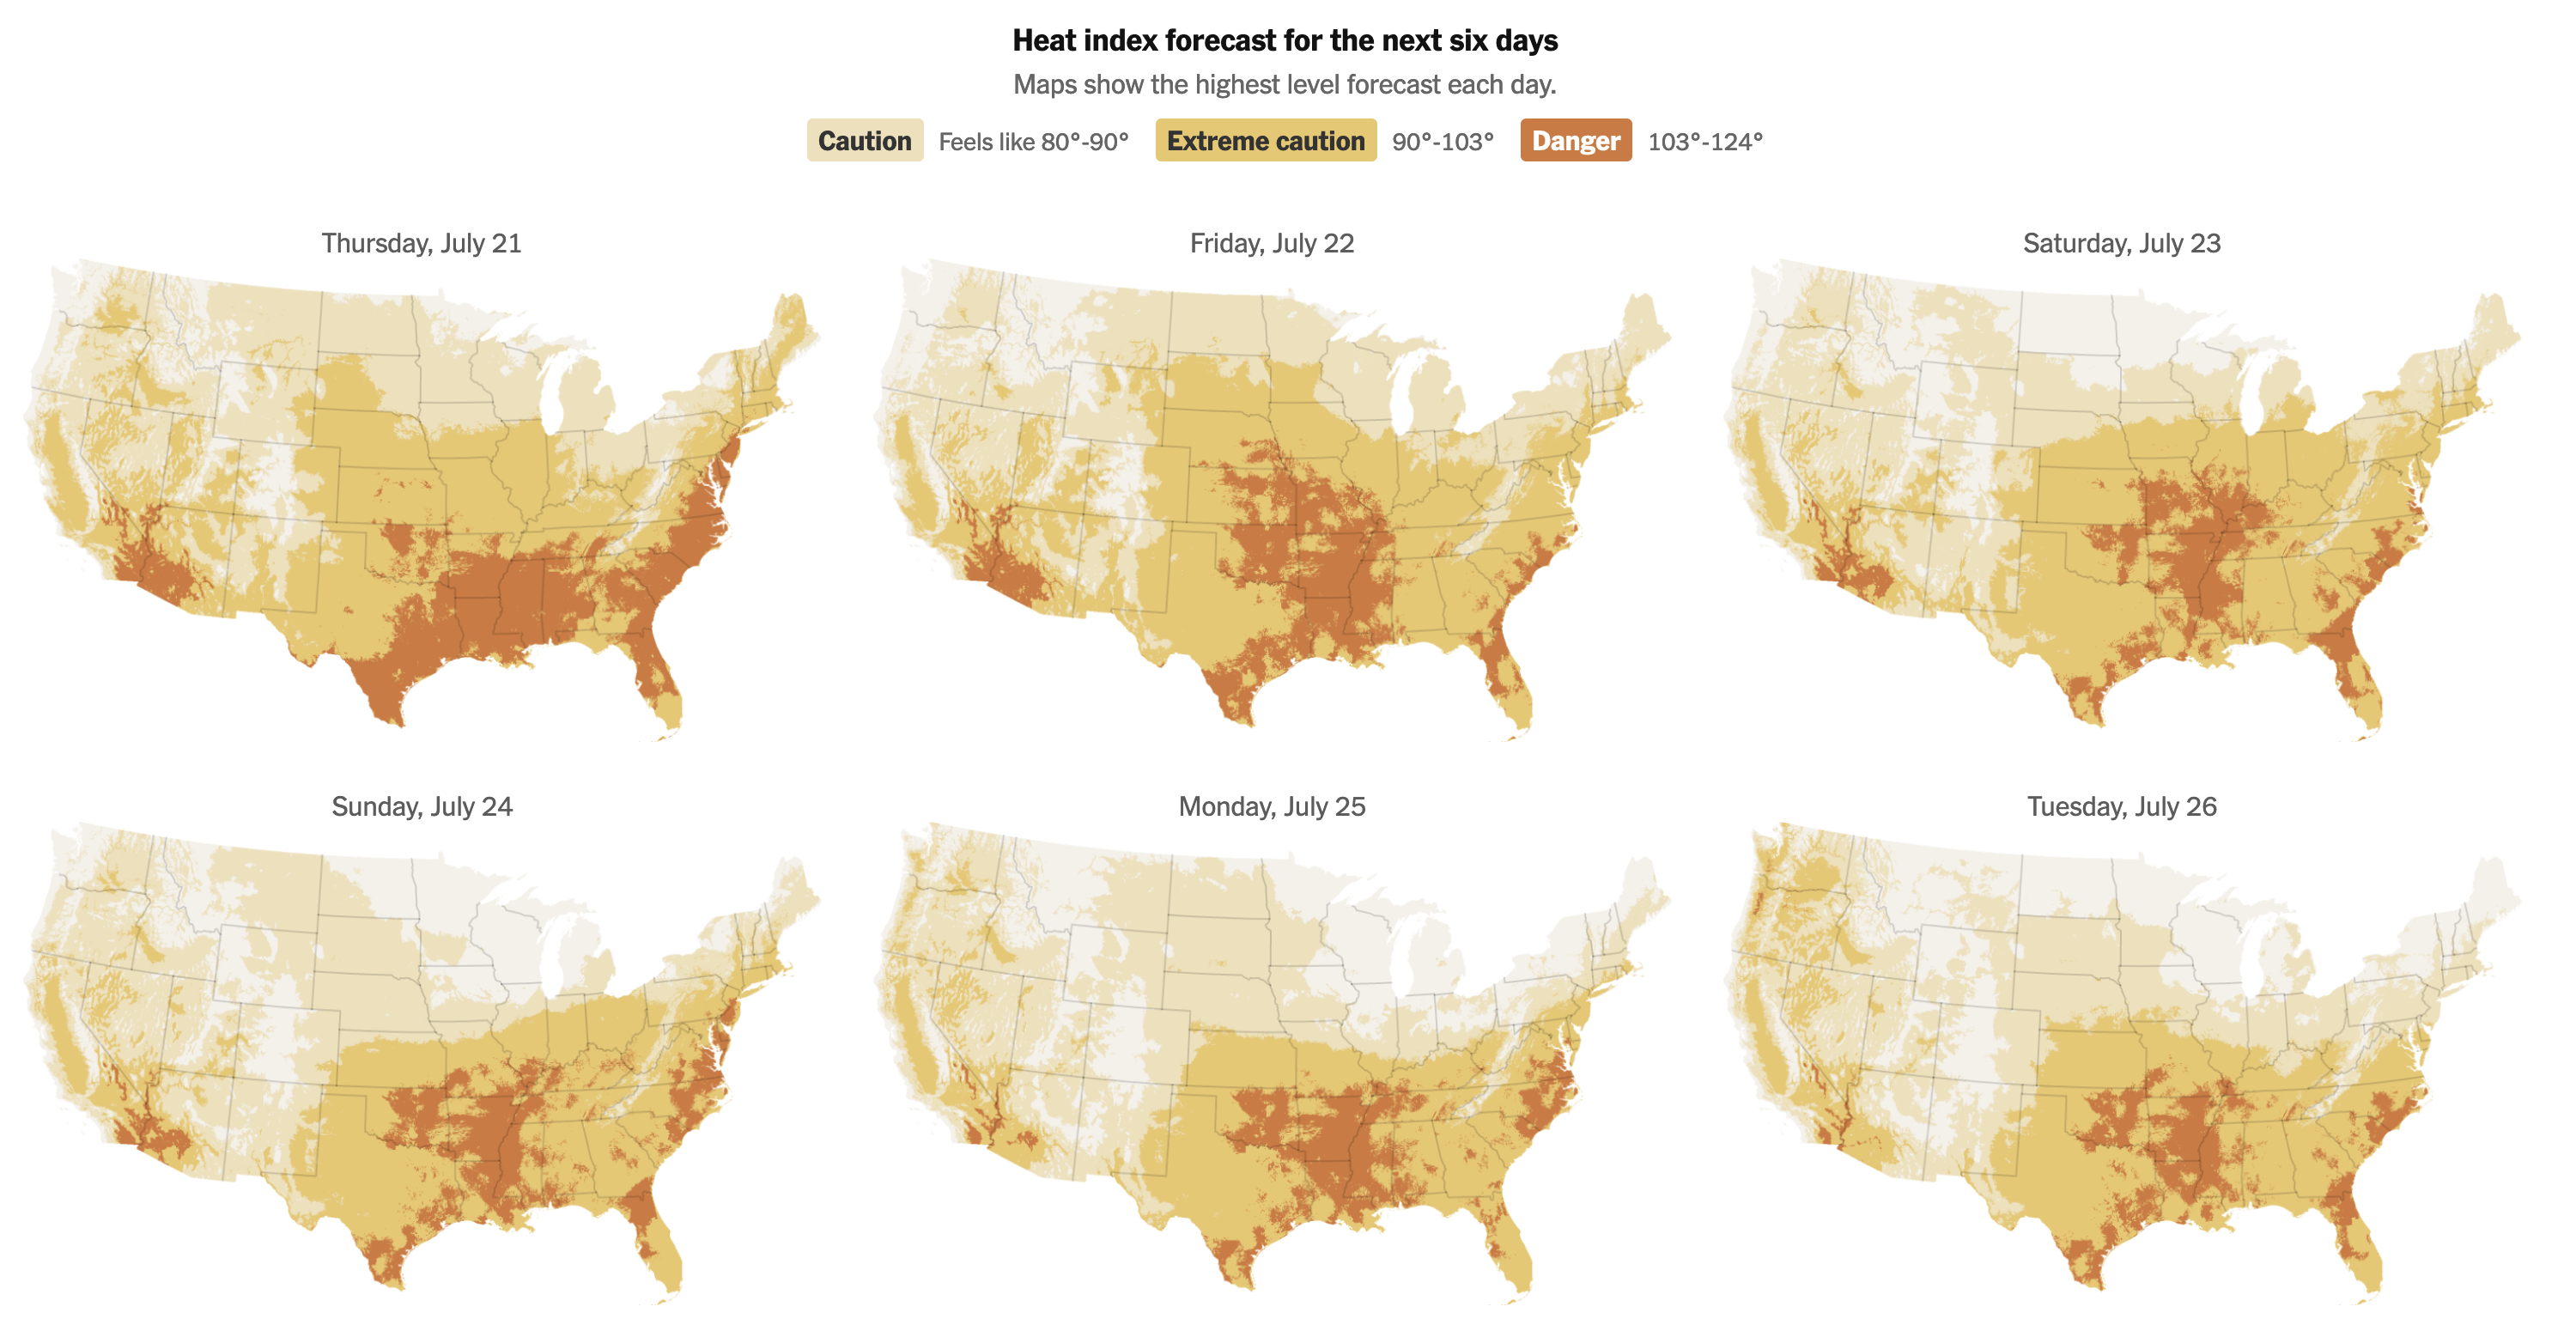
The piece also offers a look at the forecast for the heat index, showing the next six days. These small multiples allow the reader to see the geographic progression of the heat. Whereas today will be particularly for parts of the Midwest in southern Illinois and Indiana, tomorrow will see the worst for the Eastern Seaboard. Luckily the heat index retreats a bit, though as I noted above, the temperatures will continue to rise until Sunday, meaning higher temperatures, but lower relative humidity. For Philadelphia in particular we talking about 50% relative humidity tomorrow and only 35% on Sunday. That makes a big difference.
The not coolest.

Overall this is a great piece despite the content.

Personally, I just can’t wait until summer.

Credit for the piece goes to Matthew Bloch, Lazaro Gamio, Zach Levitt, Eleanor Lutz, and John-Michael Murphy.

Legendary Adjustments

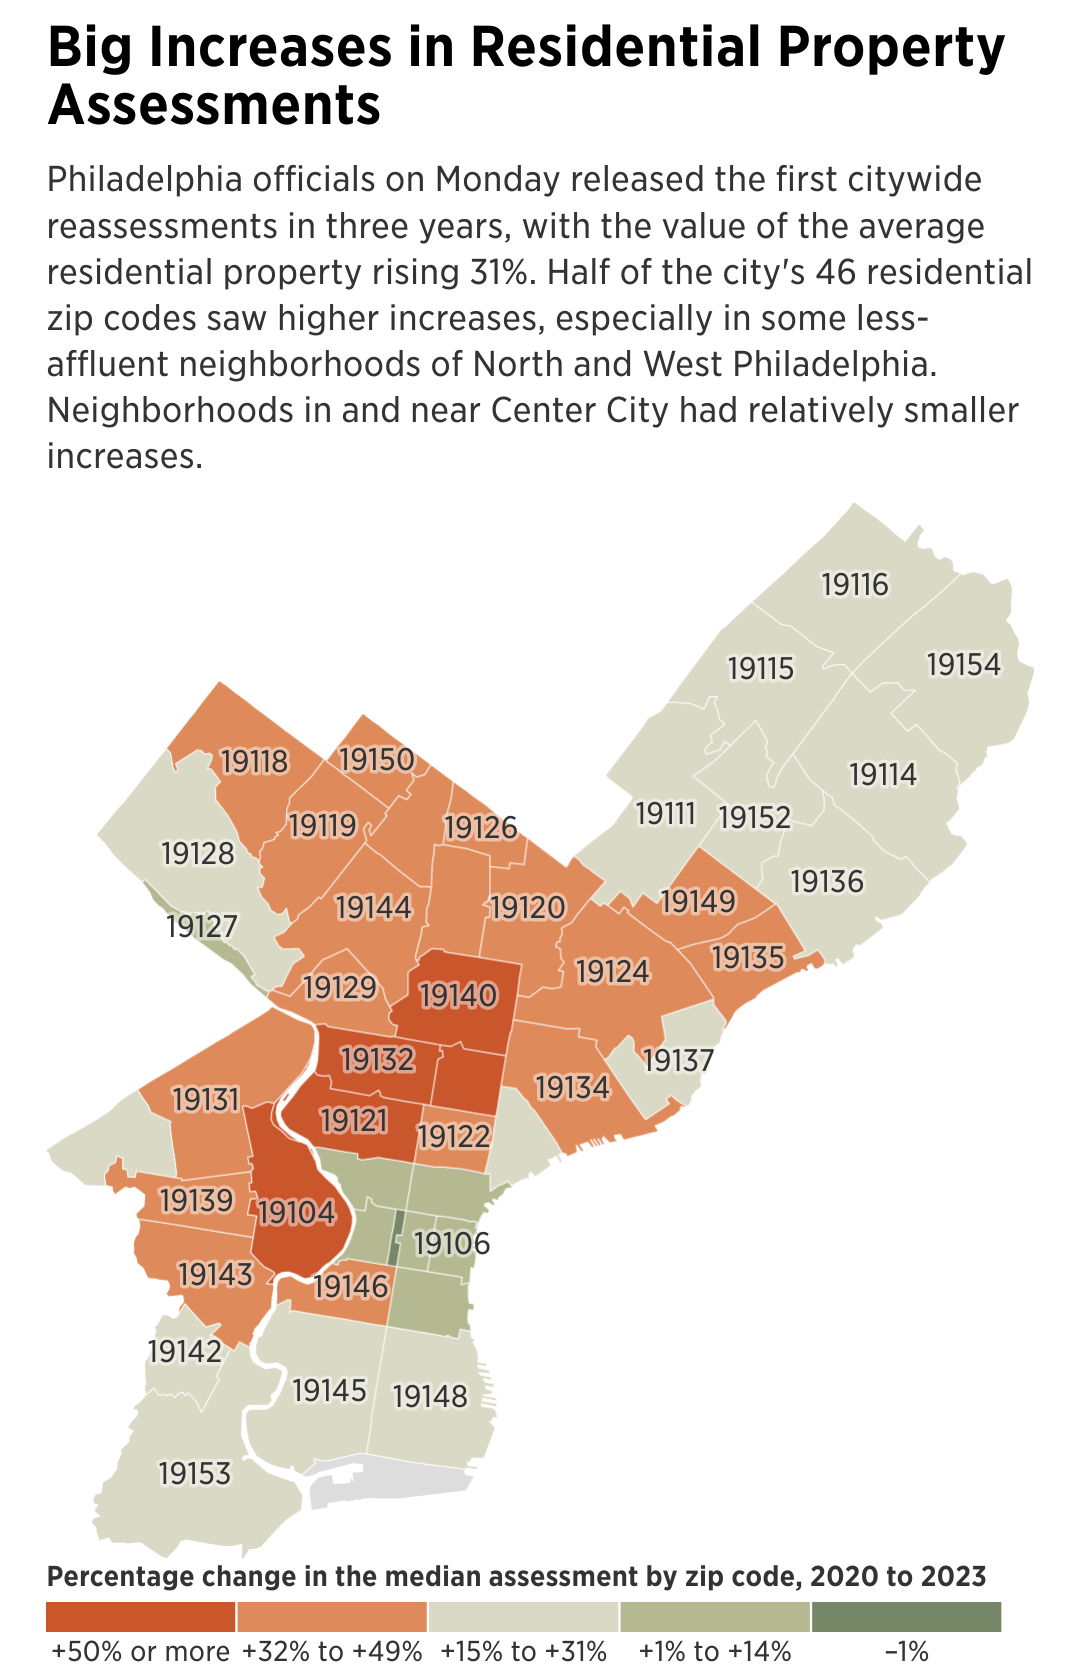
The other day I was reading an article about the coming property tax rises in Philadelphia. After three years—has anything happened in those three years?—the city has reassessed properties and rates are scheduled to go up. In some neighbourhoods by significant amounts. I went down the related story link rabbit hole and wound up on a Philadelphia Inquirer article I had missed from early May that included a map of just where those increases were largest. The map itself was nothing crazy.

A pretty standard map here.

We have a choropleth with city zip codes coloured by the percentage increase. I was thrown for a bit of a loop as I immediately perceived the red representing lower values and green higher values, the standard green to red palette. But given that higher values are “bad”, I can live red representing bad and sitting at the top of the spectrum.

I filed it away to review later, but when I returned I visited on my mobile phone. And what I saw broadly looked the same, but there was a disconcerting difference. Take a look at the legend.

One little difference…

You can see that instead of running vertically like it did on the desktop, now the legend runs horizontally across the bottom. In and of itself, that’s not the issue. Though I do wonder if this particular legend could have still worked in roughly the same spot/alignment given the geographic shape of Philadelphia along the Delaware River.

Rather look at the order. We go from the higher, positive values on the left to the negative, lower values on the right. When you read the legend, this creates some odd jumps. For example, we move from “+32% to +49%” then to “+15% to +31%”. We would normally say something to the point of the increase bins moving from “+15% to +31%” then to “+32% to +49%”. In other words, the legend itself is a continuum.

The fix for this would be to simply flip the running order of the legend. Put the lower values on the left and then step up to the right. For a quick comparison, I visited the New York Times website and pulled up the first graphic I could find that looked like a choropleth. Here we have a map of the dangerous temperatures across the United States.

Definitely staying inside today.

Note how here the New York Times also runs their legend horizontally below the graphic. But instead of running high-to-low like in the Inquirer, the Times runs low-to-high, making for a more natural and intuitive legend.

This kind of simple ordering change would make the Inquirer’s map that much better.

Credit for the Inquirer piece goes to Kasturi Pananjady and John Duchneskie.

Credit for the Times piece goes to Matthew Bloch, Lazaro Gamio, Zach Levitt, Eleanor Lutz, and John-Michael Murphy.

Turn Down the Heat

First, as we all should know, climate change is real. Now that does not mean that the temperature will always be warmer, it just means more extreme. So in winter we could have more severe cold temperatures and in hurricane season more powerful storms. But it does mean that in the summer we could have more frequent and hotter heat waves.

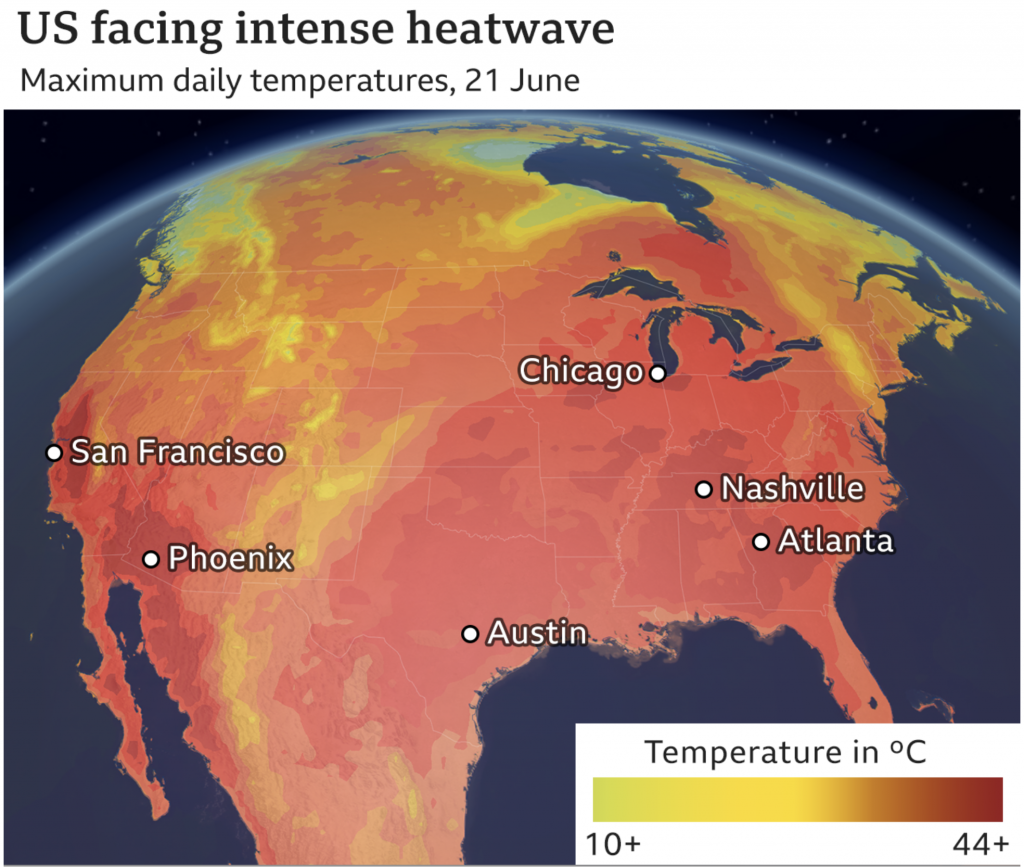
Enter the United States, or more specifically the North American continent. In this article from the BBC we see photographs of the way the current heatwave is playing out across the continent. But it opens up with a nice map. Well, nice as in nicely done, not as in this is actually nice weather.

Yeah, no thanks.

The only complaint most of my American readers might have is that the numbers make no sense. That’s because it’s all in Celsius. Unfortunately for Americans most of the rest of the world uses Celsius and not Fahrenheit. Suffice it to say you don’t want to be in the dark reds. 44C equals 111F. 10C, the greenish-yellow side of the spectrum, is a quite pleasant 50F.

And that can relate to a small housekeeping note. I’m back after a long weekend up in the Berkshires. I took a short holiday to go visit the area near that north–south band of yellow over the eastern portion of the United States. It was very cool and windy and overall a welcome respite from the heat that will be building back in here across the eastern United States later this week.

At least yesterday was the summer solstice. The days start getting shorter. And in about five weeks or so we will reach the daily average peak temperature here in Philadelphia. At that point the temperatures begin cooling towards their eventual mid-January nadir.

I can’t wait.

Credit for the piece goes to the BBC graphics department.

It’s Warming Up

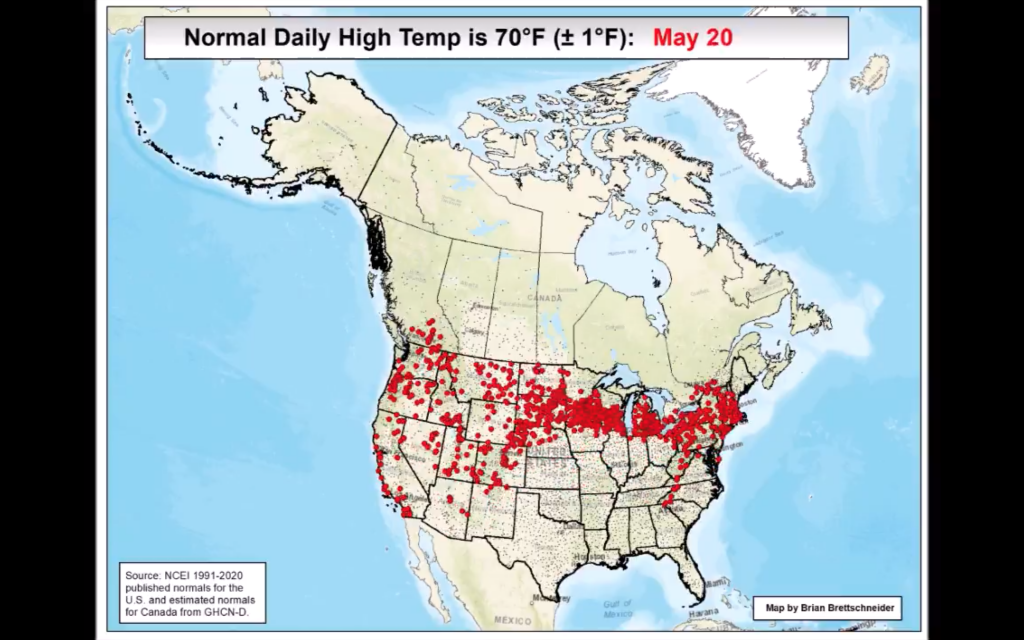
As many of my readers know, I prefer my weather cooler and summer is probably my least favourite season—weather wise at least. Appropriately, my vaccination will be kicking in just in time for a small, early season heatwave. Felt like an appropriate time to share this piece from Brian Brettschenider.

It’s just an animated map showing where in the United States and Canada the daily average high temperature is 70ºF for each day of the year. Here’s where you can expect a daily high of 70ºF for the date of 20 May. Not Philadelphia.

I’m sure going to miss those reds.

Make sure to click through to watch the video on the Twitter.

Credit for the piece goes to Brian Brettschneider.