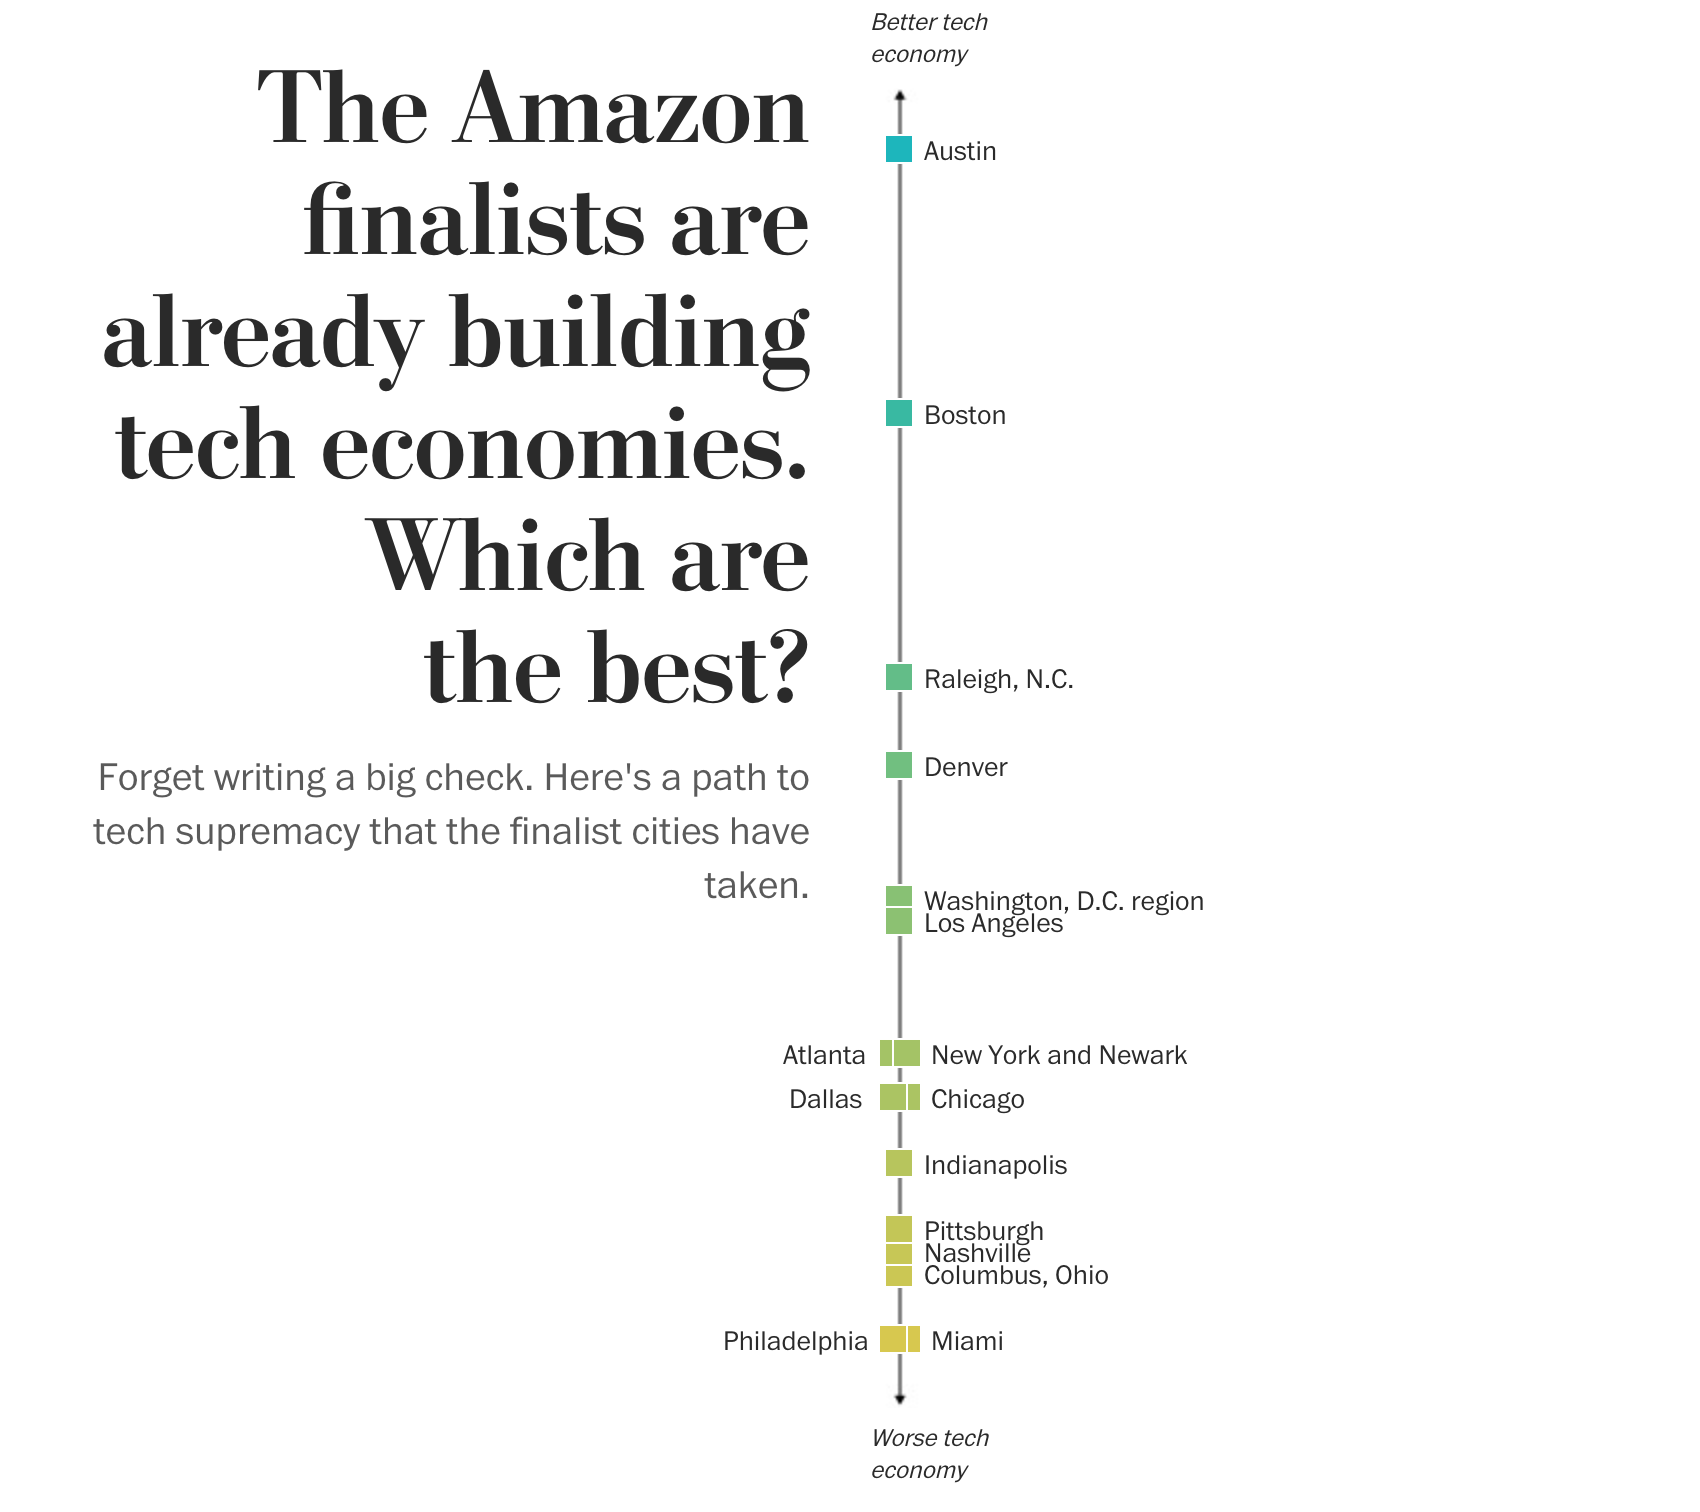
Earlier this March the Washington Post published a piece looking at the twenty finalist contenders for the second Amazon headquarters. Specifically it explored how the cities rank in metrics that speak to a city’s technology and innovation economy.
That in and of itself, while incredibly fascinating, is not noteworthy in and of itself. Though I will say the article’s online title is neatly presented, split half-and-half with the vertical graphic showing the cities ranked.
But the point that was really neat was the interactivity that followed. Here you can see a dropdown from which the user selects a city of interest—surprise, surprise we are looking at Philadelphia. From that point on, the piece keeps the selected city highlighted in every graphic that follows.
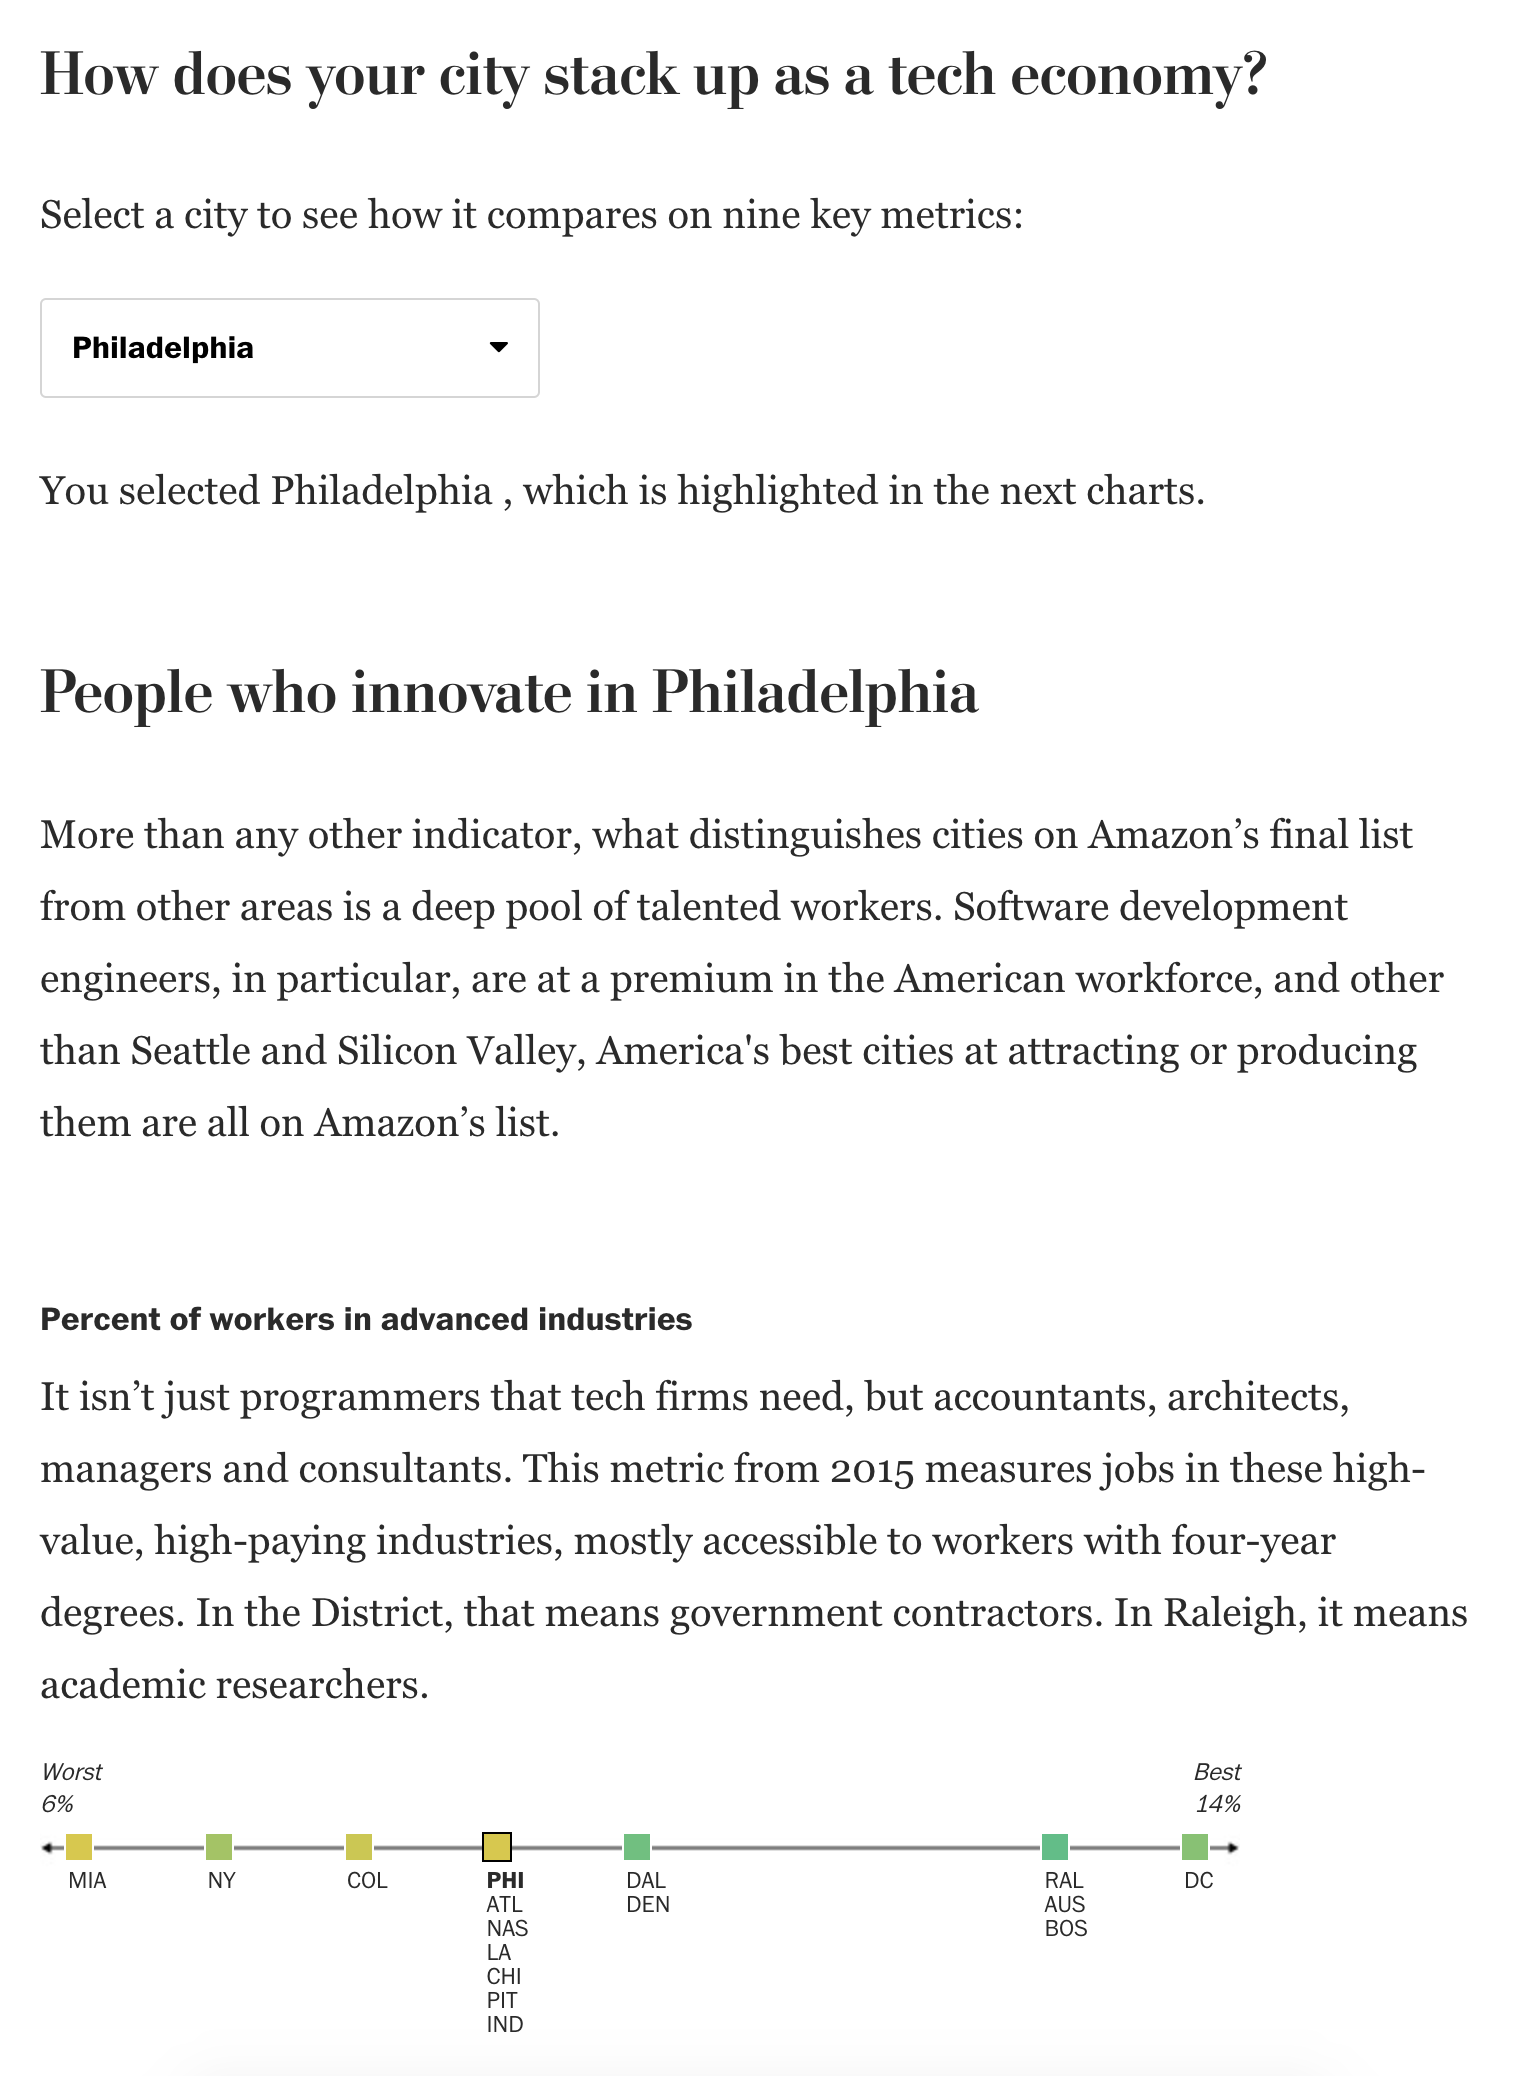
Again, that is nothing truly surprising, but it is neat to see. What would have taken it to the next step is if each of those associated paragraphs were tailored to the specific city. Instead, they appear to be general paragraphs.
But overall, it does a really nice job of comparing the twenty cities—it’s actually fewer because both Washington and New York have multiple sites per metro area—across the different metrics.
The only part that left me scratching my head a bit was the colour choice. I am not certain that it needs the blue-green to yellow-green palette. Those colours seem defined by a city’s placement on the overall list and I am not convinced that the piece would not have still worked if they had been only a single colour, using another colour to define the selected city.
Credit for the piece goes to Darla Cameron and Jonathan O’Connell.
Leave a Reply
You must be logged in to post a comment.