How the Globe’s Writers Voted

Yesterday we looked at a piece by the Boston Globe that mapped out all of David Ortiz’s home runs. We did that because he has just been voted into baseball’s Hall of Fame. But to be voted in means there must be votes and a few weeks after the deadline, the Globe posted an article about how that publication’s eligible voters, well, voted.

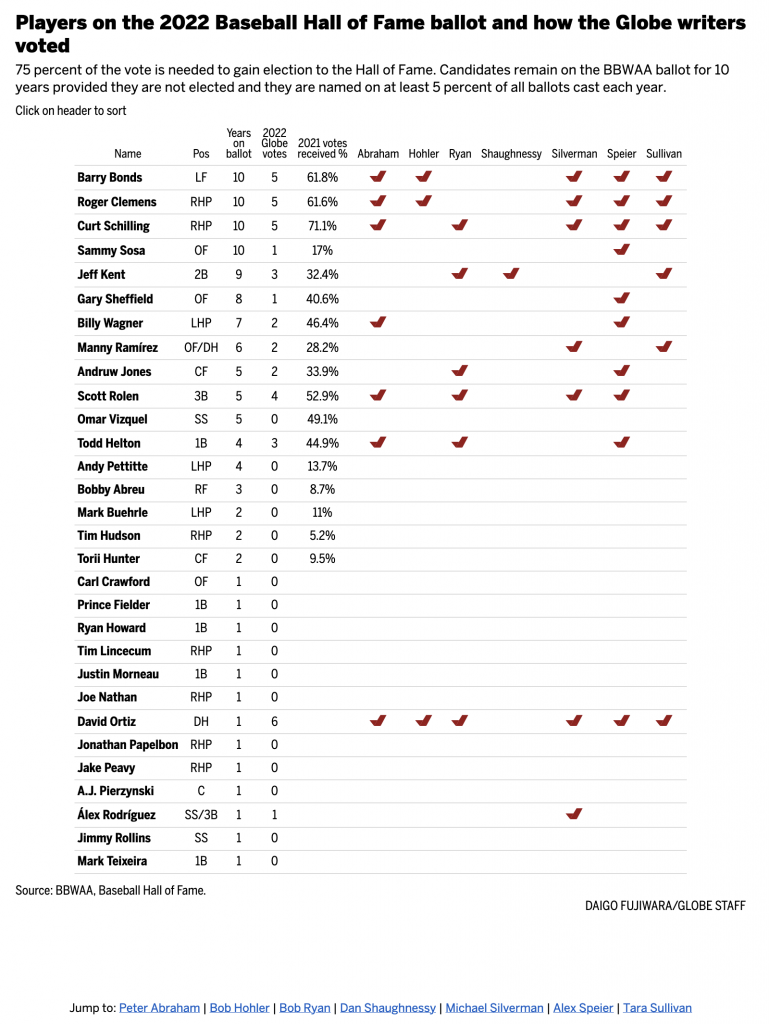
The graphic here was a simple table. But as I’ll always say, tables aren’t an inherently bad or easy-way-out form of data visualisation. They are great at organising information in such a way that you can quickly find or reference specific data points. For example, let’s say you wanted to find out whether or not a specific writer voted for a specific ballplayer.
Just don’t ask me for whom I would have voted…

Simple red check marks represent those players for whom the Globe’s eligible staff voted. I really like some of the columns on the left that provide context on the vote. For the unfamiliar, players can only remain on the list for up to ten years. And so for the first four, this was their last year of eligibility. None made the cut. Then there’s a column for the total number of votes made by the Globe’s staff. Following that is more context, the share of votes received in 2021. Here the magic number if 75% to be elected. Conversely, if you do not make 5% you drop off the following year. Almost all of those on their first year ballot failed to reach that threshold.

The only potential drawback to this table is that by the time you reach the end of the table, there are few check marks to create implicit rules or lines that guide you from writer to player. David Ortiz’s placement helps because six—remarkably not all Globe writers voted for him—it grounds you for the only person below him (alphabetically) to receive a vote. And we need that because otherwise quickly linking Alex Rodriguez to Alex Speier would be difficult.

Finally below the table we have jump links to each writer’s writings about their selections. And if you’ll allow a brief screenshot of that…

Still don’t ask me

We have a nicely designed section here. Designers delineated each author’s section with red arrows that evoke the red stitching on a baseball. It’s a nice design tough. Then each author receives a headline and a small call out box inside which are the players—and their headshots—for whom the author voted. An initial dropped capital (drop cap), here a big red M, grabs the reader’s attention and draws them into the author’s own words.

Overall this was a solidly designed piece. I really enjoyed it. And for those who don’t follow the sport, the table is also an indicator of how divisive the voting can be. Even the Globe’s writers couldn’t unanimously agree on voting for David Ortiz.

Credit for the piece goes to Daigo Fujiwara and Ryan Huddle.

The May Jobs Report

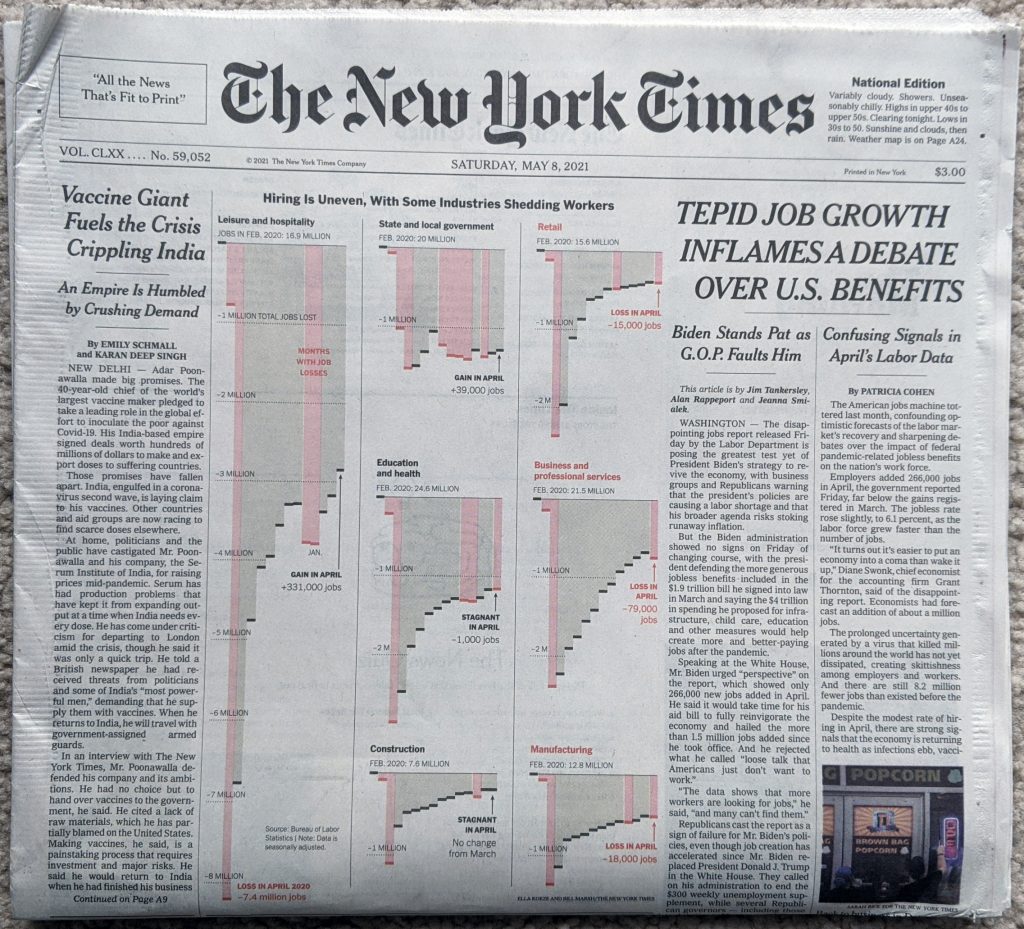
Last Friday, the government released the labour statistics from April and they showed a weaker rebound in employment than many had forecasted. When I opened the door Saturday morning, I got to see the numbers above the fold on the front page of the New York Times.

Welcome to the weekend

What I enjoyed about this layout, was that the graphic occupied half the above the fold space. But, because the designers laid the page out using a six-column grid, we can see just how they did it. Because this graphic is itself laid out in the column widths of the page itself. That allows the leftmost column of the page to run an unrelated story whilst the jobs numbers occupy 5/6 of the page’s columns.

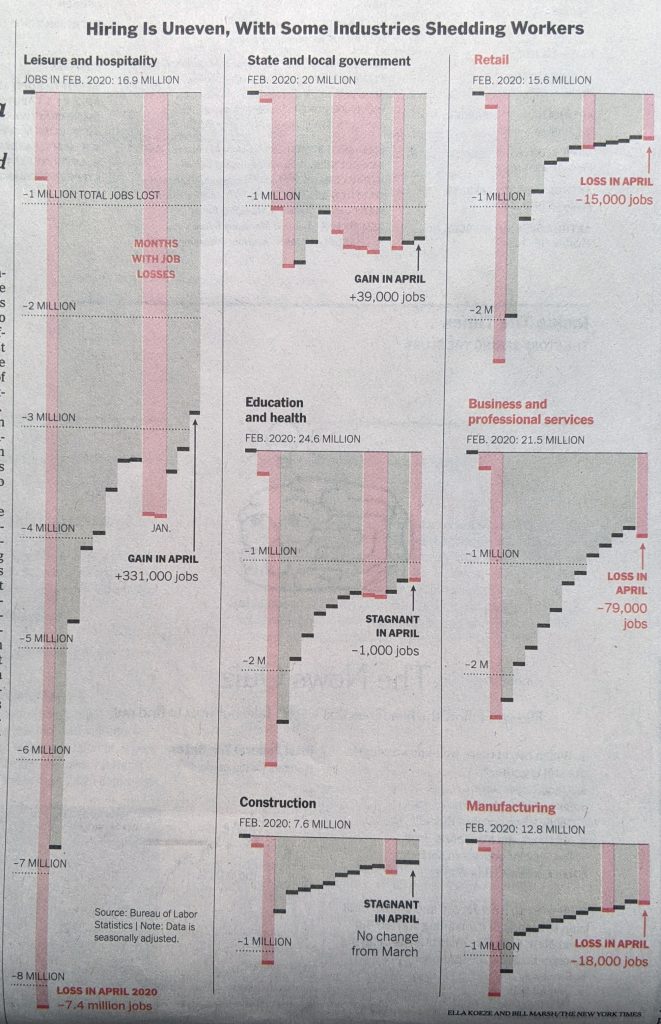
If we look at the graphic in more detail, the designers made a few interesting decisions here.

Jobs in detail

First, last week I discussed a piece from the Times wherein they did not use axis labels to ground the dataset for the reader. Here we have axis labels back, and the reader can judge where intervening data points fall between the two. For attention to detail, note that under Retail, Education and health, and Business and professional services, the “illion” in -2 Million was removed so as not to interfere with legibility of the graphic, because of bars being otherwise in the way.

My issue with the axis labels? I have mentioned in the past that I don’t think a designer always needs to put the maximum axis line in place, especially when the data point darts just above or below the line. We see this often here, for example Construction and Manufacturing both handle it this way for their minimums. This works for me.

But for the column above Construction, i.e. State and local government and Education and health, we enter the space where I think the graphic needs those axis lines. For Education and health, it’s pretty simple, the red losses column looks much closer to a -3 million value than a -2 million value. But how close? We cannot tell with an axis line.

And then under State and local government we have the trickier issue. But I think that’s also precisely why this could use some axis lines. First, almost all the columns fall below the -1 million line. This isn’t the case of just one or two columns, it’s all but two of them. Second, these columns are all fairly well down below the -1 million axis line. These aren’t just a bit over, most are somewhere between half to two-thirds beyond. But they are also not quite nearly as far to -2 million as the ones we had in the Education and health growth were near to -3 million.

So why would I opt to have an axis line for State and local governments? The designers chose this group to add the legend “Gain in April”. That could neatly tuck into the space between the columns and the axis line.

Overall it’s a solid piece, but it needs a few tweaks to improve its legibility and take it over the line.

Credit for the piece goes to Ella Koeze and Bill Marsh.

500,000 Deaths

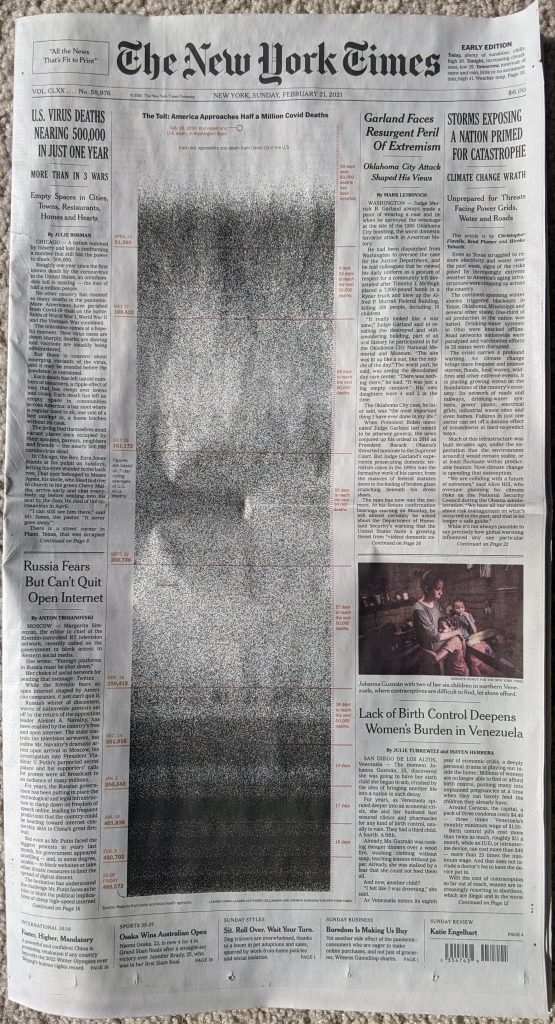
The United States surpassed 500,000 deaths from Covid-19. On Sunday, in advance of that sobering statistic, the New York Times published a front-page graphic that dominated the layout.

Sunday front page for the New York Times

Usually a front-page graphic will make use of the four-colour process and present richly coloured graphics. This, however, starkly lays out the timeline of deaths in the United States in black and white.

Meaningful graphics do not need to reinvent the wheel. This takes each life lost as a black dot and then, starting at the top in February, plots each day.

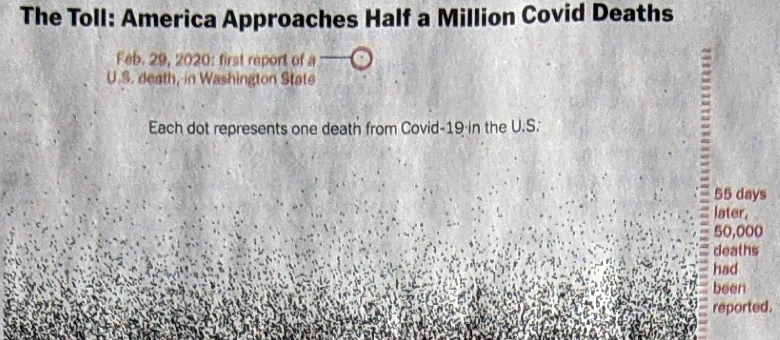
Detail of the graphic

The colour here serves as the annotation. The red circle drawing attention to the first reported death. And down the side the tick marks for days. Red lines indicate 50,000 death increments. The labels tell the story, we’ve needed fewer and fewer days to reach each subsequent 50,000 milestone.

As the first wave intensifies in March and April, the space fills with black dots. But as we enter summer and deaths fell, the space lightens. Late autumn and winter bring more death and you can see clearly towards the bottom of the chart, as we approach today, the graphic is nearly solid black.

If we want to look towards a hopeful point in the content, we can see first that it took 17 days then 15 to reach 400,00 deaths and 450,000 deaths, respectively. But it took 19 days to reach 500,000. As a nation we appear to finally be on the downward slope of this wave.

Returning to the piece, it’s a gut punch of simplicity in design.

Credit for the piece goes to Lazaro Gambio, Lauren Leatherby, Bill Marsh, and Andrew Sondern.

The Rise of the Tropic(al Plant)s

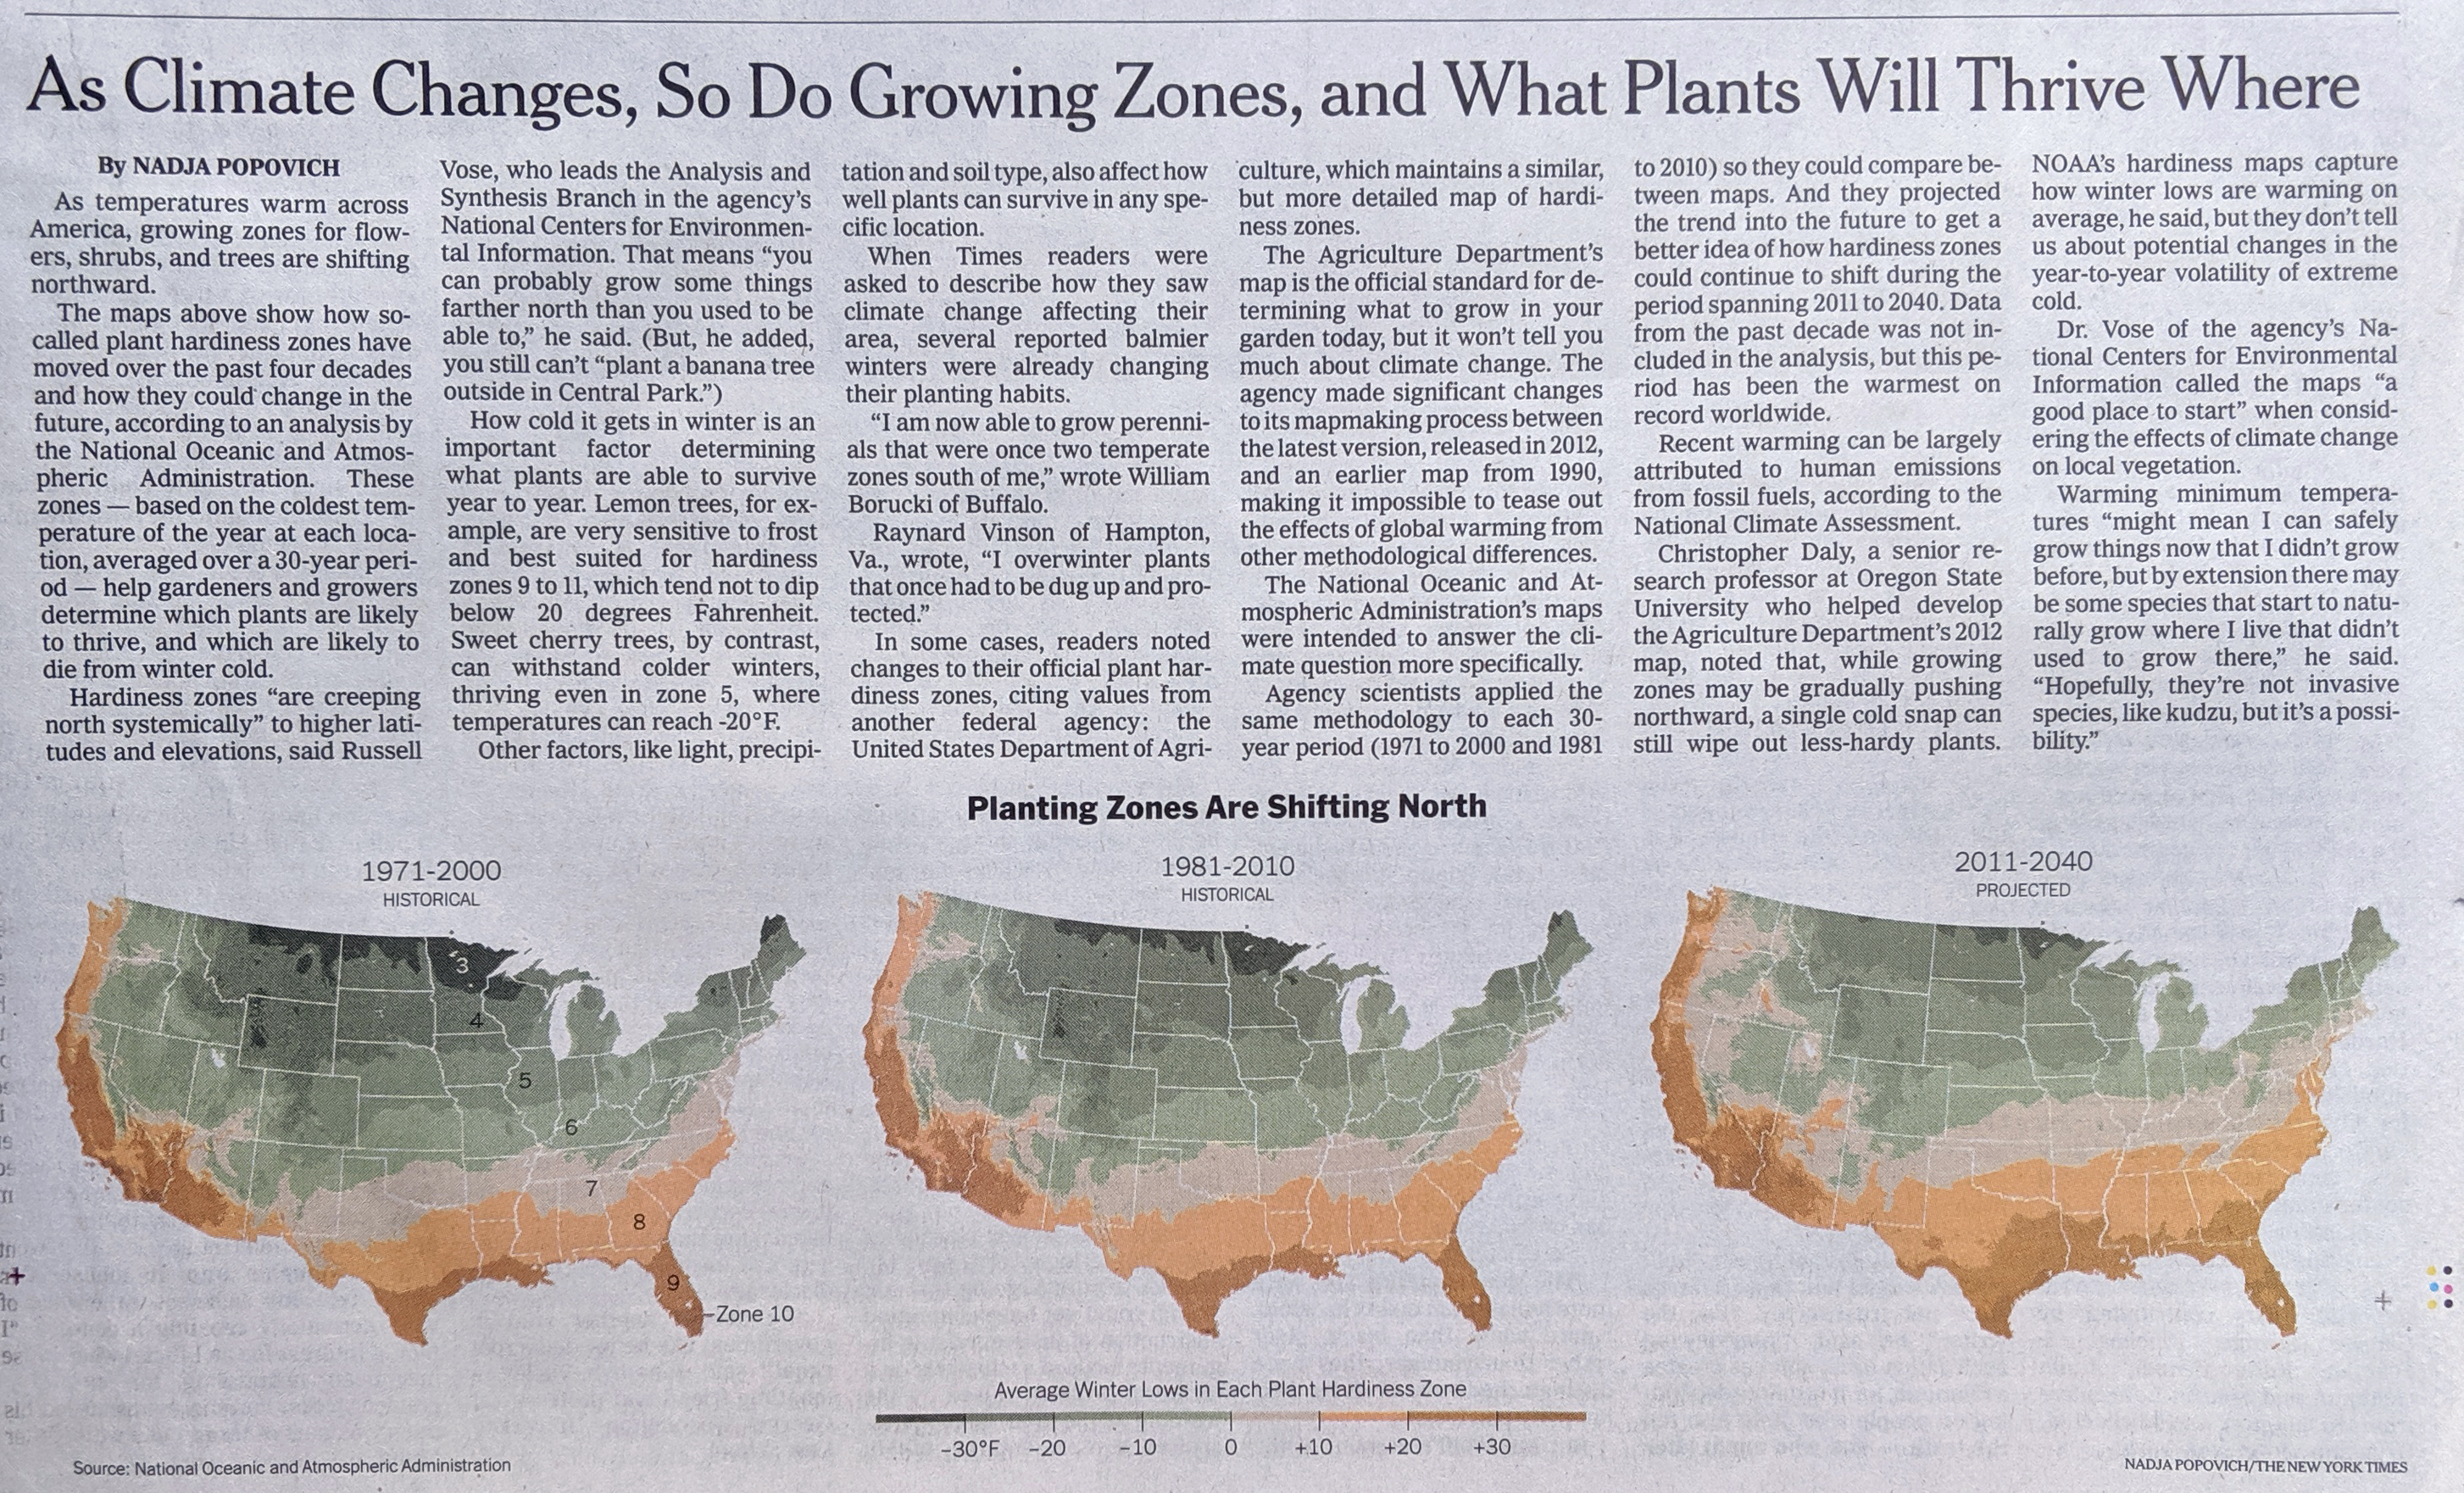
Last week I had three different discussions with people about some of the impact of climate change upon the United States. However, what did not really come up in those conversations was the environmental changes set to befall the United States. And by environment, I explicitly mean how the flora of the US will change.

Why? Well, as warmer climates spread north, that means tropical and subtropical plants can follow warmer temperatures northward into lands previously too cold. And they could replace the species native to those lands, who evolved adaptations for their particular climate.

Thankfully, last week the New York Times published a piece that explored how those impacts could be felt. Hardiness zones are a concept designed to tell gardeners when and where to plant certain crops. And while the US Department of Agriculture has a detailed version useful to horticulturists, the National Oceanic and Atmospheric Administration produces a very similar version for the purpose of climate studies. And when you group those hardiness levels by the forecast lowest temperatures in an area, you get this.

More palm trees?
More palm trees?

There you have it, the forecast change to plant zones.

From a design standpoint, I like the idea of the colour shift here. However, where it breaks seems odd. Though it could be more influenced by the underlying classifications than I understand. The split occurs at 0ºF, which is well below freezing. I wonder if the freezing point, 32ºF could have been used instead. I also wonder if adding Celsius units above the same legend could be done to make the piece more accessible to a broader audience.

Otherwise, it’s a nice use of small multiples. And from the editorial design standpoint, I like how the article’s text above the graphic makes use of a six-column layout to add some dynamic contrast to what is essentially a three-column layout for the graphics.

They're living on a grid
They’re living on a grid

Credit for the piece goes to Nadja Popovich.

Big Bulls

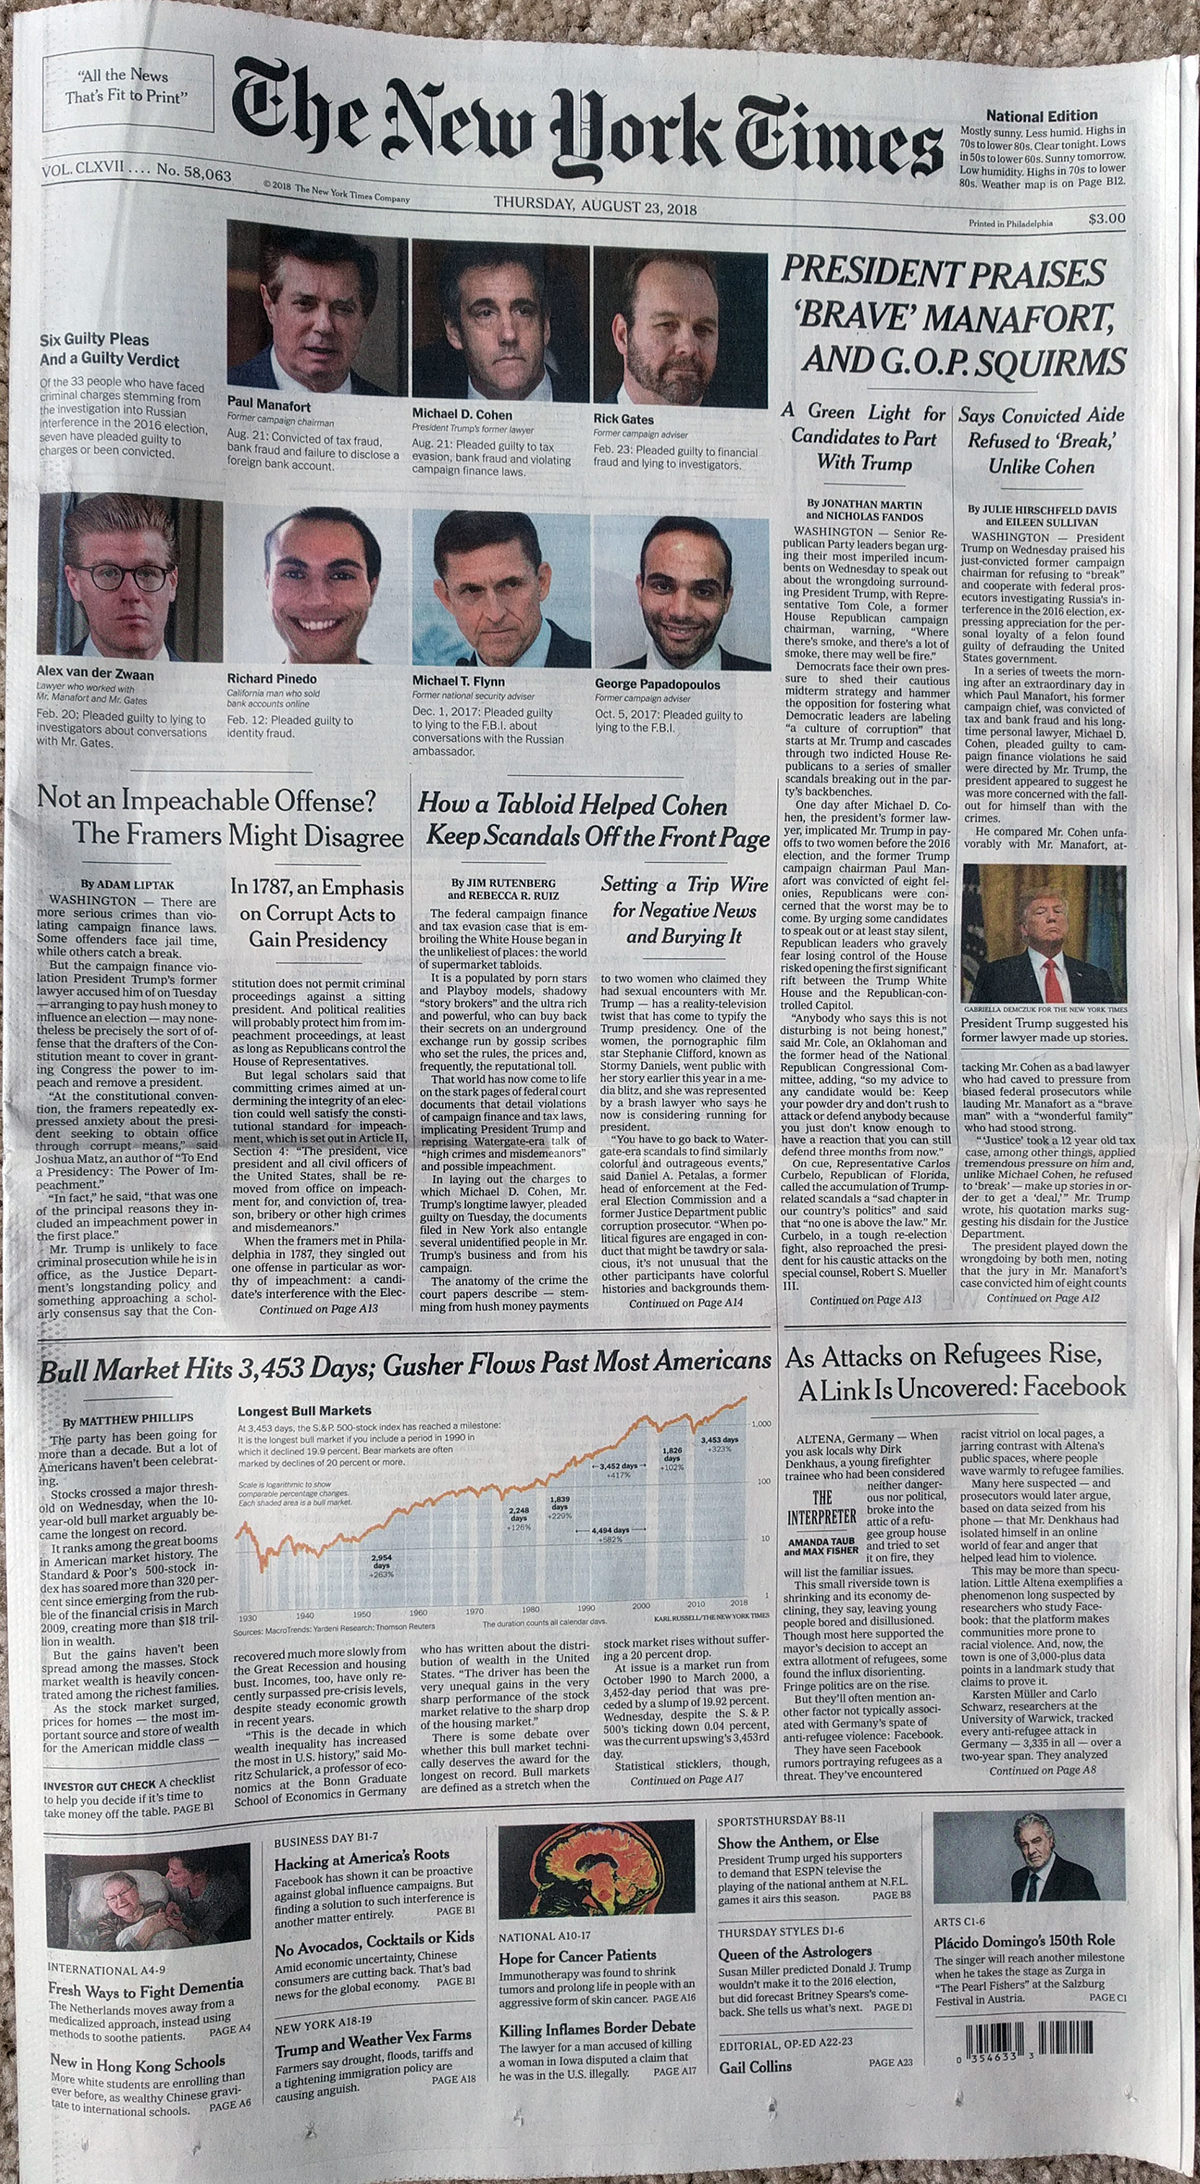
Last Thursday, the US entered its longest bull market in history. And the New York Times covered the story on the front page, which makes this another episode of covering graphics when they land on the Times’ front page. Of course, last week was a big news week away from the economy and so it is no surprise that the above-the-fold coverage was on the scandals besetting the president and those of his team who have pleaded guilty or been convicted of crimes by juries.

The front page design

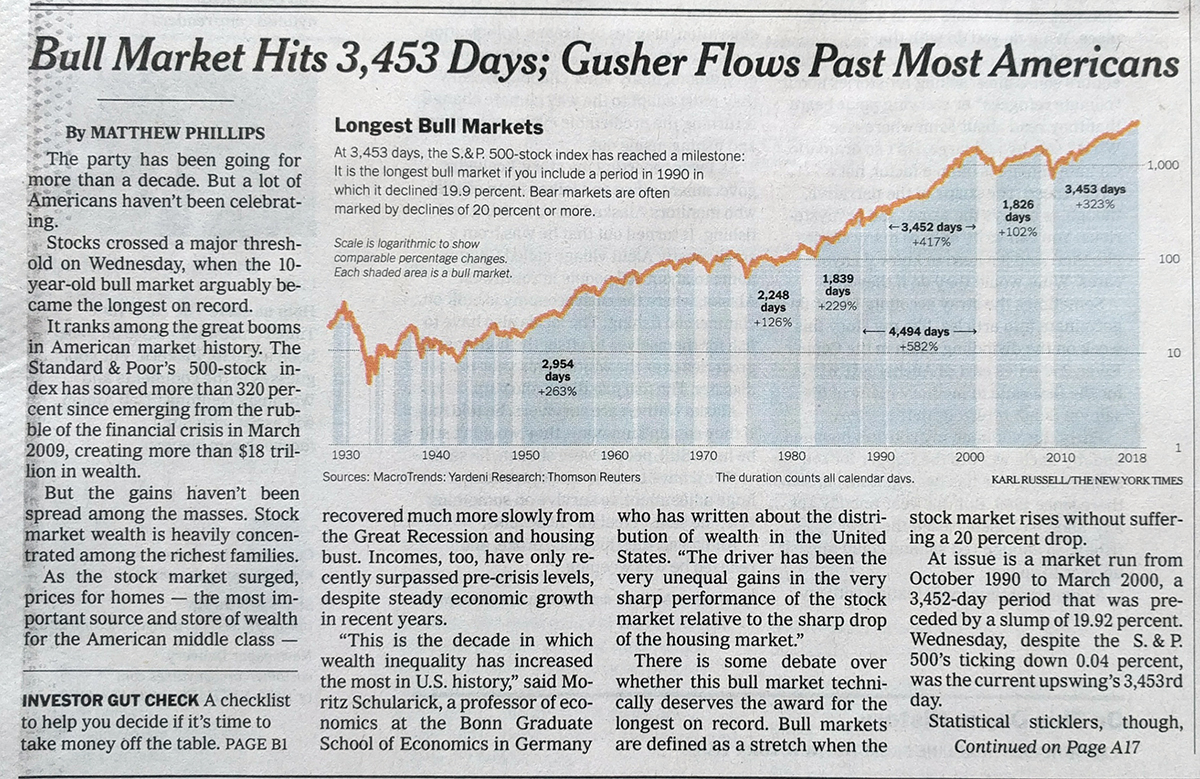
But you will note that below the fold is that nice little graphic. Here we see it in more detail.

Bull runs
Bull runs

What I like about the graphic is how it uses the blue fill to draw attention to the bull markets but then also labels how long each was. Those keen on the story will note there is a debate whether a particular 19.9% drop qualifies for the 20% drop usually used to benchmark the beginning and ending of a bull market. That is why there is that second label with the black arrows on the graphic.

It also uses the negative space created by the shape of the graphic to contain its title, text, and caption information.

Credit for the piece goes to Karl Russell.

Apple Hits One Trillion

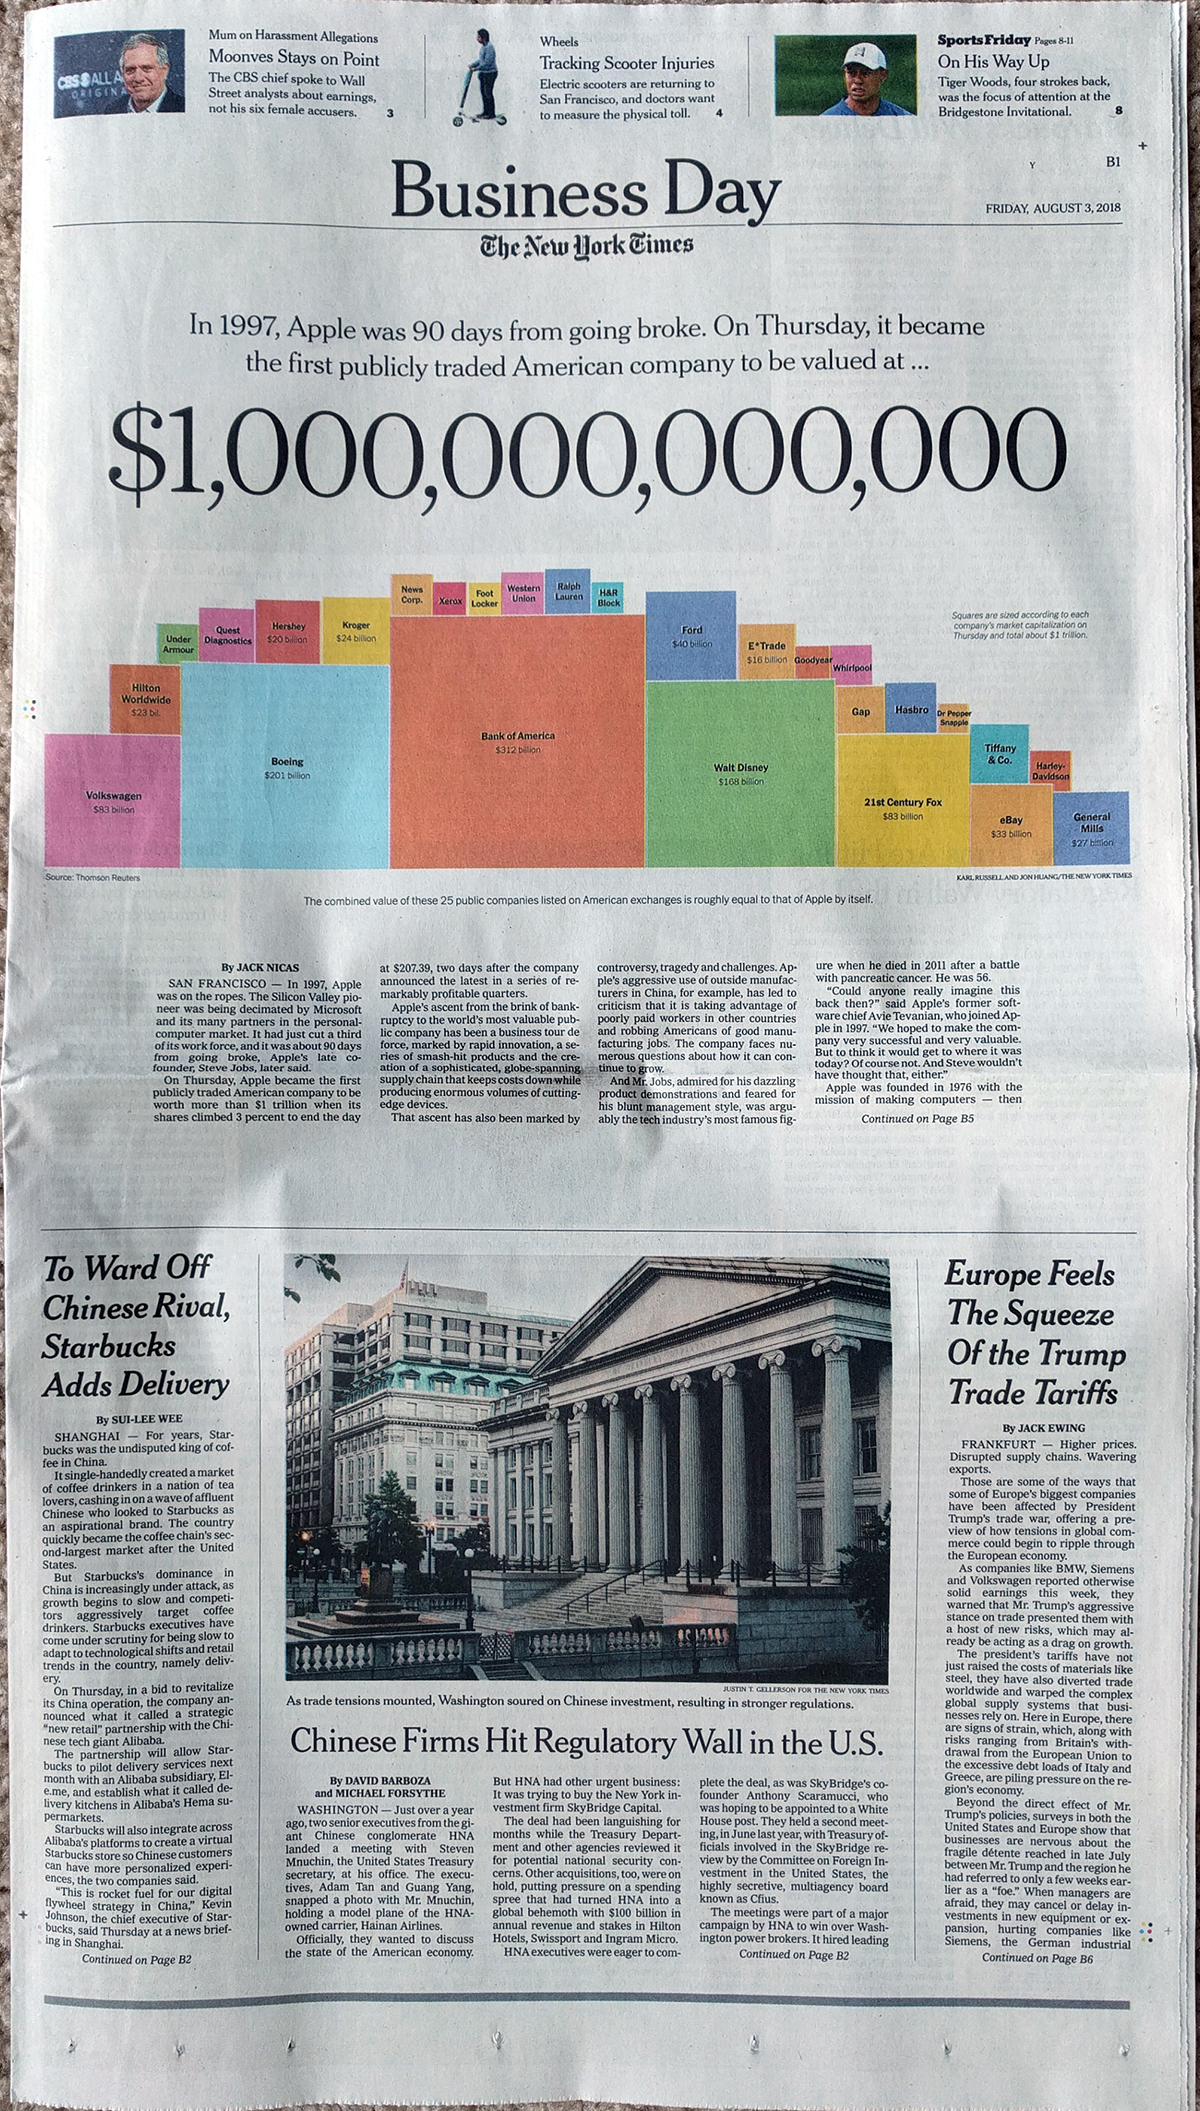
Last Tuesday we looked at a print piece from the New York Times detailing the share price plunge of Facebook after the company revealed how recent scandals and negative news impacted its financials. Well, today we have a piece from last week that shows how large Apple is after it hit a market capitalisation of one trillion US dollars.

The piece itself is not big on the data visualisation, but it functions much like the Facebook piece, as a blend of editorial design and data visualisation. The graphic falls entirely above the fold and combines a factette and maybe we could classify it as a deconstructed tree map. It uses squares where, presumably, the area equates to the company’s value. And the sum total of those squares equals that of one trillion dollars, or the value of Apple.

Looking at the full page

In terms of design it does it well. The factette is large enough to just about stretch across the width of the page and so matches the graphic below it in its array of colours. Why the colours? I believe these are purely aesthetic. After all, it is unclear to me just what Ford, Hasbro, and General Mills all have in common. In a more straight data visualisation piece, we might see colour used to classify companies by industry, by growth in share price or market share. Here, however, colour functions in the editorial space to grab the reader’s attention.

The design also makes use of white space surrounding the text, much like the Facebook piece last week, to quiet the overall space above the fold and focus the reader’s attention on the story. Note that the usual layout of stories on the page continues, but only after the fold.

When we keep in mind the function of the piece, i.e. it is not a straight-up-explore-the-data type of piece, we can appreciate how well it functions. All in all this was a really nice treat last Friday morning.

Credit for the piece goes to Karl Russell and Jon Huang.

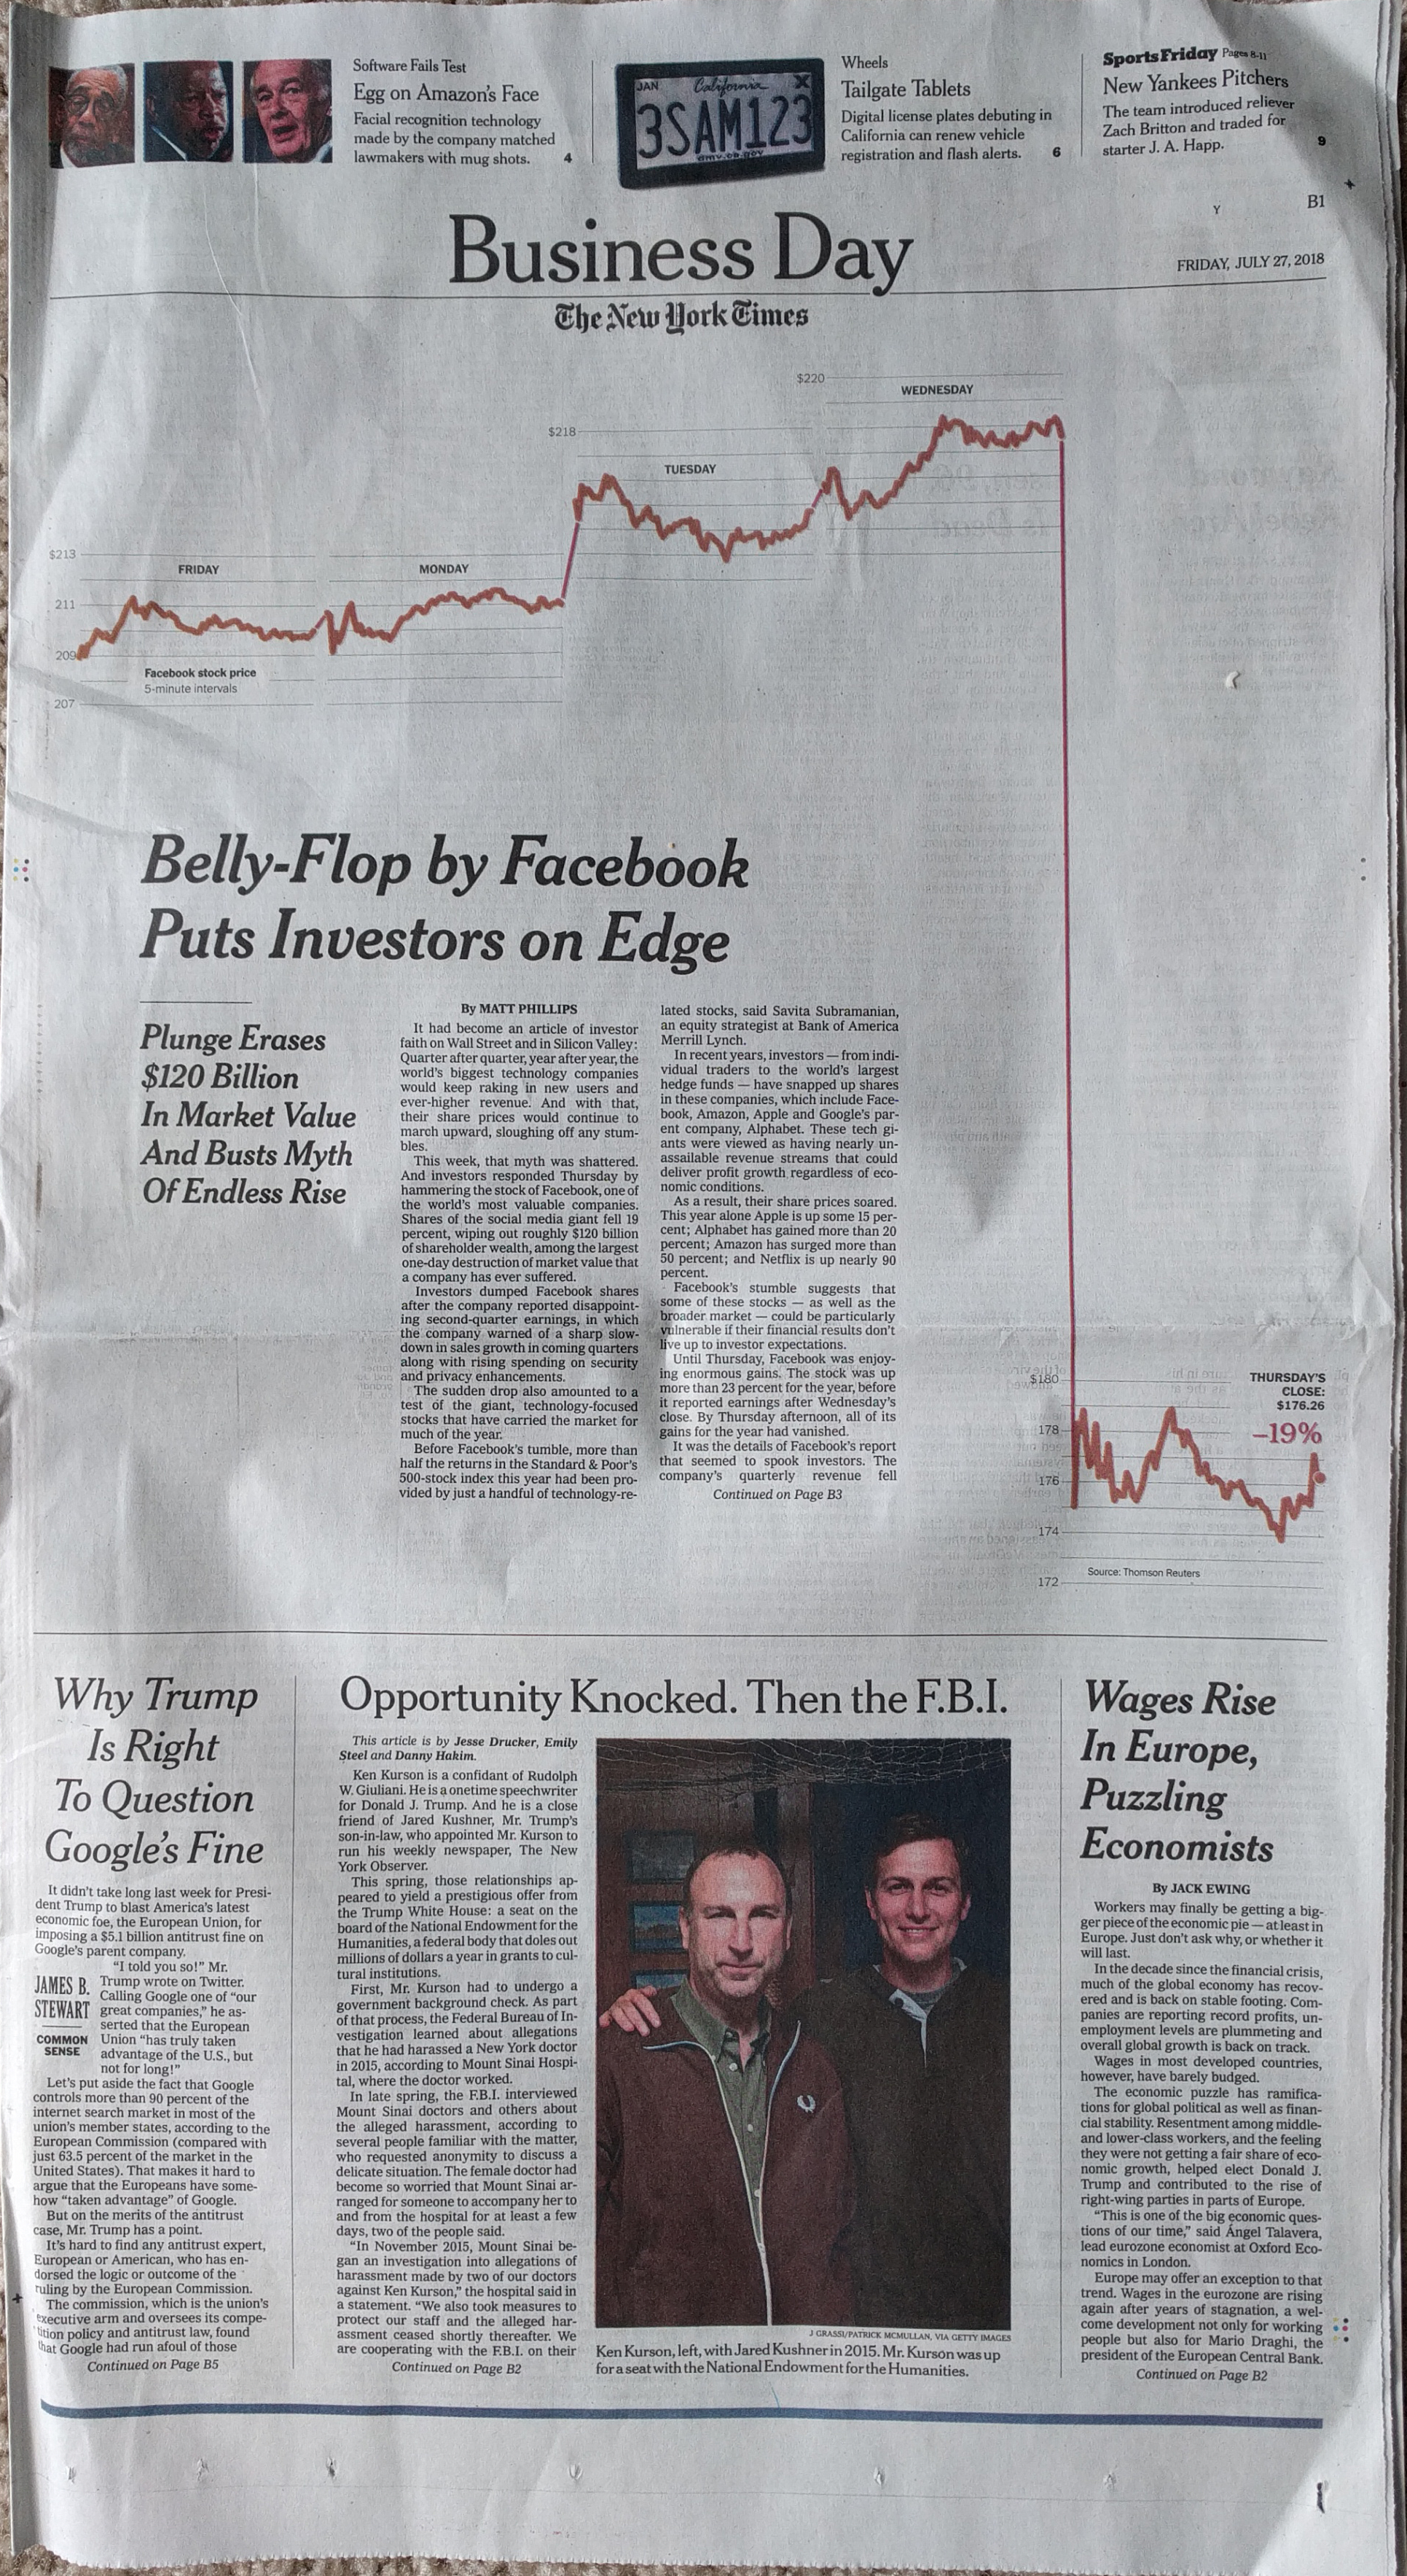
Facebook’s Share Price Plunge

Last Thursday, Facebook’s share price plunged on the news of some not so great numbers from the company on its quarterly earnings report. The data and number itself is not terribly surprising—it is a line chart. But what I loved is how the New York Times handled this on the front of the Business section on Friday morning.

The overall page
The overall page

I found the layout of the page and that article striking. In particular, each day of the share price is almost self-contained in that the axis lines start and stop for each day. I question the thickness of the stroke as something a little thinner might have been a bit clearer on the data. However, it might also have not been strong enough to carry the attention at the top of the page. As it is, that attention is needed to draw the reader down the page and then down across the fold.

Additionally, the designers were sensitive to the need to draw that attention down the page. In order to do that they kept the white space around the graphic and kept the text to two small blocks before moving on to the interior of the section.

Credit for the story goes to Matthew Philips. Although I’m pretty sure the page layout goes to somebody else.

Where Syria Struck with Chemical Weapons

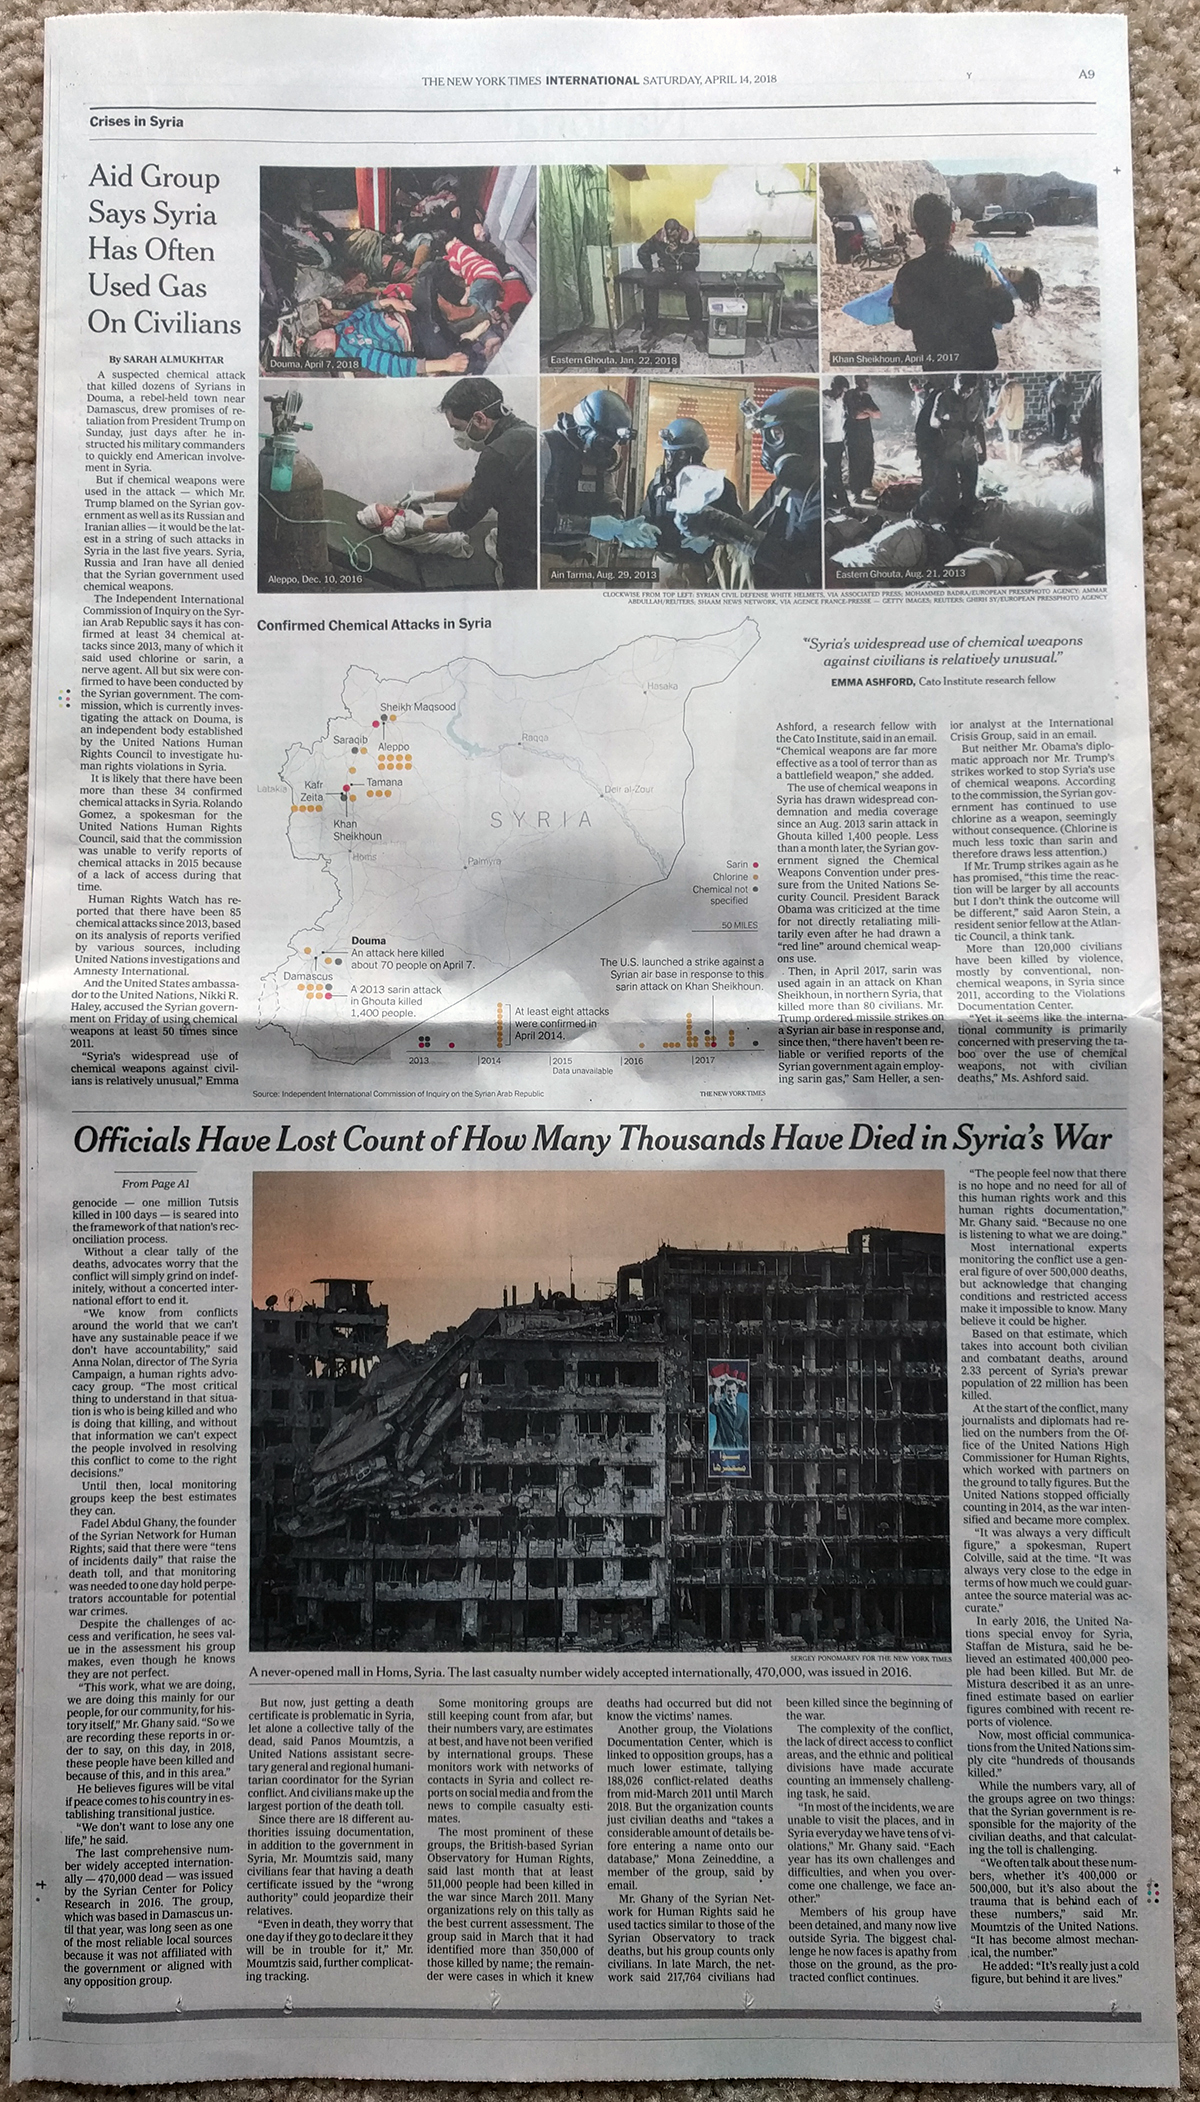
Friday night the US, UK, and France struck targets in Syria that play a role in the chemical weapons programme of the Bashir al-Assad regime. This is despite “eliminating” his chemical weapons several years ago. And so not surprisingly the media this past weekend covered Syria and the airstrikes. This print piece from the New York Times, however, looked backwards at the history of the chemical attacks Syria has unleashed against its own people.

Note the timeline in the lower-right to provide context of when and how frequent the chemical attacks have been

The map is straightforward and the timeline helpful. Though I would probably have added a point on the timeline highlighting the Ghouta attack of August 2013. That attack prompted the international community to pressure the Assad regime to, again, “eliminate” its chemical weapon stocks. Clearly it hid some sarin and chlorine gas has industrial uses, making it a classic dual-purpose object that is tricky to classify as a weapon. (Though using it against civilians is clearly a weaponised use of the element.)

On a side note, I wanted to point the editorial design here. The overall page is quite nice.

The whole article is well laid out

The map falls squarely within the middle of the article, with a nice gallery of photographs running along the top. It also features a devastating pull quote describing the Syrian government’s use of chemical weapons. The article fits almost entirely above not just the fold, but also another terrible line of text, in this case the title of another article: Officials Have Lost Count of How Many Thousands Have Died in Syria’s War.

Overall, this was a solid piece providing a backdrop and historical context for the news.

Credit for the piece goes to the New York Times graphics department.

Tech Economies in the USA

Earlier this March the Washington Post published a piece looking at the twenty finalist contenders for the second Amazon headquarters. Specifically it explored how the cities rank in metrics that speak to a city’s technology and innovation economy.

That in and of itself, while incredibly fascinating, is not noteworthy in and of itself. Though I will say the article’s online title is neatly presented, split half-and-half with the vertical graphic showing the cities ranked.

I really like how this title space received a special design.

But the point that was really neat was the interactivity that followed. Here you can see a dropdown from which the user selects a city of interest—surprise, surprise we are looking at Philadelphia. From that point on, the piece keeps the selected city highlighted in every graphic that follows.

Looking at Philly
Looking at Philly

Again, that is nothing truly surprising, but it is neat to see. What would have taken it to the next step is if each of those associated paragraphs were tailored to the specific city. Instead, they appear to be general paragraphs.

But overall, it does a really nice job of comparing the twenty cities—it’s actually fewer because both Washington and New York have multiple sites per metro area—across the different metrics.

The only part that left me scratching my head a bit was the colour choice. I am not certain that it needs the blue-green to yellow-green palette. Those colours seem defined by a city’s placement on the overall list and I am not convinced that the piece would not have still worked if they had been only a single colour, using another colour to define the selected city.

Credit for the piece goes to Darla Cameron and Jonathan O’Connell.

The Wall Today

This past Sunday I had a nice treat in the New York Times. They printed a piece looking at the state of the US-Mexican border wall as it is today. And not only was it an article, but it was a full-page article.

The Wall today
The Wall today

There isn’t a lot to say about it in particular. But what I really did like was the decision by the designer to tilt the map at an angle. Normally we would see a straight east-to-west, right-to-left map, but here the axis is more southeast-to-northwest, right-to-left map. And that creates a nice space for text in the lower left area, which the designer here did in fact use for the main block of text.

Credit for the piece goes to Sarah Almukhtar.