
Normally I am not a fan of stacked bar charts. They do not allow users to easily compare the constituent elements of the stack. In spending a number of years working with economists I became familiar with decomposition charts, which help audiences understand what things contribute positively or negatively to, say, economic growth. But the charts fail to help users track those individual changes over time or directly compare the magnitude of the individual contributors. And if the story is so and so contributed more than such and such, that chart is not the optimal solution. My advice then would be to break it up and show each contributor against the other.
And so initially when I woke up yesterday and saw this chart in my inbox, I initially thought, brilliant, somebody put together a nice bar chart. Single colour, each object against each other. Now, my use pattern is to quickly scan the e-mail and see what in the digest strikes my particular fancy. And at this point I was not trying to read the chart, I just flagged it for me to come back to later for an actual read.
And then I read it.
A large number of you are international readers, primarily from the Anglosphere—shocking for a blog written in English. But the majority is American. And for my American readers, the key context here is that the Canadian province of Alberta voted on independence yesterday. The Albertan separatist question is similar to the Brexit question, which is probably more familiar to my audience. The province of Alberta, Canada for years now has been debating the question of whether they should secede from Canada and go their own way as an independent country.
No, they obviously should not, but that is not the point here. Polling suggested and the voters voted against the concept. But, take yourselves back to the world 10 years ago and back then, all you ever heard about in some circles was Brexit. Should the UK exit the European Union. For years that was the discourse. Back in today, the question is will Alberta’s separatist movement be a flash in the pan discourse, resolved after this week?
This chart said no, not it will not.
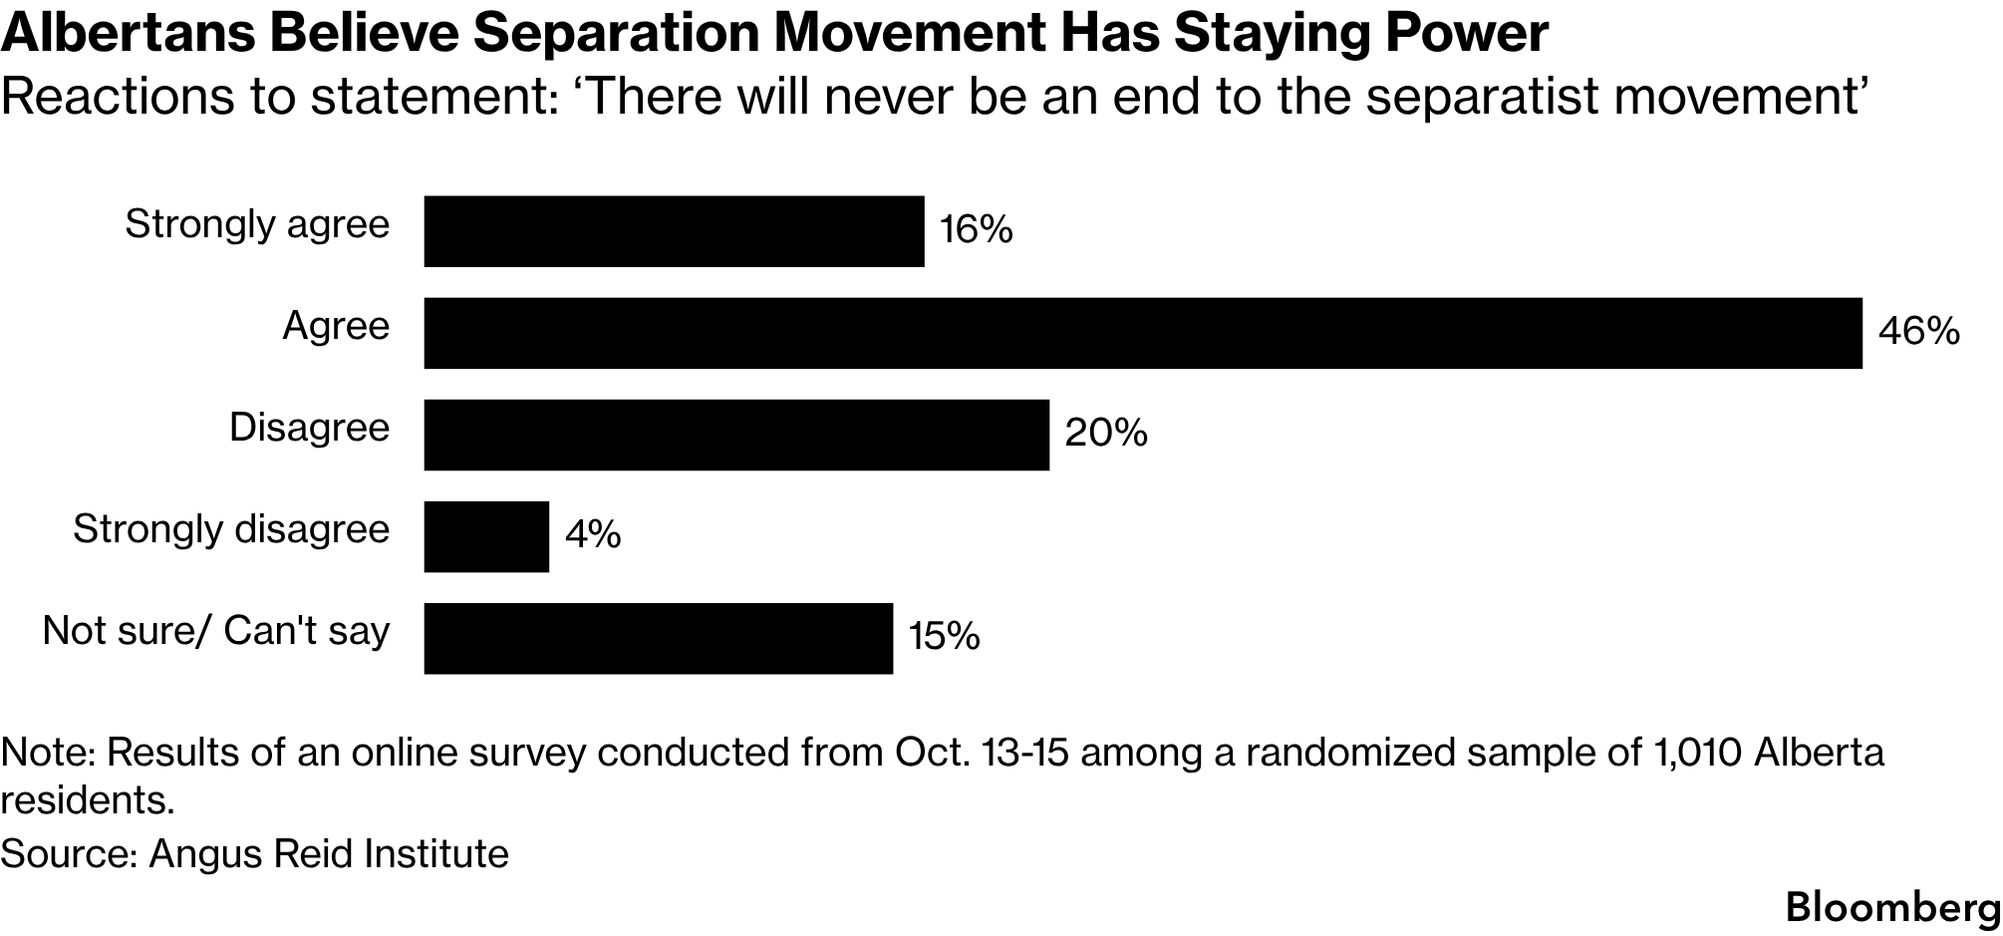
But that was when I really looked at the chart beyond a piece of visual content meant to grab my attention.
Now, the obvious things here stand. There is no axis. There is redundant labelling. The thing is kind of a mess. But I want to take this from a higher level. Why the unstacked bar chart? And why do I not care for it in this instance?
This is a survey result. And whilst I did spend a number of years working with economists, I have also spent a number of years—probably more years—working with survey researchers and analysts. Working with them you learn sometimes the important thing is not the individual responses, but the aggregate.
Here the aggregate is basically, agree or disagree with the question. And this particular chart forces users to transpose bars and mentally rearrange them to sort out who is “over the hump” of the 50% threshold. That is not ideal.
In this case, a stacked bar chart would be a better chart type for the data and the story. So I took some time to put one together so you can compare the two options.
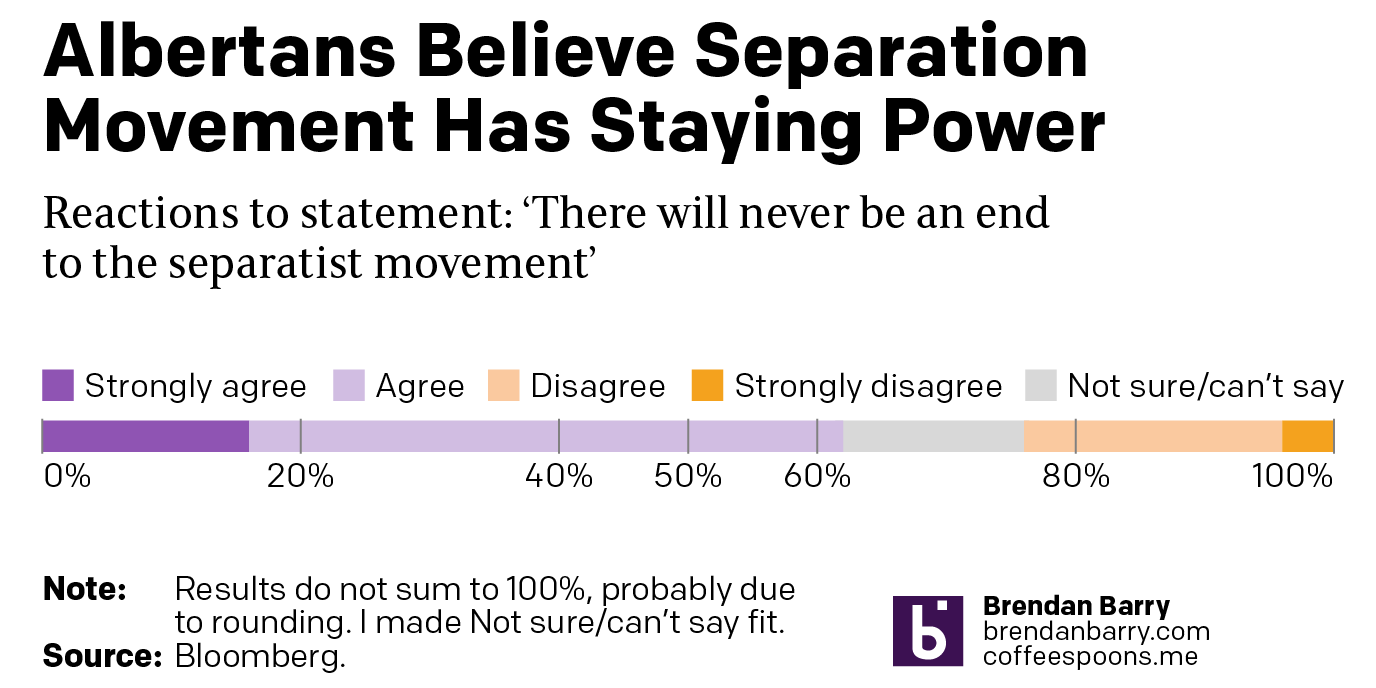
I used my own personal branding, because in charts like this using a single colour would not work. But in this example you can more clearly see how the agree camp—those saying that Albertan separatism will linger like Brexit did in the UK—dominates those believing otherwise.
In my head I do not need to add percentages—the failure to include an axis—and I do not need to mentally move bars around the page or the screen—the failure of the standard bar chart.
To be fair, I did not have the actual survey results, so I could only use the numbers in the original graphic. Therefore, the numbers do not sum to 100% and my chart is not wholly accurate to the original. In order to make mine work, I made the Not Sure/can’t say data fit between the Agree and Disagree sides. In reality the actual numbers would all be used and the percentages would be representations of those and things would fit properly. My graphic nonetheless shows how things should work conceptually.
Credit for the original goes to the Bloomberg graphics department.
Credit for the reworked version is mine.