Beer, Whiskey, and Wine, Oh My

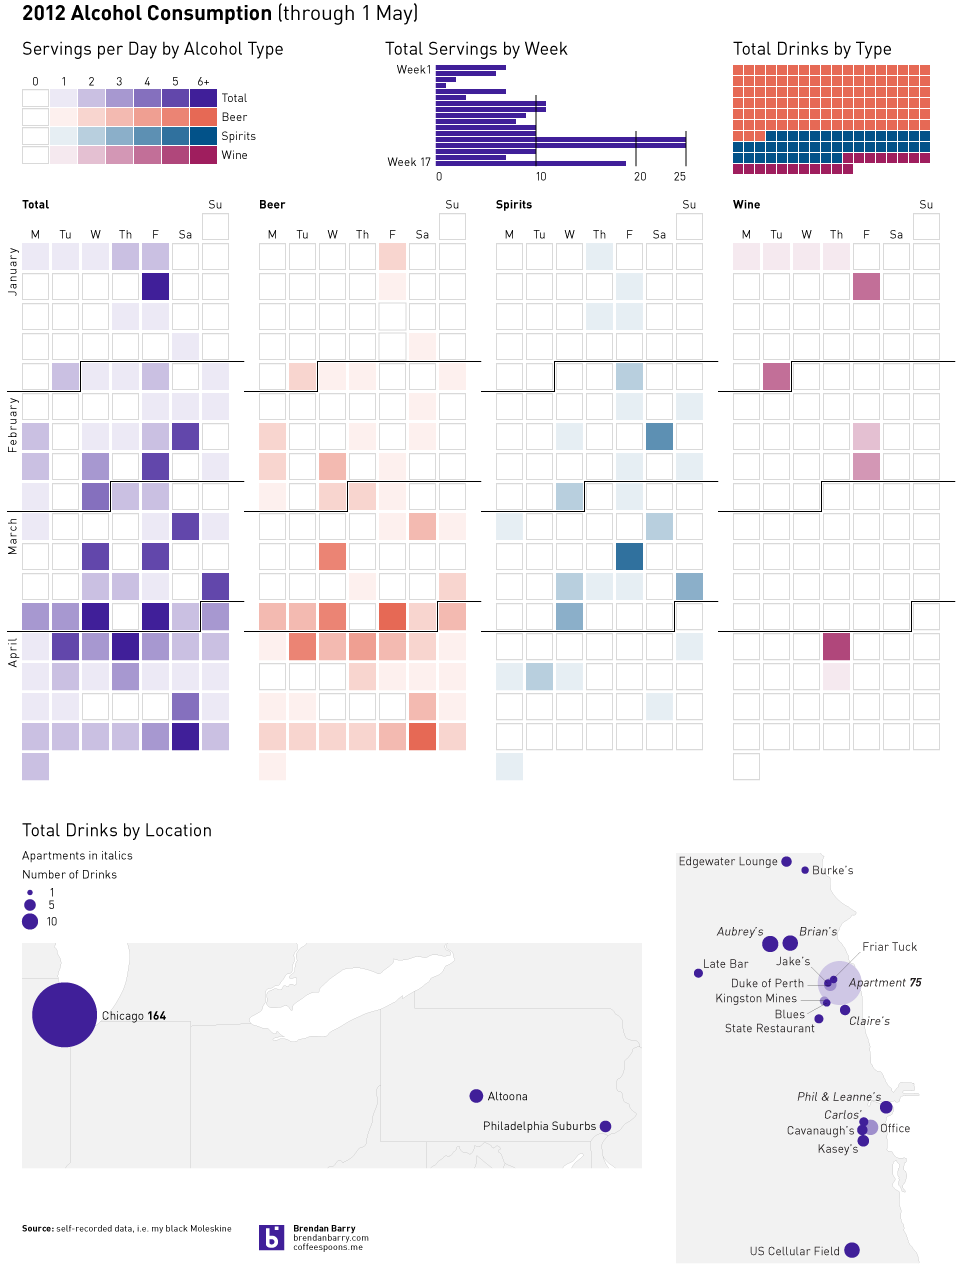
Last month I visualised my tea consumption data. But the other dataset that I record along with the tea is that of alcohol: when, where, and what I consume. The following is the result of four months of data, but you have to click for the full-scale view.
Click for full-scale view
My 2012 alcohol consumption, through 1 May. Click for full-scale view

Author: Brendan Barry

I am a graphic designer who focuses on information design. Most recently I worked for the Economic Research Department of the Federal Reserve Bank of Philadelphia and prior to that I was Head of Design at Euromonitor International with my design team split between Chicago and London.

5 thoughts on “Beer, Whiskey, and Wine, Oh My”

  1. You are so thorough! How do you do it? Mine would be just several dots. I’d like to chart my paucity of sexual experiences, although it would probably be represented by a simple flat line!

  2. John, I actually write down all the drinks I imbibe—be them tea or alcohol—in a little notebook. Naturally with the alcohol there is the opportunity to miss a few, but generally I’m pretty good at recording them. The idea is always to be able to do an end-of-year annual report on my life. But that takes quite a lot of work, so these are more like little steps in the process.

Leave a Reply