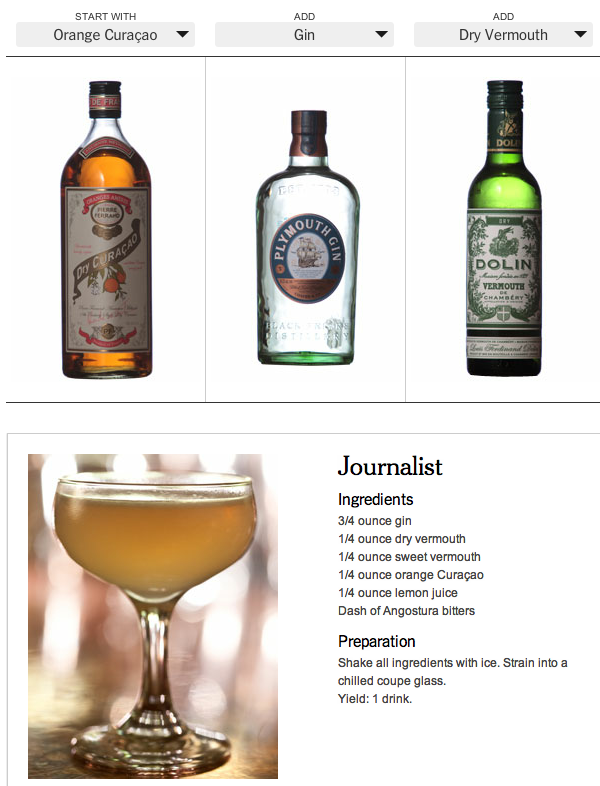
Infographics and interactive pieces need not always be about data. Sometimes they can help you find things far more practical than levels of Canadian defence spending or changing demographics. Sometimes they can help you find new summer cocktail recipes. Like this piece from the New York Times.

And if you’re me, you can add the experiments to your running tally of drinks as new data points.
Credit for the piece goes to Jacky Myint, Emily Weinstein, Des Shoe, and Tony Cenicola.
Leave a Reply
You must be logged in to post a comment.