From Frying Pan to the Fires of a War Zone

Moving away from climate change now, we turn to the lovely land of Afghanistan. While the Trump administration continues to negotiate with the Taliban in hopes of ending the war, the war continues to go worse for Afghanistan, its government, and its allies, including the United States.

It is true that US and NATO ally deaths are down since the withdraw of combat troops in 2014. But, violence and sheer deaths are significantly up. And as this article from the Economist points out, the deaths in Afghanistan are now worse than they are in Syria.

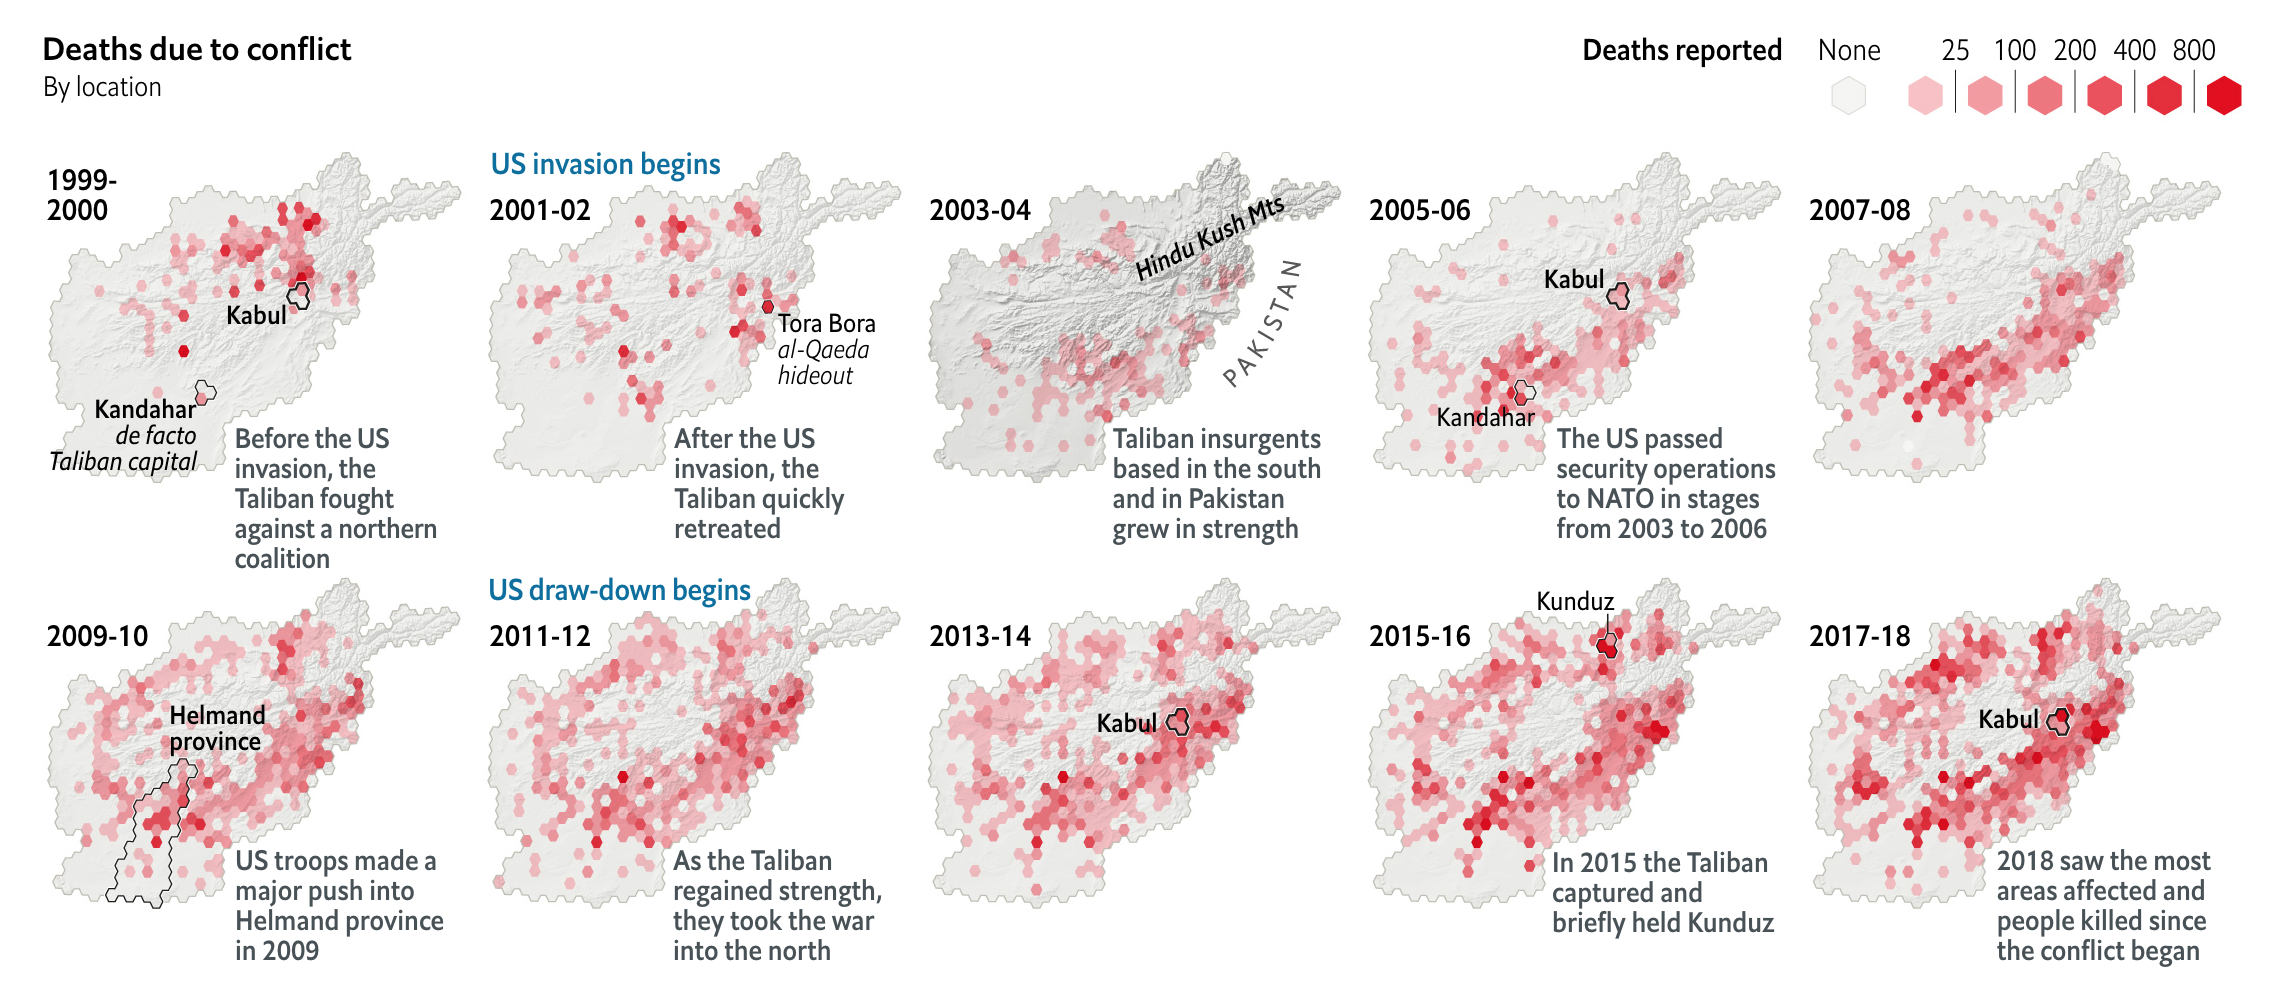
The beginning of the article uses a timeline to chart the history of Afghan conflicts as well as the GDP and number of deaths. And it is a fascinating chart in its own right. But I wanted to share this, a small multiples featuring graphic looking at the geographic spread of deaths throughout the country.
Getting hotter (because red obviously means heat)

It does a nice job by chunking Afghanistan into discrete areas shaped as hexagons and bins deaths into those areas. All the while, the shape remains roughly that of Afghanistan with the Hindu Kush mountain range in particular overlaid. (Though, I am not sure why it is made darker in the 2003–04 map.)

To highlight particular cities or areas, hexagons are outlined to draw attention to the population centres of interest. But overall, the rise in violence and deaths is clear and unmistakable. And it has spread from what was once pockets in the south to the whole of the country that isn’t mountains or deserts.

Tamerlane would be proud.

Credit for the piece goes to the Economist graphics department.

Hotter Muggier Faster

Last week we looked at a few posts that showed the future impact of climate change at both a global and US-level scale. In the midst of last week and those articles, the Washington Post looked backwards at the past century or so to identify how quickly the US has changed. Spoiler: some places are already significantly warmer than they have been. Spoiler two: the Northeast is one such place.

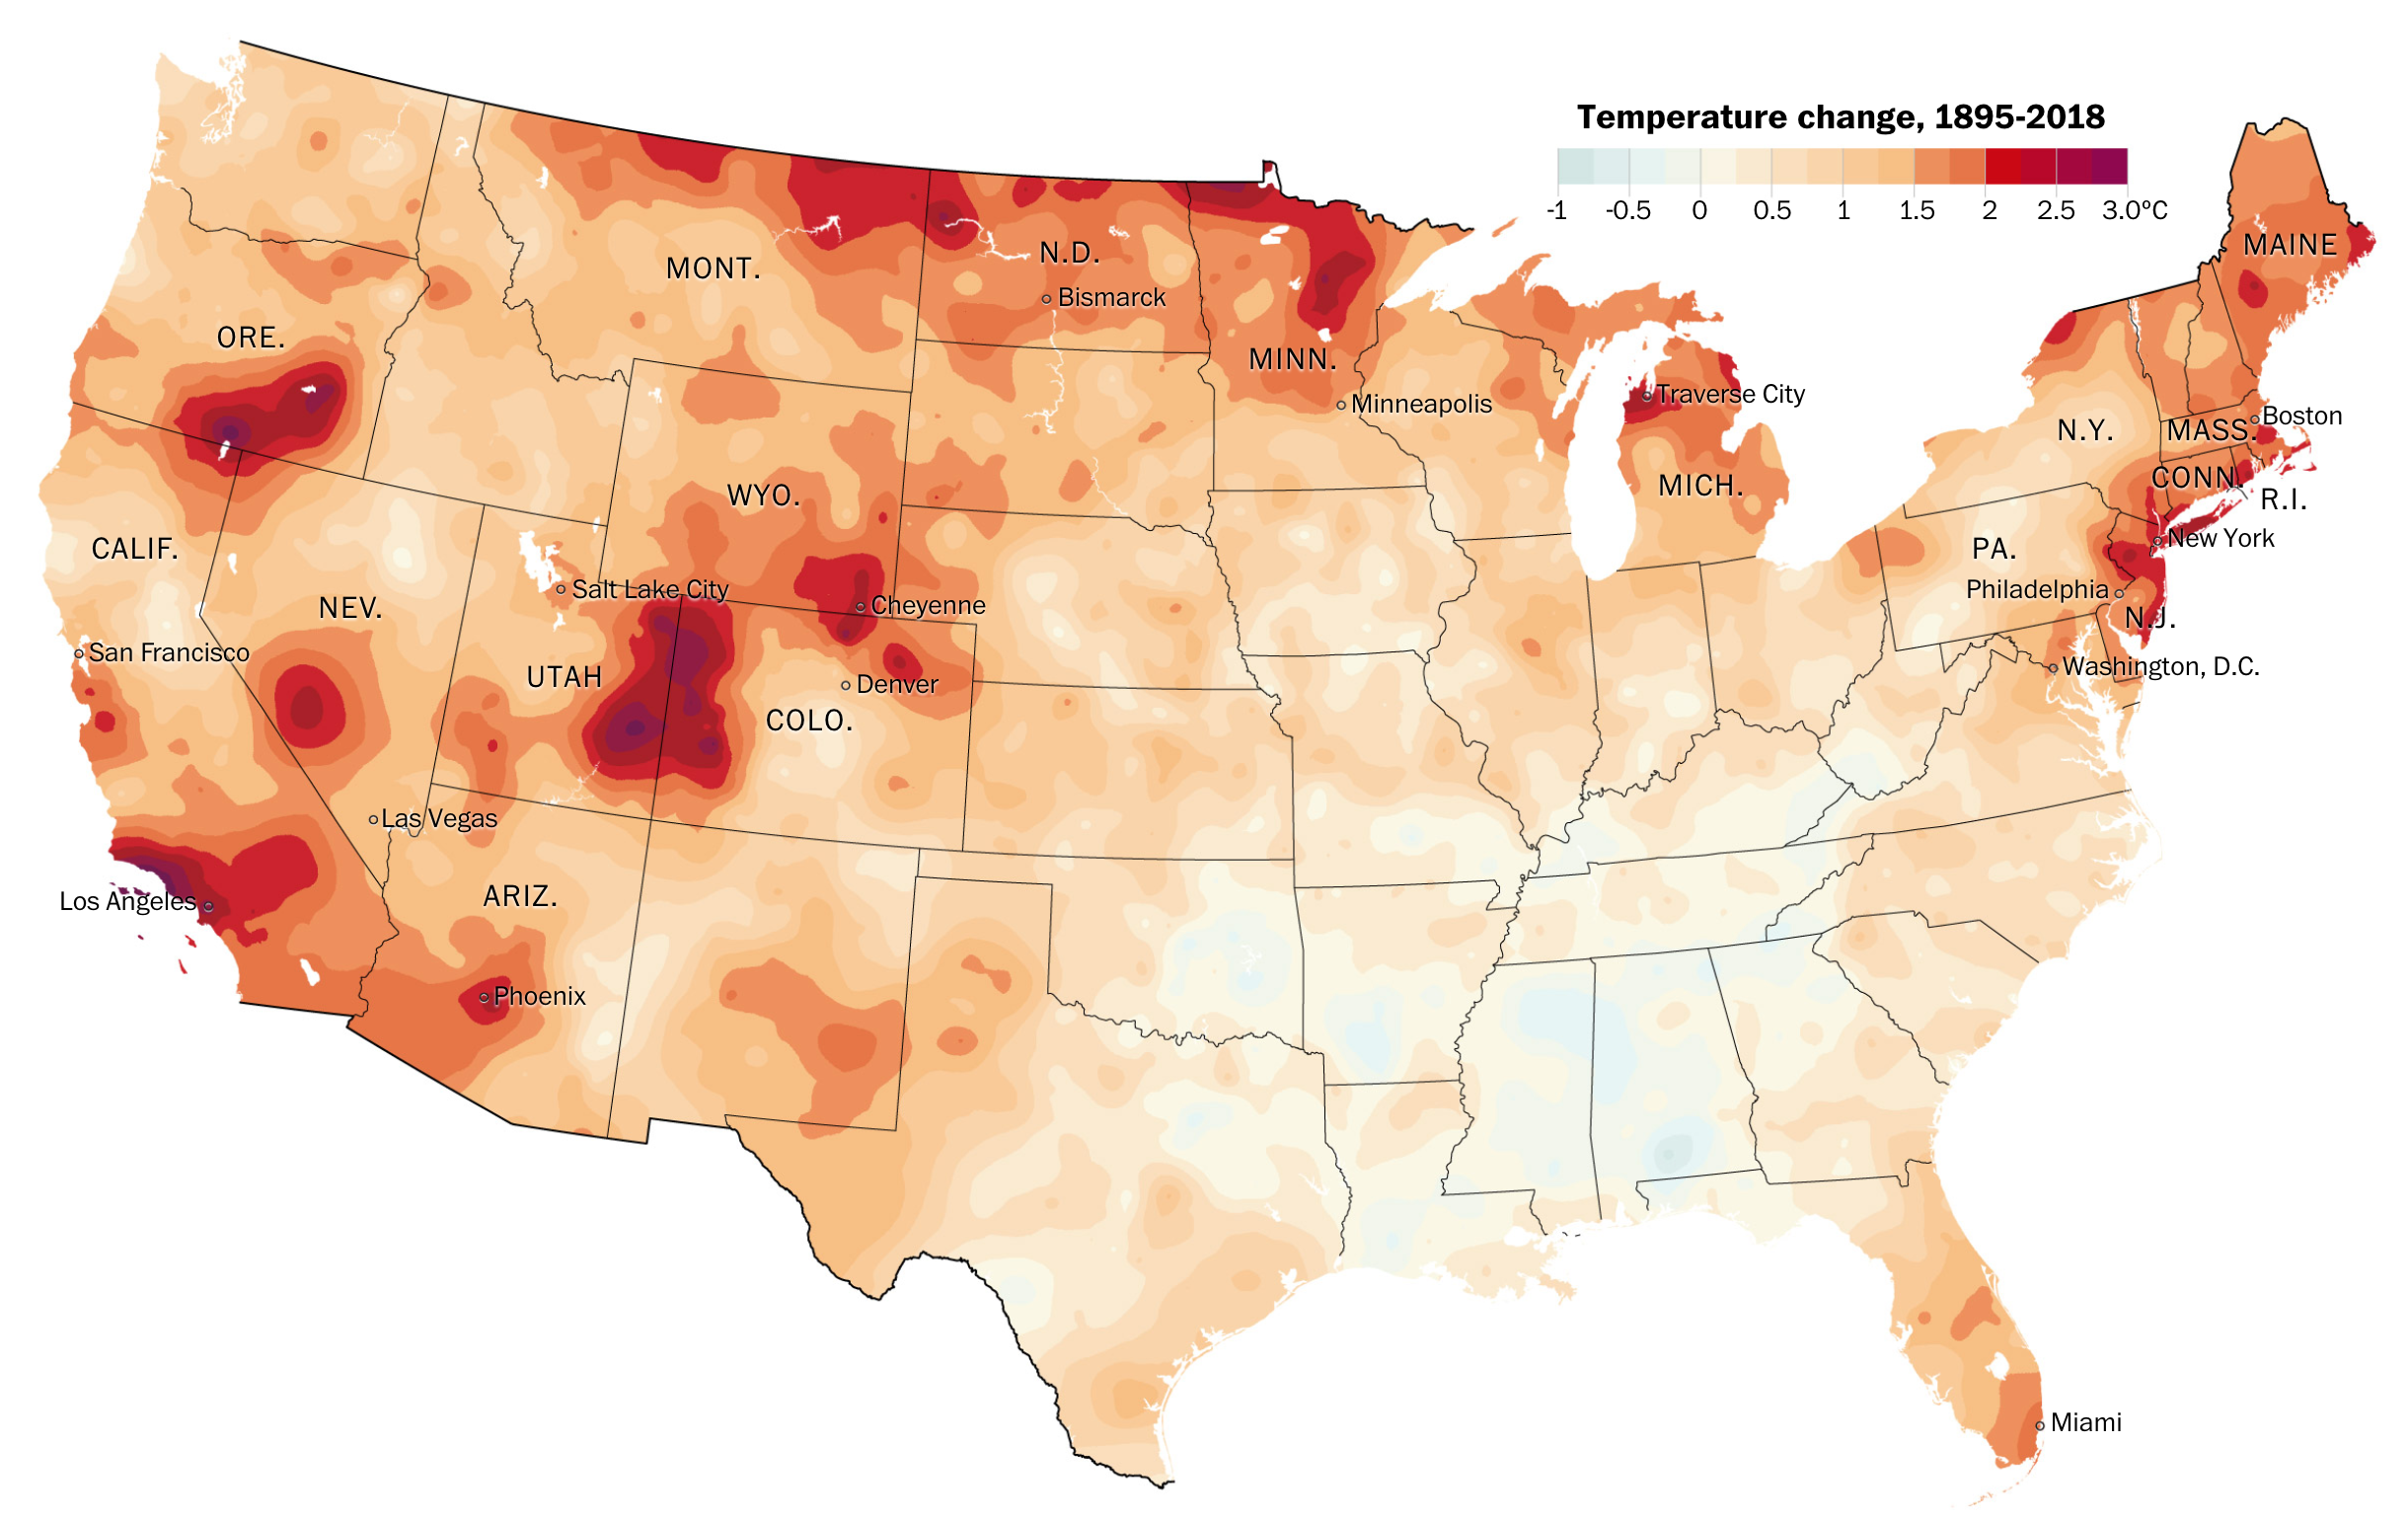
The piece is a larger and more narrative article using examples and anecdotes to make its point. But it does contain several key graphics. The first is a big map that shows how temperature has changed since 1895.

The Southeast is an anomaly, but its warming has accelerated since the 1960s

The map does what it has to and is nothing particularly fancy or groundbreaking—see what I did there?—in design. But it is clear and communicates effectively the dramatic shifts in particular regions.

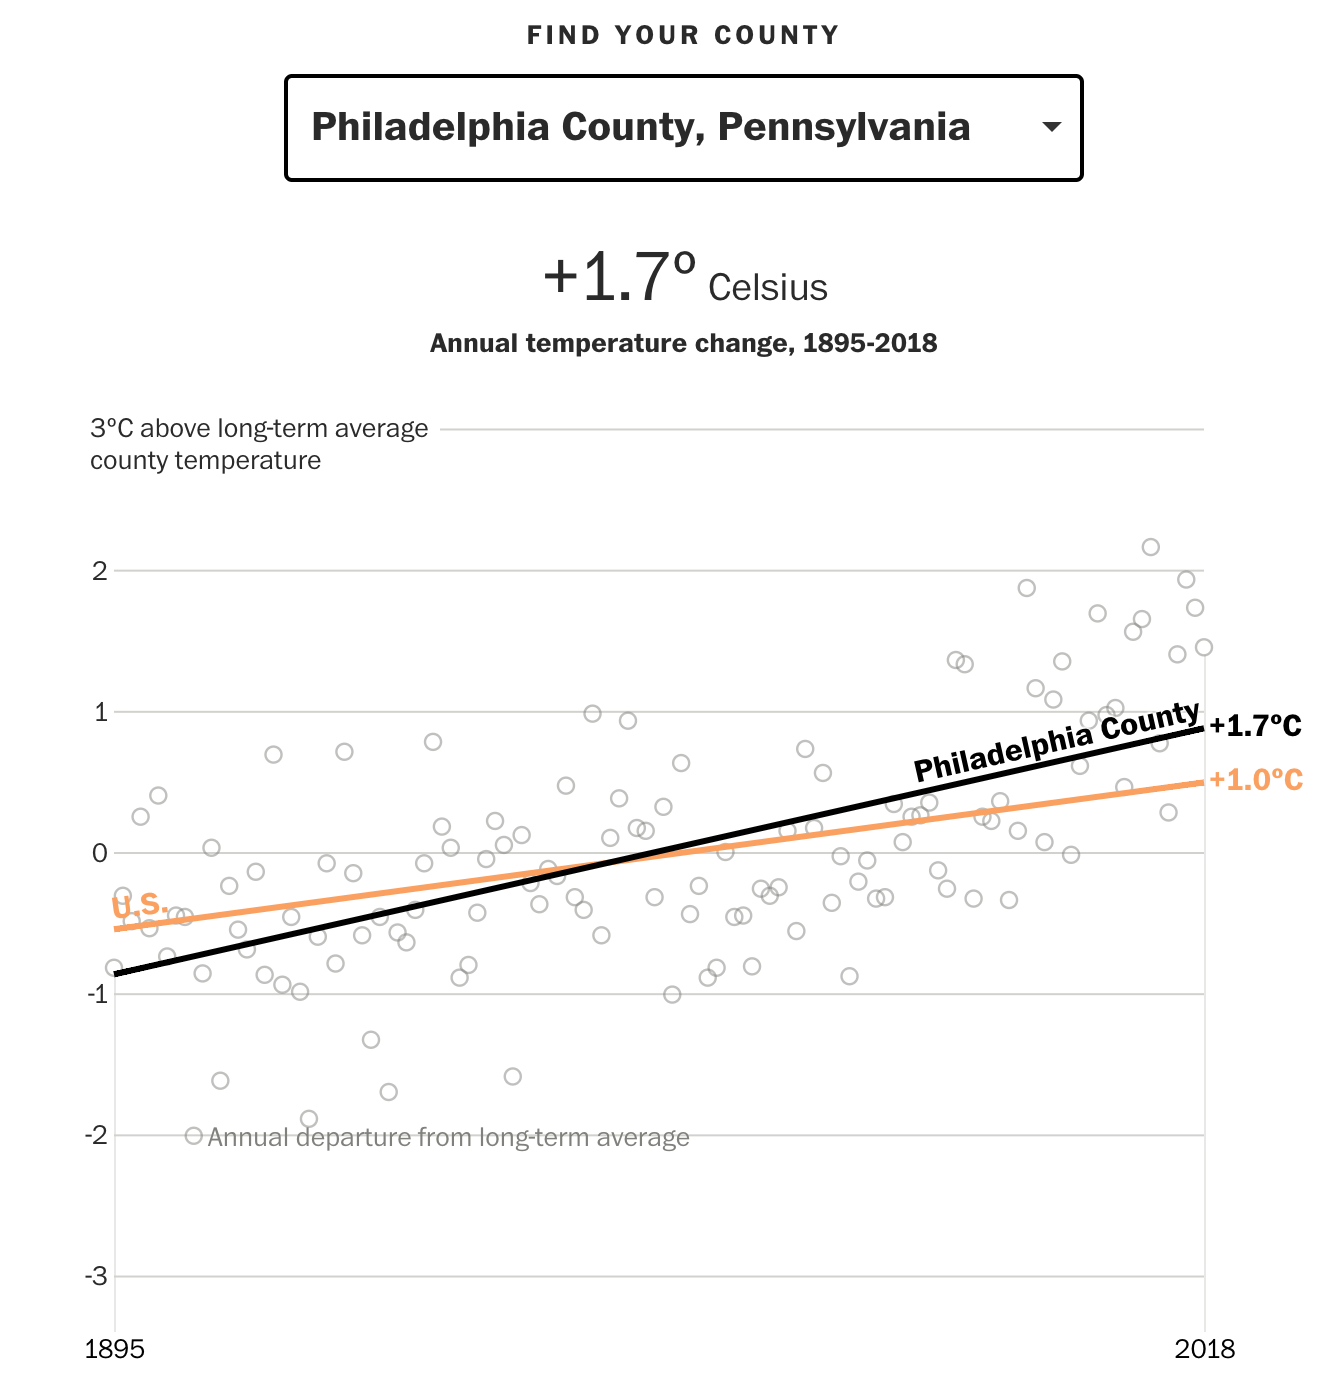
The more interesting part, along with what we looked at last week, is the ability to choose a particular county and see how it has trended since 1895 and compare that to the baseline, US-level average. Naturally, some counties have been warming faster, others slower. Philadelphia County, the entirety of the city, has warmed more than the US average, but thankfully less than the Northeast average as the article points out.

This ain't so good
This ain’t so good

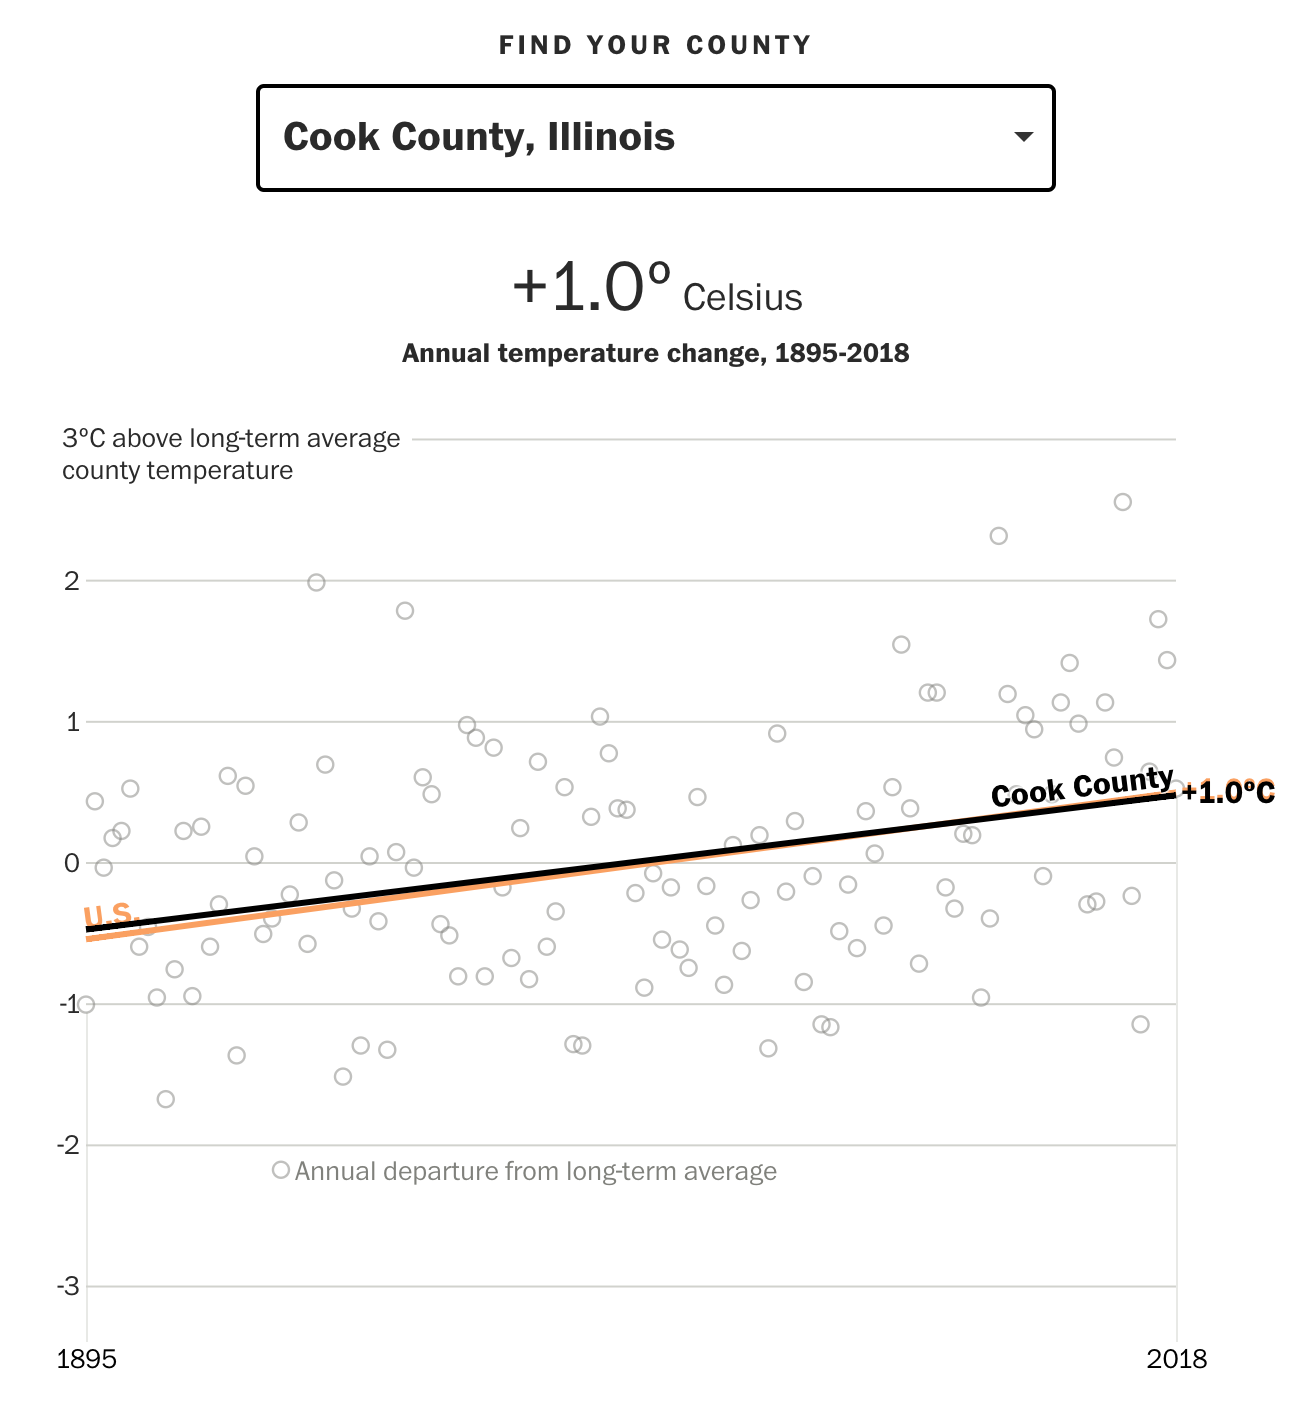
But, not to leave out Chicago as I did last week, Cook County, Illinois is right on line with the US average.

Nor is this, but it's average
Nor is this, but it’s average

But the big cities on the West Coast look very unattractive.

Tinseltown is out of the question

The interactive piece does a nice job clearly focusing the user’s attention on the long run average through the coloured lines instead of focusing attention on the yearly deviations, which can vary significantly from year to year.

And for those Americans who are not familiar with Celsius, one degree Celsius equals approximately 1.8º Fahrenheit.

Overall this is a solid piece that continues to show just what future generations are going to have to fix.

Credit for the piece goes to Steven Mufson, Chris Mooney, Juliet Eilperin, John Muyskens, and Salwan Georges.

It’s like M*A*S*H That Way

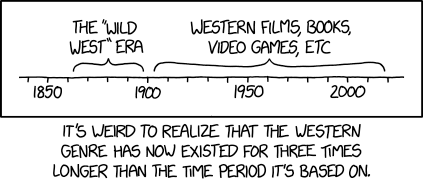
Happy Friday, all. Welcome to the end of the week. Today is just a little post from xkcd looking at the time span of the Wild West compared to the genre of the Wild West. The genre has lasted longer than the historical era. Kind of like how the television show M*A*S*H lasted far longer than the actual Korean War in which it was set.

Manifest destiny?
Manifest destiny?

Credit for the piece goes to Randall Munroe.

Abortion by State

In case you did not hear, earlier this week Alabama banned all abortions. And for once, we do not have to add the usual caveat of “except in cases of rape or incest”. In Alabama, even in cases of rape and incest, women will not have the option of having an abortion.

And in Georgia, legislators are debating a bill that will not only strictly limit women’s rights to have an abortion, but will leave them, among other things, liable for criminal charges for travelling out of state to have an abortion.

Consequently, the New York Times created a piece that explores the different abortion bans on a state-by-state basis. It includes several nice graphics including what we increasingly at work called a box map. The map sits above the article and introduces the subject direct from the header that seven states have introduced significant legislation this year. The map highlights those seven states.

We've been calling these box maps. It's growing on me.
We’ve been calling these box maps. It’s growing on me.

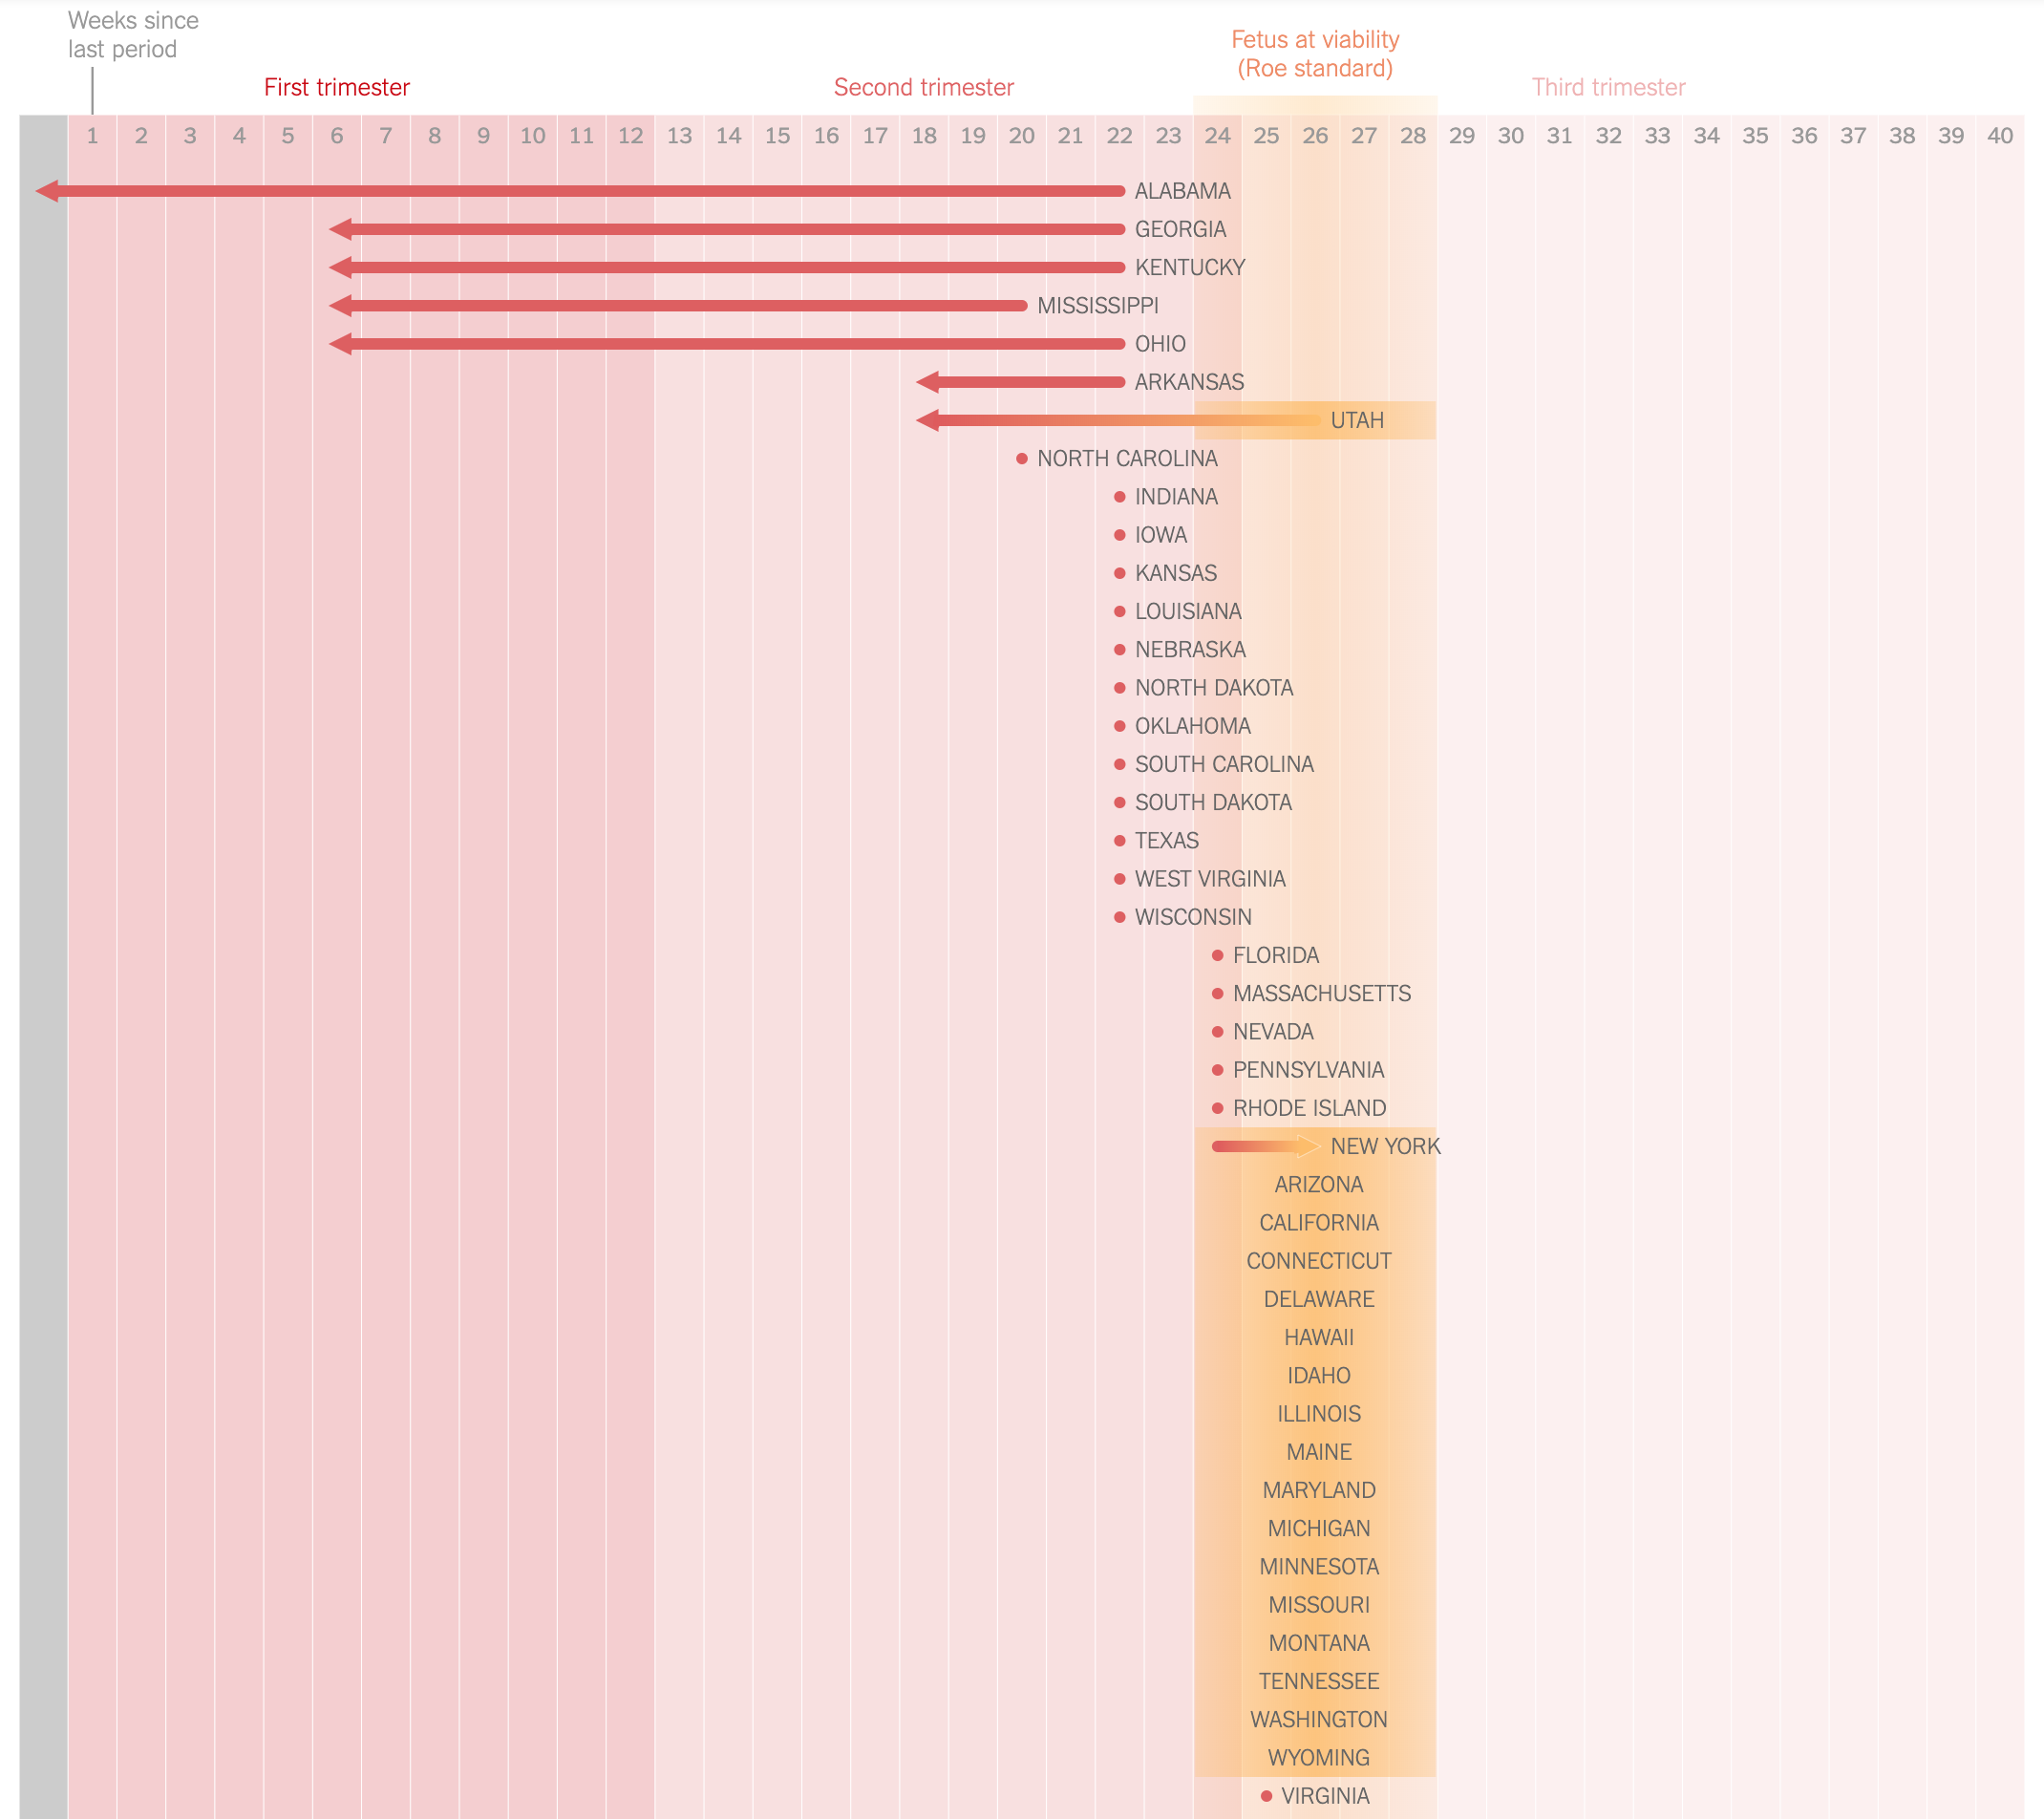
The gem, however, is a timeline of sorts that shows when states ban abortion based on how long since a woman’s last period.

There are some crazy shifts leftward in this graphic…

It does a nice job of segmenting the number of weeks into not trimesters and highlighting the first, which traditionally had been the lower limit for conservative states. It also uses a nice yellow overlay to indicate the traditional limits determined by the Roe v. Wade decision. I may have introduced a nice thin rule to even further segment the first trimester into the first six week period.

We also have a nice calendar-like small multiple series showing states that have introduced but not passed, passed but vetoed, passed, and pending legislation with the intention of completely banning abortion and also completely banning it after six weeks.

Far too many boxes on the right…

This does a nice job of using the coloured boxes to show the states have passed legislation. However, the grey coloured boxes seem a bit disingenuous in that they still represent a topically significant number: states that have introduced legislation. It almost seems as if the grey should be all 50 states, like in the box map, and that these states should be in some different colour. Because the eight or 15 in the 2019 column are a small percentage of all 50 states, but they could—and likely will—have an oversized impact on women’s rights in the year to come.

That said, it is a solid graphic overall. And taken together the piece overall does a nice job of showing just how restrictive these new pieces of legislation truly are. And how geographically limited in scope they are. Notably, some states people might not associate with seemingly draconian laws are found in surprising places: Pennsylvania, Illinois, Maryland, and New York. But that last point would be best illustrated by another box map.

Credit for the piece goes to K.K. Rebecca Lai.

The Rise of White Nationalist Terrorism

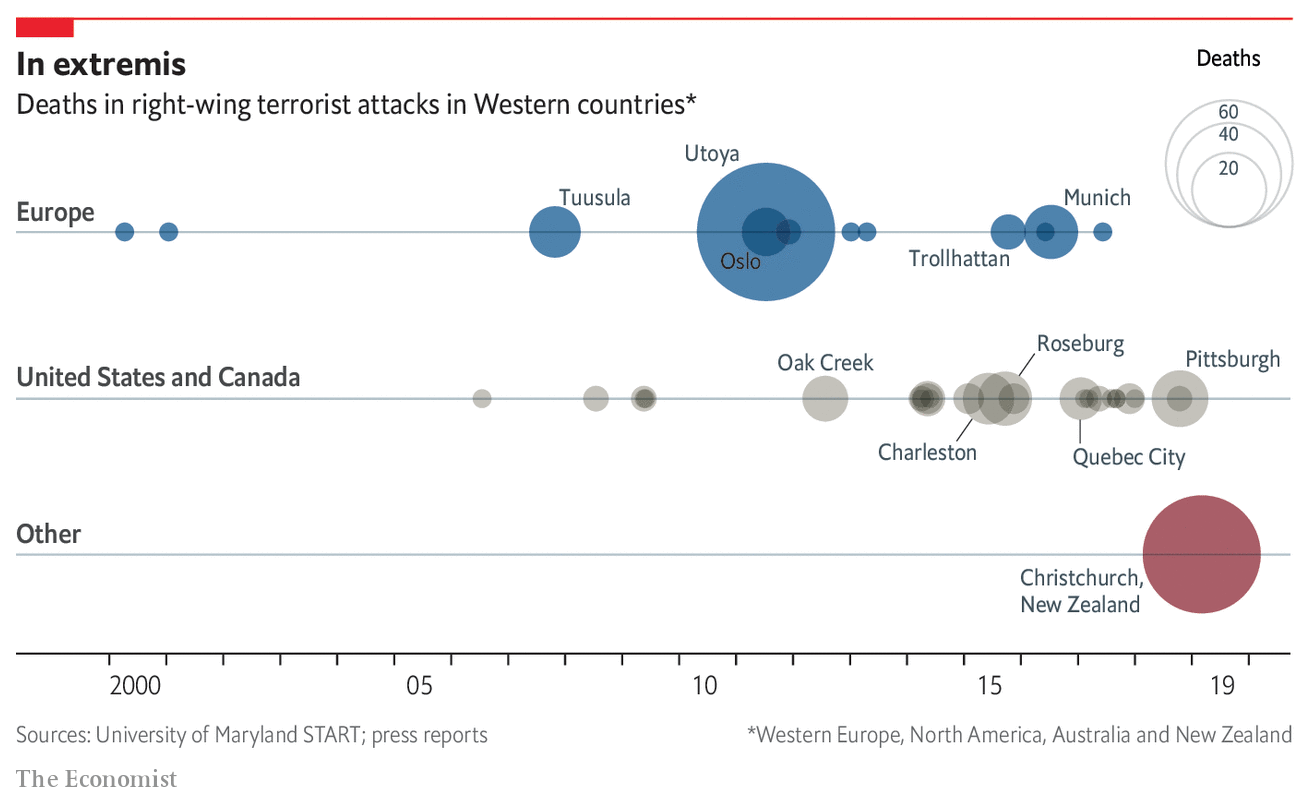
Whilst I was on holiday, a terrorist killed nearly fifty people in Christchurch, New Zealand. Except this time, he was a white man and the victims were all Muslims. Admittedly, I really did not read much about it until I returned to the States, but it clearly is not a thing I was expecting out of New Zealand. But the Economist looked at the question of whether this shooting is more of another in a pattern or a one-off.

Too many dots for my comfort…

The graphic does a fairly good job of showing the increasing frequency of right-wing/white nationalist terror attacks. From a design standpoint, the nice touch is the use of transparency to show overlapping events. For example, the concentric circles for Utoya and Oslo show the two Anders Breivik attacks in Norway.

You could arguably say the treatment begins to fail, however, in the US/Canada timeline. Here, regrettably, there are often too many attacks in too close proximity that the dots are too overlaid. Here I wonder if some other method of stacking or offsetting the incidents could work.

Credit for the piece goes to the Economist data team.

Trump Keeps Attacking the Special Counsel

Yesterday the New York Times published a fascinating piece looking at the data on how often President Trump has gone after the Special Counsel’s investigation. (Spoiler: over 1100 times.) It makes use of a number of curvy line charts showing the peaks of mentions of topics and people, e.g. Jeff Sessions. But my favourite element was this timeline.

All the dots. So many dots.

It’s nothing crazy or fancy, but simple small multiples of a calendar format. The date and the month are not particular important, but rather the frequency of the appearances of the red dots. And often they appear, especially last summer.

Credit for the piece goes to Larry Buchanan and Karen Yourish.

Asteroids on the Moon

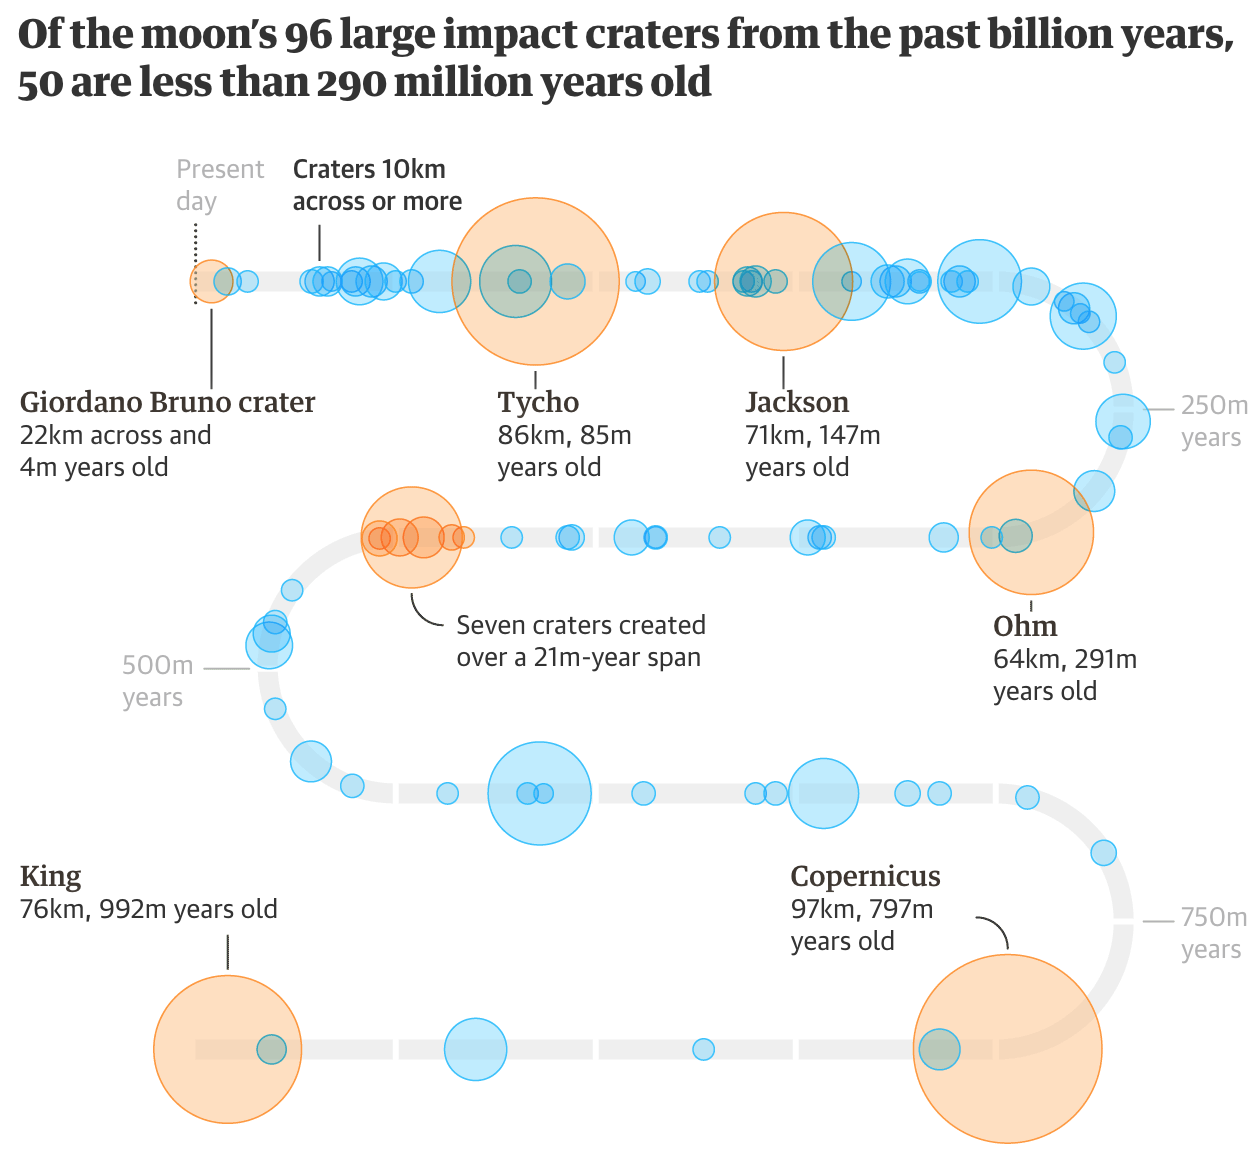
I hope everybody enjoyed their holiday. But, before we dive back into the meatier topics of the news, I wanted to share this serpentine graphic from the Guardian I discovered last week. Functionally it is a timeline charting the size of 96 known large asteroid impact craters on the Moon, between 80ºS and 80ºN.

Impacts on the Moon
Impacts on the Moon

The biggest question I have is whether the wrapping layout is necessary. I would prefer a more simplistic and straightforward, well, straight timeline, but I can imagine space constraints forcing the graphic into this box—either for the digital version and/or the likely print version.

The transparencies help to give a sense of density to the strikes, especially in the later years. And the orange ones highlight important or well-known craters like Tycho.

I do wonder, however, if the designer could have added a line at the 290 million years point. Since the graphic’s title calls that year out in particular, it might help the audience more quickly grasp the graphic’s…impact. In theory, the reader can more or less figure it out from the highlighting of the Ohm impact crater that is listed as 291 million years old. But a small grey line like those for the 250 million year increments could have been a nice little touch.

Overall, however, it’s nice to see a compact and helpful space graphic.

Credit for the piece goes to the Guardian graphics team.

What’s Next, Brexit?

A no confidence vote on Theresa May’s government, that’s what.

For those not familiar with parliamentary democracies, basically a no confidence vote is held when a substantial number of members of parliament have just that, no confidence, in the government of the day. The legislative body then votes and if the government wins, the government stays in power. If the government loses, typically, though not always, a new election is held to create a distribution of seats—it’s thought—that will yield a government that can hold the confidence. (There really is not an analogy for this in the US government that I can think of.)

To be fair, nobody really expects May’s government to collapse this afternoon. The Tories and her Democratic Unionist Party (a small Northern Irish party supporting the government) do not want to hold new elections nor do they want to give the Leader of the Opposition, Jeremy Corbyn, the chance to form his own government as much as they might despise May and her Brexit deal. So in all likelihood May survives by a dozen or so votes. On the other hand, the result yesterday was surprising in its scale, so could twenty or so of the 118 Tories who voted no vote against May? Possibly.

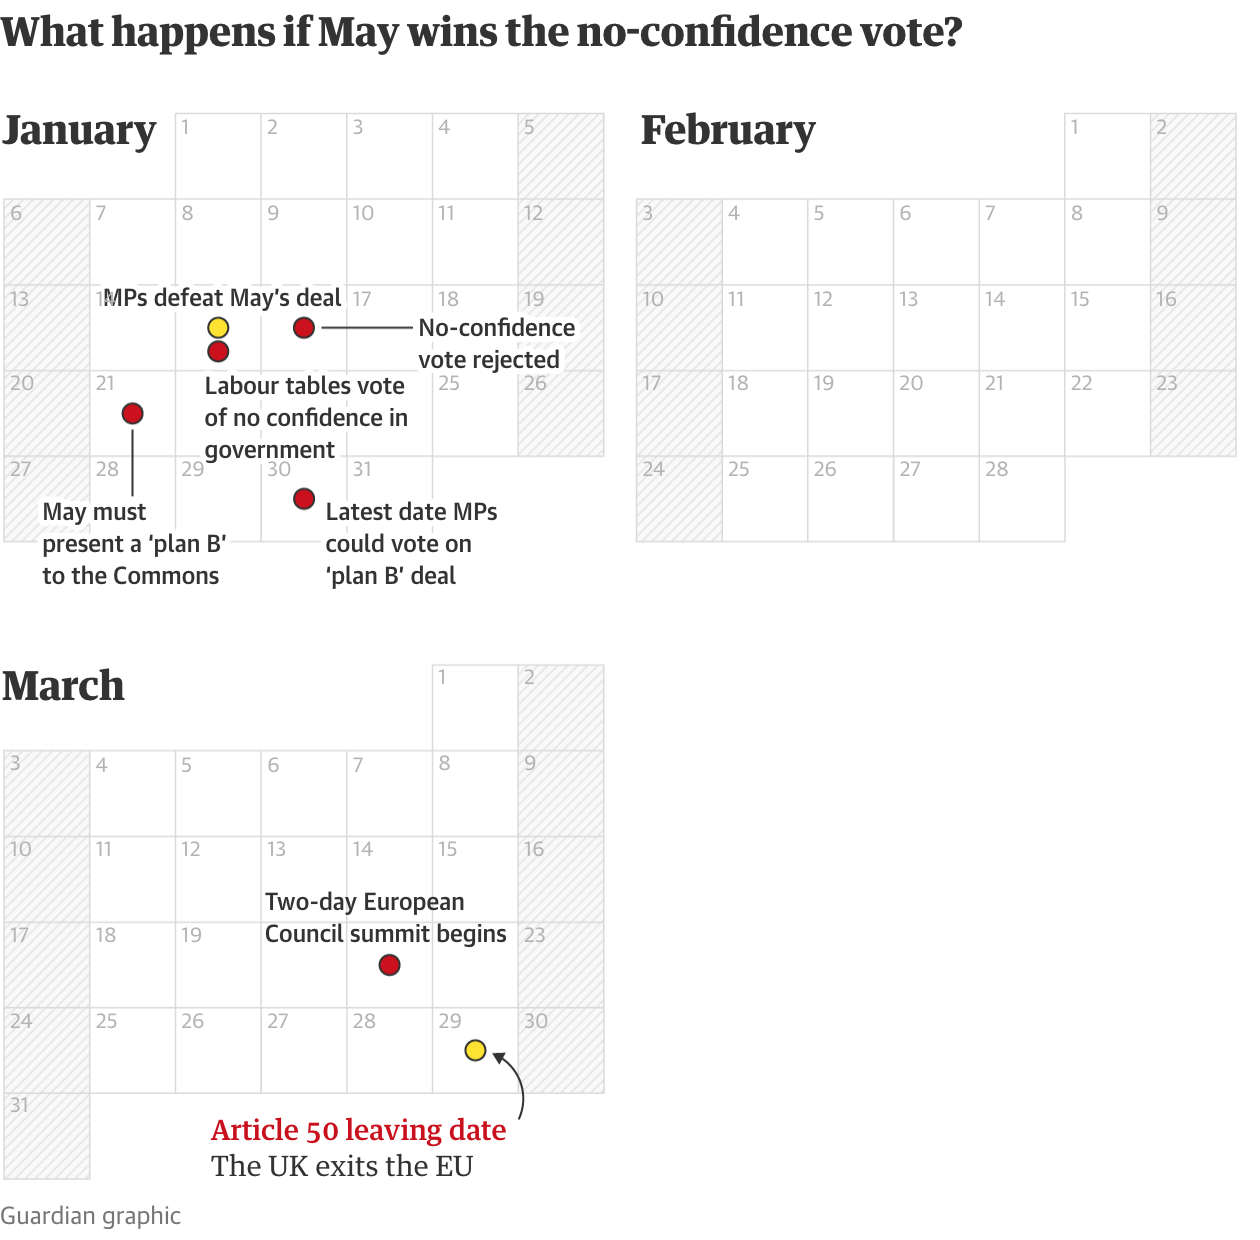
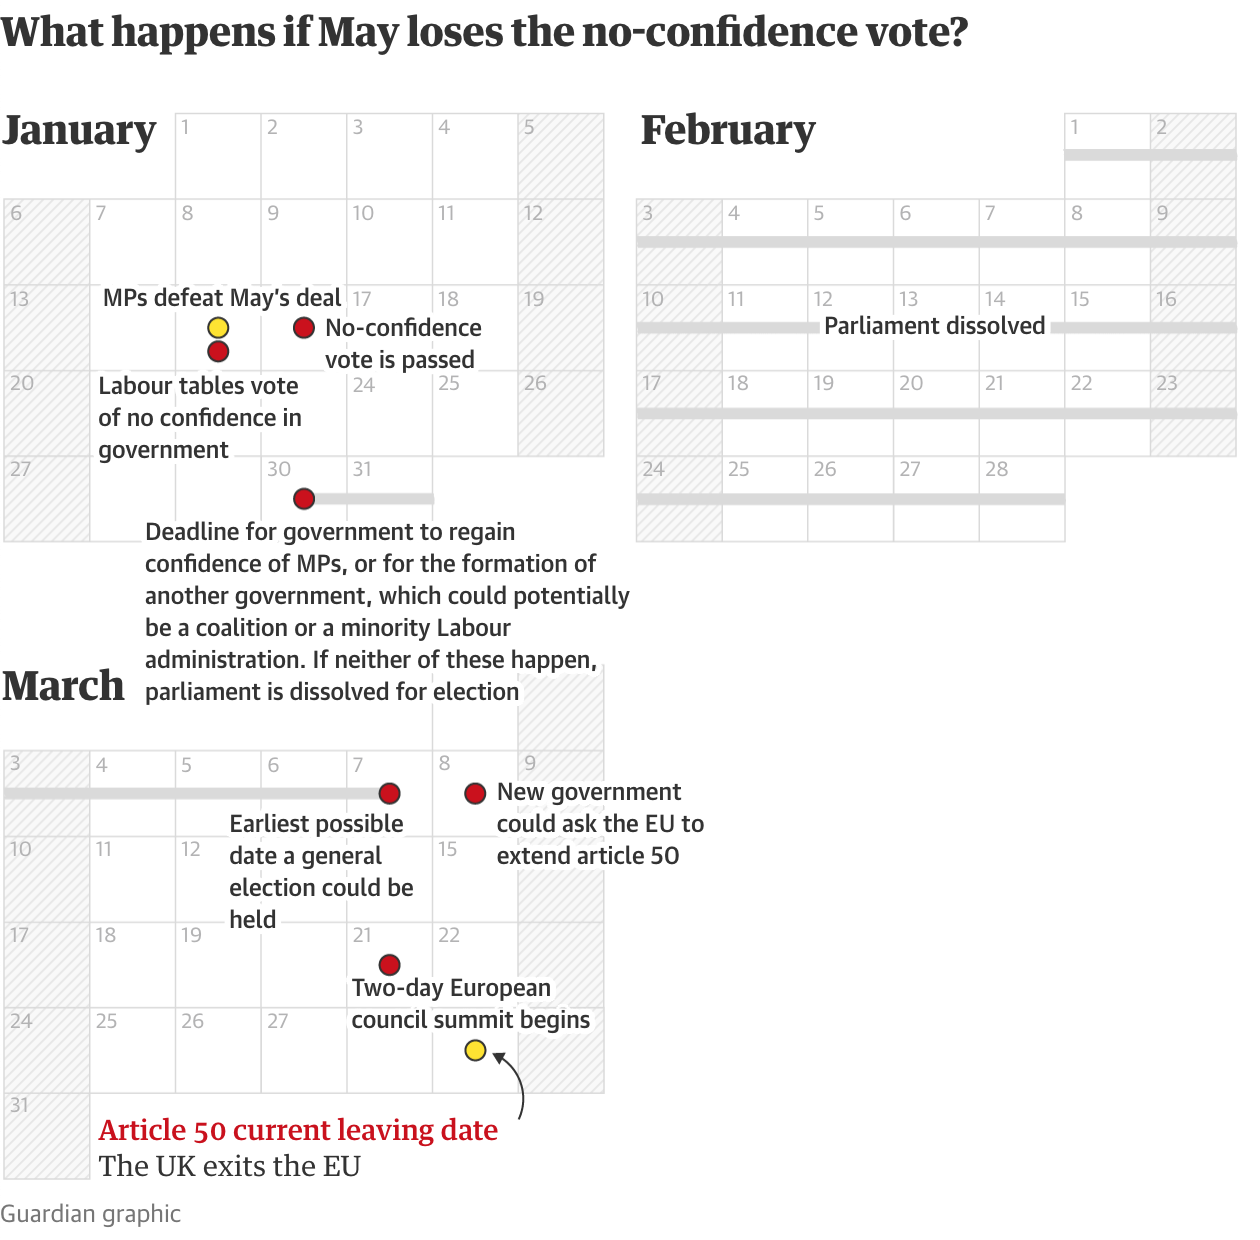
So then what next? Thankfully the Guardian put together two calendars showing just what happens and, crucially, in the context of how much time remains until the UK crashes out of the EU.

In case she wins, as we expect.

It still doesn't leave a lot of time to figure out what to do.
It still doesn’t leave a lot of time to figure out what to do.

If she loses, which is possible, but unlikely.

The UK would have even less time in this scenario.

The key thing to note is that the election campaign would eat up most of the time left and leave the UK very little time to do anything but ask the EU for an extension.

These are two small, but really nicely done graphics.

Credit for the piece goes to the Guardian’s graphics department.

The Saudi Assassination Squad

Yesterday we looked at the importance of arms deals from the US and UK to Saudi Arabia in the wake of the brutal murder and assassination of Jamal Khashoggi, the Washington Post journalist who sometimes wrote critically of the Mohamed bin Salman (MBS) regime. But what about the actual murder itself? What do we know?

Well at some point today, President Erdogan of Turkey will give a speech, just prior to the opening of the big Saudi conference the Saudis have branded the Davos of the Desert. In Erdogan’s speech, he is expected to reveal even more of the details of the murder as collected by Turkish intelligence services. But as this story has been unfolding, the Washington Post has been collecting the details about the alleged 15-person assassination squad.

The entire piece is worth reading. It provides great detail and walks the reader through how the story was pieced together. And relevant to my blog it makes use of some nice data visualisation and design elements, including this graphic.

A few too many coincidences in this story…

It captures some of the arrivals and departures of six of the men identified. The graphic also notes that sometimes people will not be documented because they arrive on diplomatic flights instead of commercial flights.

As for the rest, the Post used photographic evidence to show how one of the individuals was likely a bodyguard or in the security services for MBS. Phone records and the photographic records of Turkish border control were also used. Taken together, it paints a damning portrait of the supposedly modernising MBS regime.

Of course now we can only wait to see what Erdogan has to say this morning.

Credit for the piece goes to Aaron C. Davis, Aaron Williams and Jason Bernert.

Big Bulls

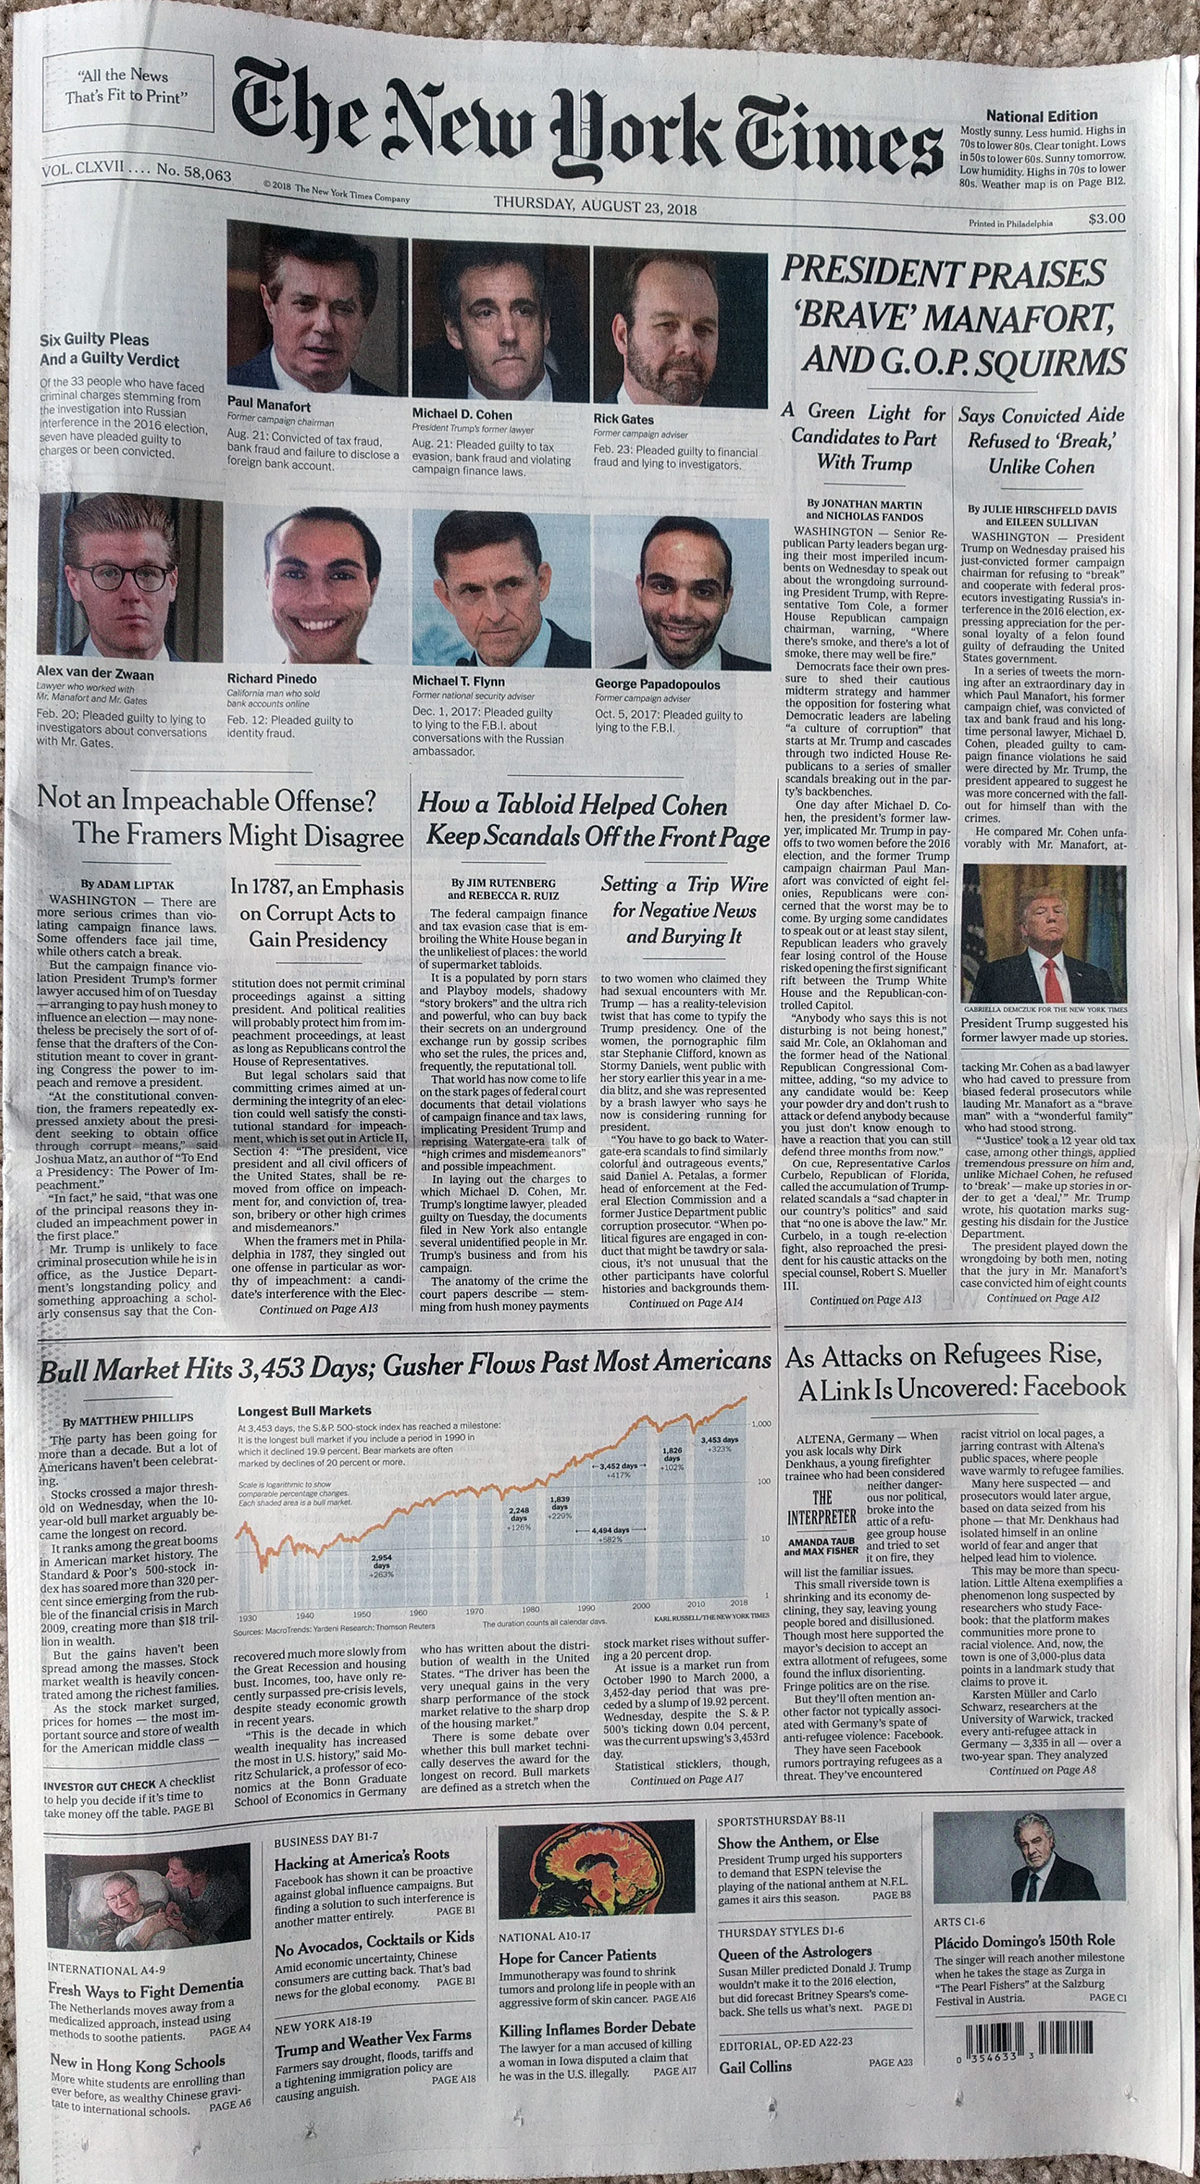
Last Thursday, the US entered its longest bull market in history. And the New York Times covered the story on the front page, which makes this another episode of covering graphics when they land on the Times’ front page. Of course, last week was a big news week away from the economy and so it is no surprise that the above-the-fold coverage was on the scandals besetting the president and those of his team who have pleaded guilty or been convicted of crimes by juries.

The front page design

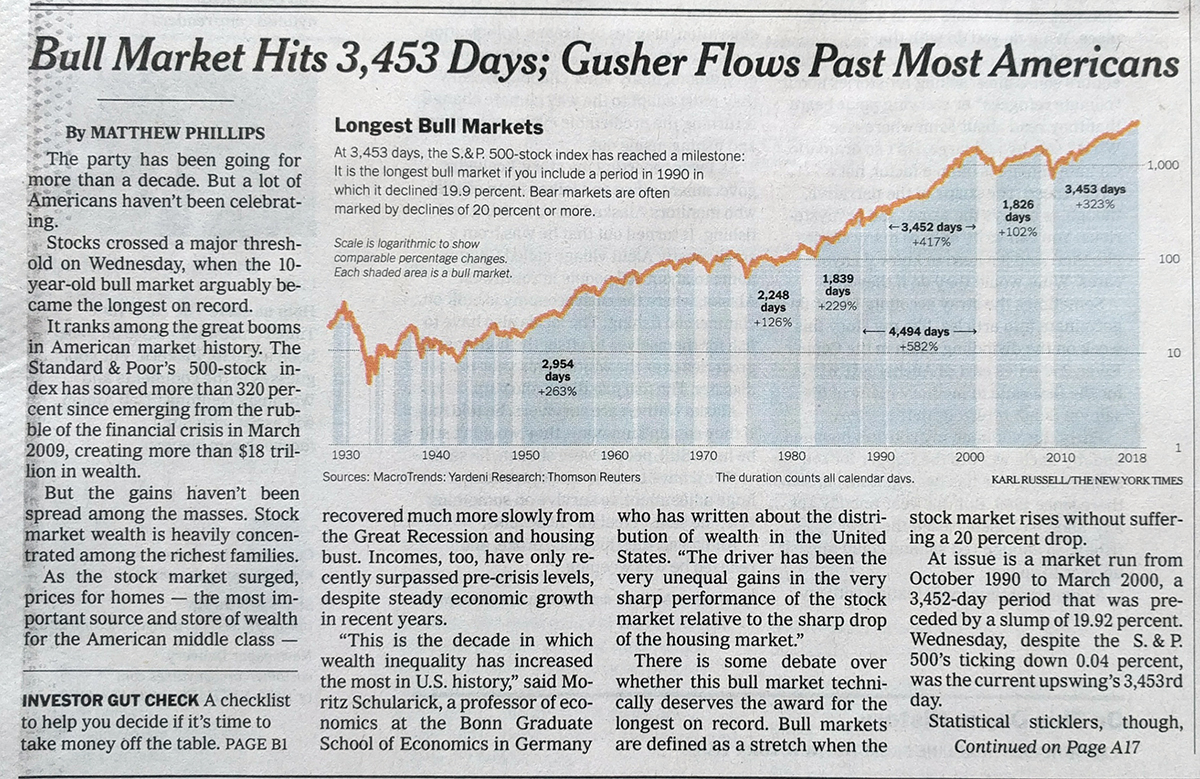
But you will note that below the fold is that nice little graphic. Here we see it in more detail.

Bull runs
Bull runs

What I like about the graphic is how it uses the blue fill to draw attention to the bull markets but then also labels how long each was. Those keen on the story will note there is a debate whether a particular 19.9% drop qualifies for the 20% drop usually used to benchmark the beginning and ending of a bull market. That is why there is that second label with the black arrows on the graphic.

It also uses the negative space created by the shape of the graphic to contain its title, text, and caption information.

Credit for the piece goes to Karl Russell.