In case you did not hear, earlier this week Alabama banned all abortions. And for once, we do not have to add the usual caveat of “except in cases of rape or incest”. In Alabama, even in cases of rape and incest, women will not have the option of having an abortion.
And in Georgia, legislators are debating a bill that will not only strictly limit women’s rights to have an abortion, but will leave them, among other things, liable for criminal charges for travelling out of state to have an abortion.
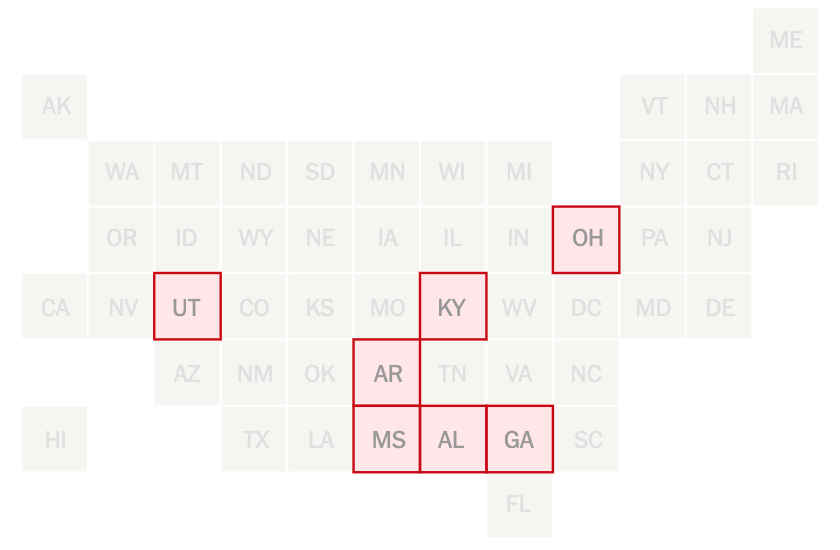
Consequently, the New York Times created a piece that explores the different abortion bans on a state-by-state basis. It includes several nice graphics including what we increasingly at work called a box map. The map sits above the article and introduces the subject direct from the header that seven states have introduced significant legislation this year. The map highlights those seven states.

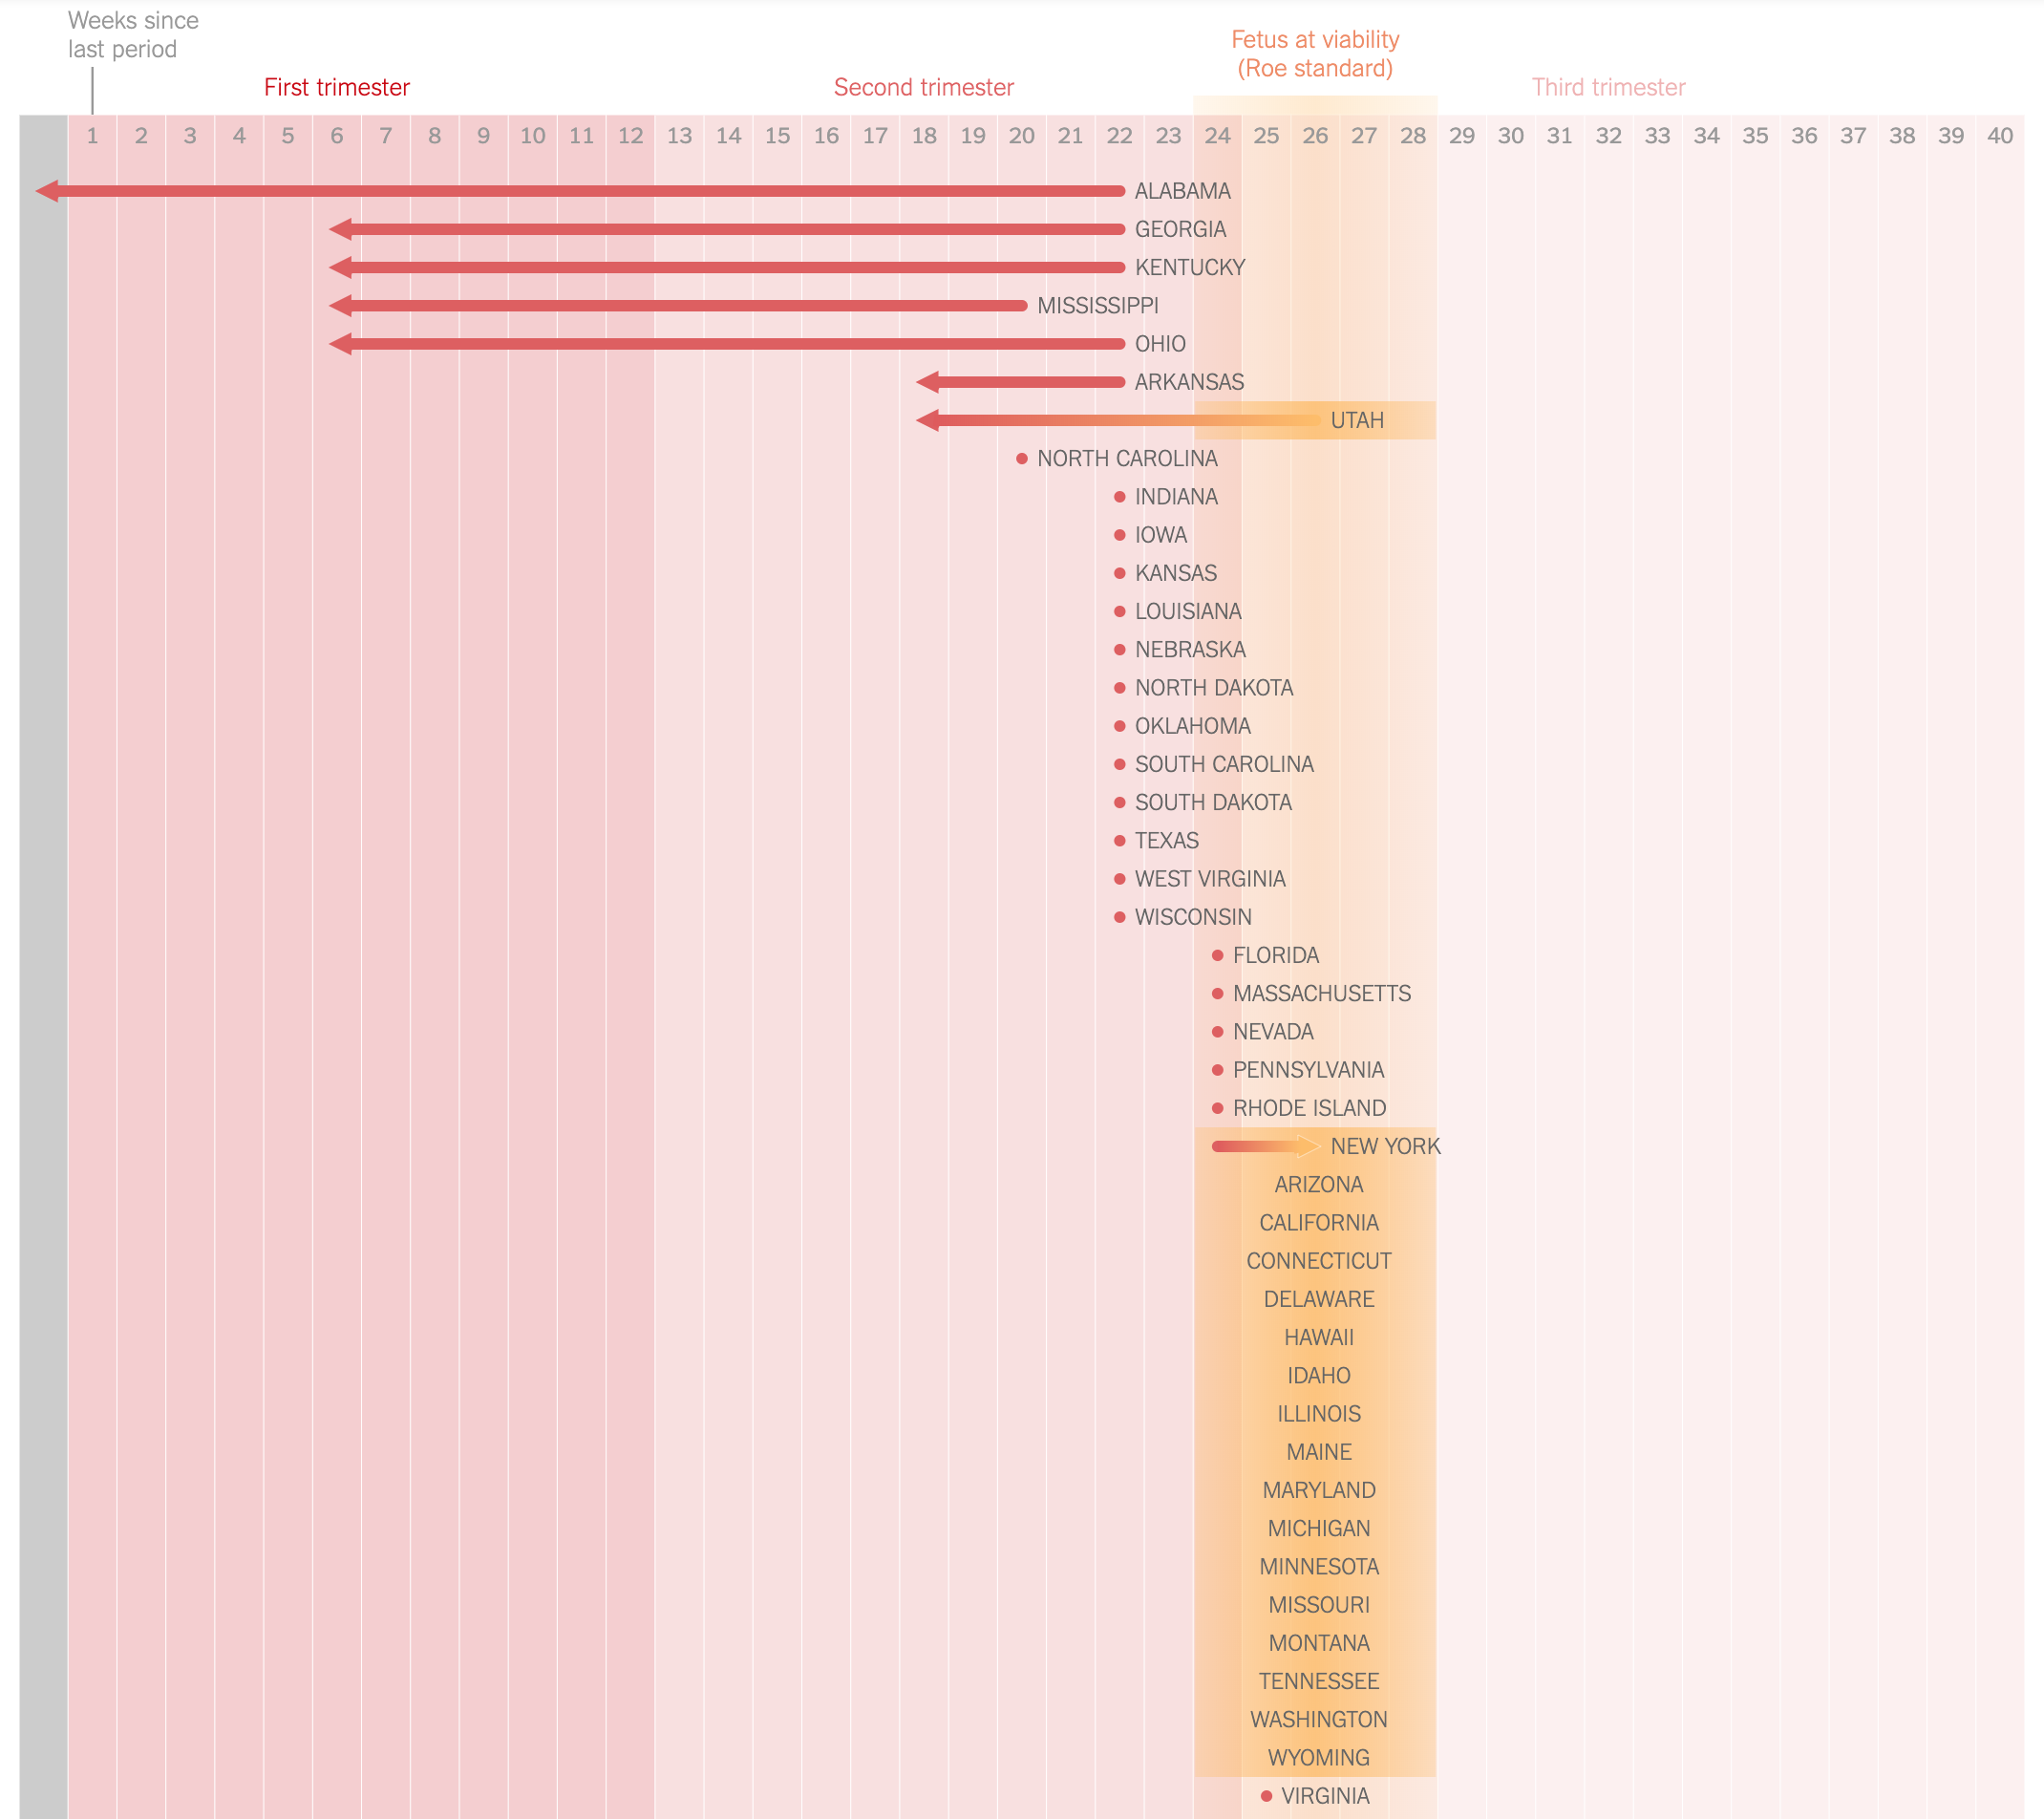
The gem, however, is a timeline of sorts that shows when states ban abortion based on how long since a woman’s last period.

It does a nice job of segmenting the number of weeks into not trimesters and highlighting the first, which traditionally had been the lower limit for conservative states. It also uses a nice yellow overlay to indicate the traditional limits determined by the Roe v. Wade decision. I may have introduced a nice thin rule to even further segment the first trimester into the first six week period.
We also have a nice calendar-like small multiple series showing states that have introduced but not passed, passed but vetoed, passed, and pending legislation with the intention of completely banning abortion and also completely banning it after six weeks.

This does a nice job of using the coloured boxes to show the states have passed legislation. However, the grey coloured boxes seem a bit disingenuous in that they still represent a topically significant number: states that have introduced legislation. It almost seems as if the grey should be all 50 states, like in the box map, and that these states should be in some different colour. Because the eight or 15 in the 2019 column are a small percentage of all 50 states, but they could—and likely will—have an oversized impact on women’s rights in the year to come.
That said, it is a solid graphic overall. And taken together the piece overall does a nice job of showing just how restrictive these new pieces of legislation truly are. And how geographically limited in scope they are. Notably, some states people might not associate with seemingly draconian laws are found in surprising places: Pennsylvania, Illinois, Maryland, and New York. But that last point would be best illustrated by another box map.
Credit for the piece goes to K.K. Rebecca Lai.
