Earlier this week, Wolfram Alpha released some findings from its analytics project on Facebook. While the results offer quite a bit to digest, the use of some data visualisation makes it a little bit easier. And a lot more interesting.
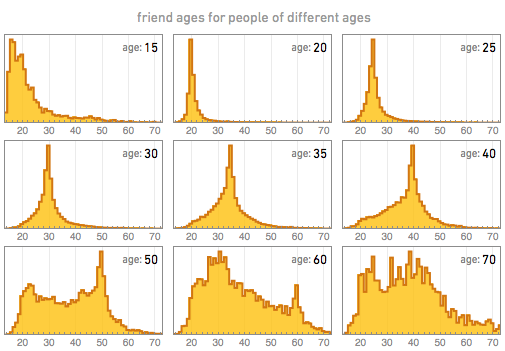
The results offer quite a bit of detail on interests, relationship statuses, geographic locations, and ages. Below is just one of the small multiple sets, this one looks at the number of friends of different ages for people of different ages. Basically, how many young or old people are friends of young people? Friends of old people?

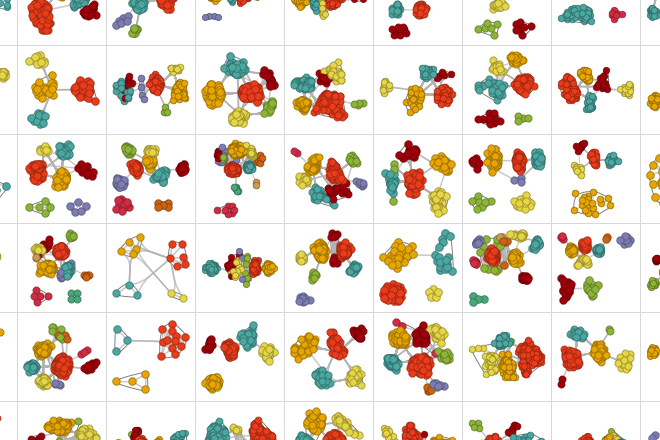
But I was most interested in the analysis of social networks. The mosaic below is indicative of the sheer size of the survey, but also begins to hint at the variance in the social structures of the data donors.

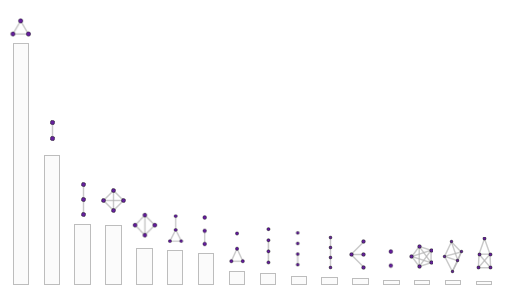
While these views are all neat, where it begins to get really interesting is Wolfram Alpha’s work on classifying the different types of social networks. By aggregating and averaging out clusters, simple forms begin to emerge. And after those forms emerged, they were quantified and the results are a simple bar chart showing the distribution of the different types of networks.

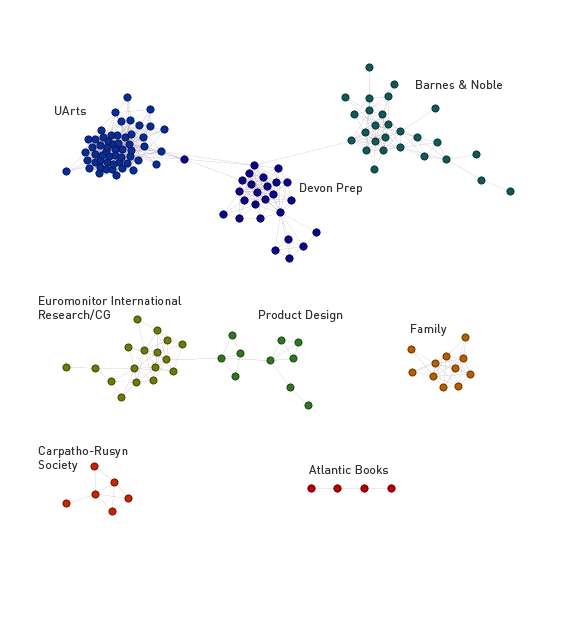
Overall, some very interesting work. But one might naturally wonder how their own networks are structured. Or just be curious to look at the data visualisation of their own Facebook profile. Or maybe only some of us would. Fortunately, you still can link your account to a Wolfram Alpha account (you have to pay for advanced features, however) and get a report. Below is the result of my network, for those who know me semi-well I have labelled the different clusters to show just how the clustering works.

Credit for the piece goes to Wolfram Alpha.
