Tag: network diagram
-
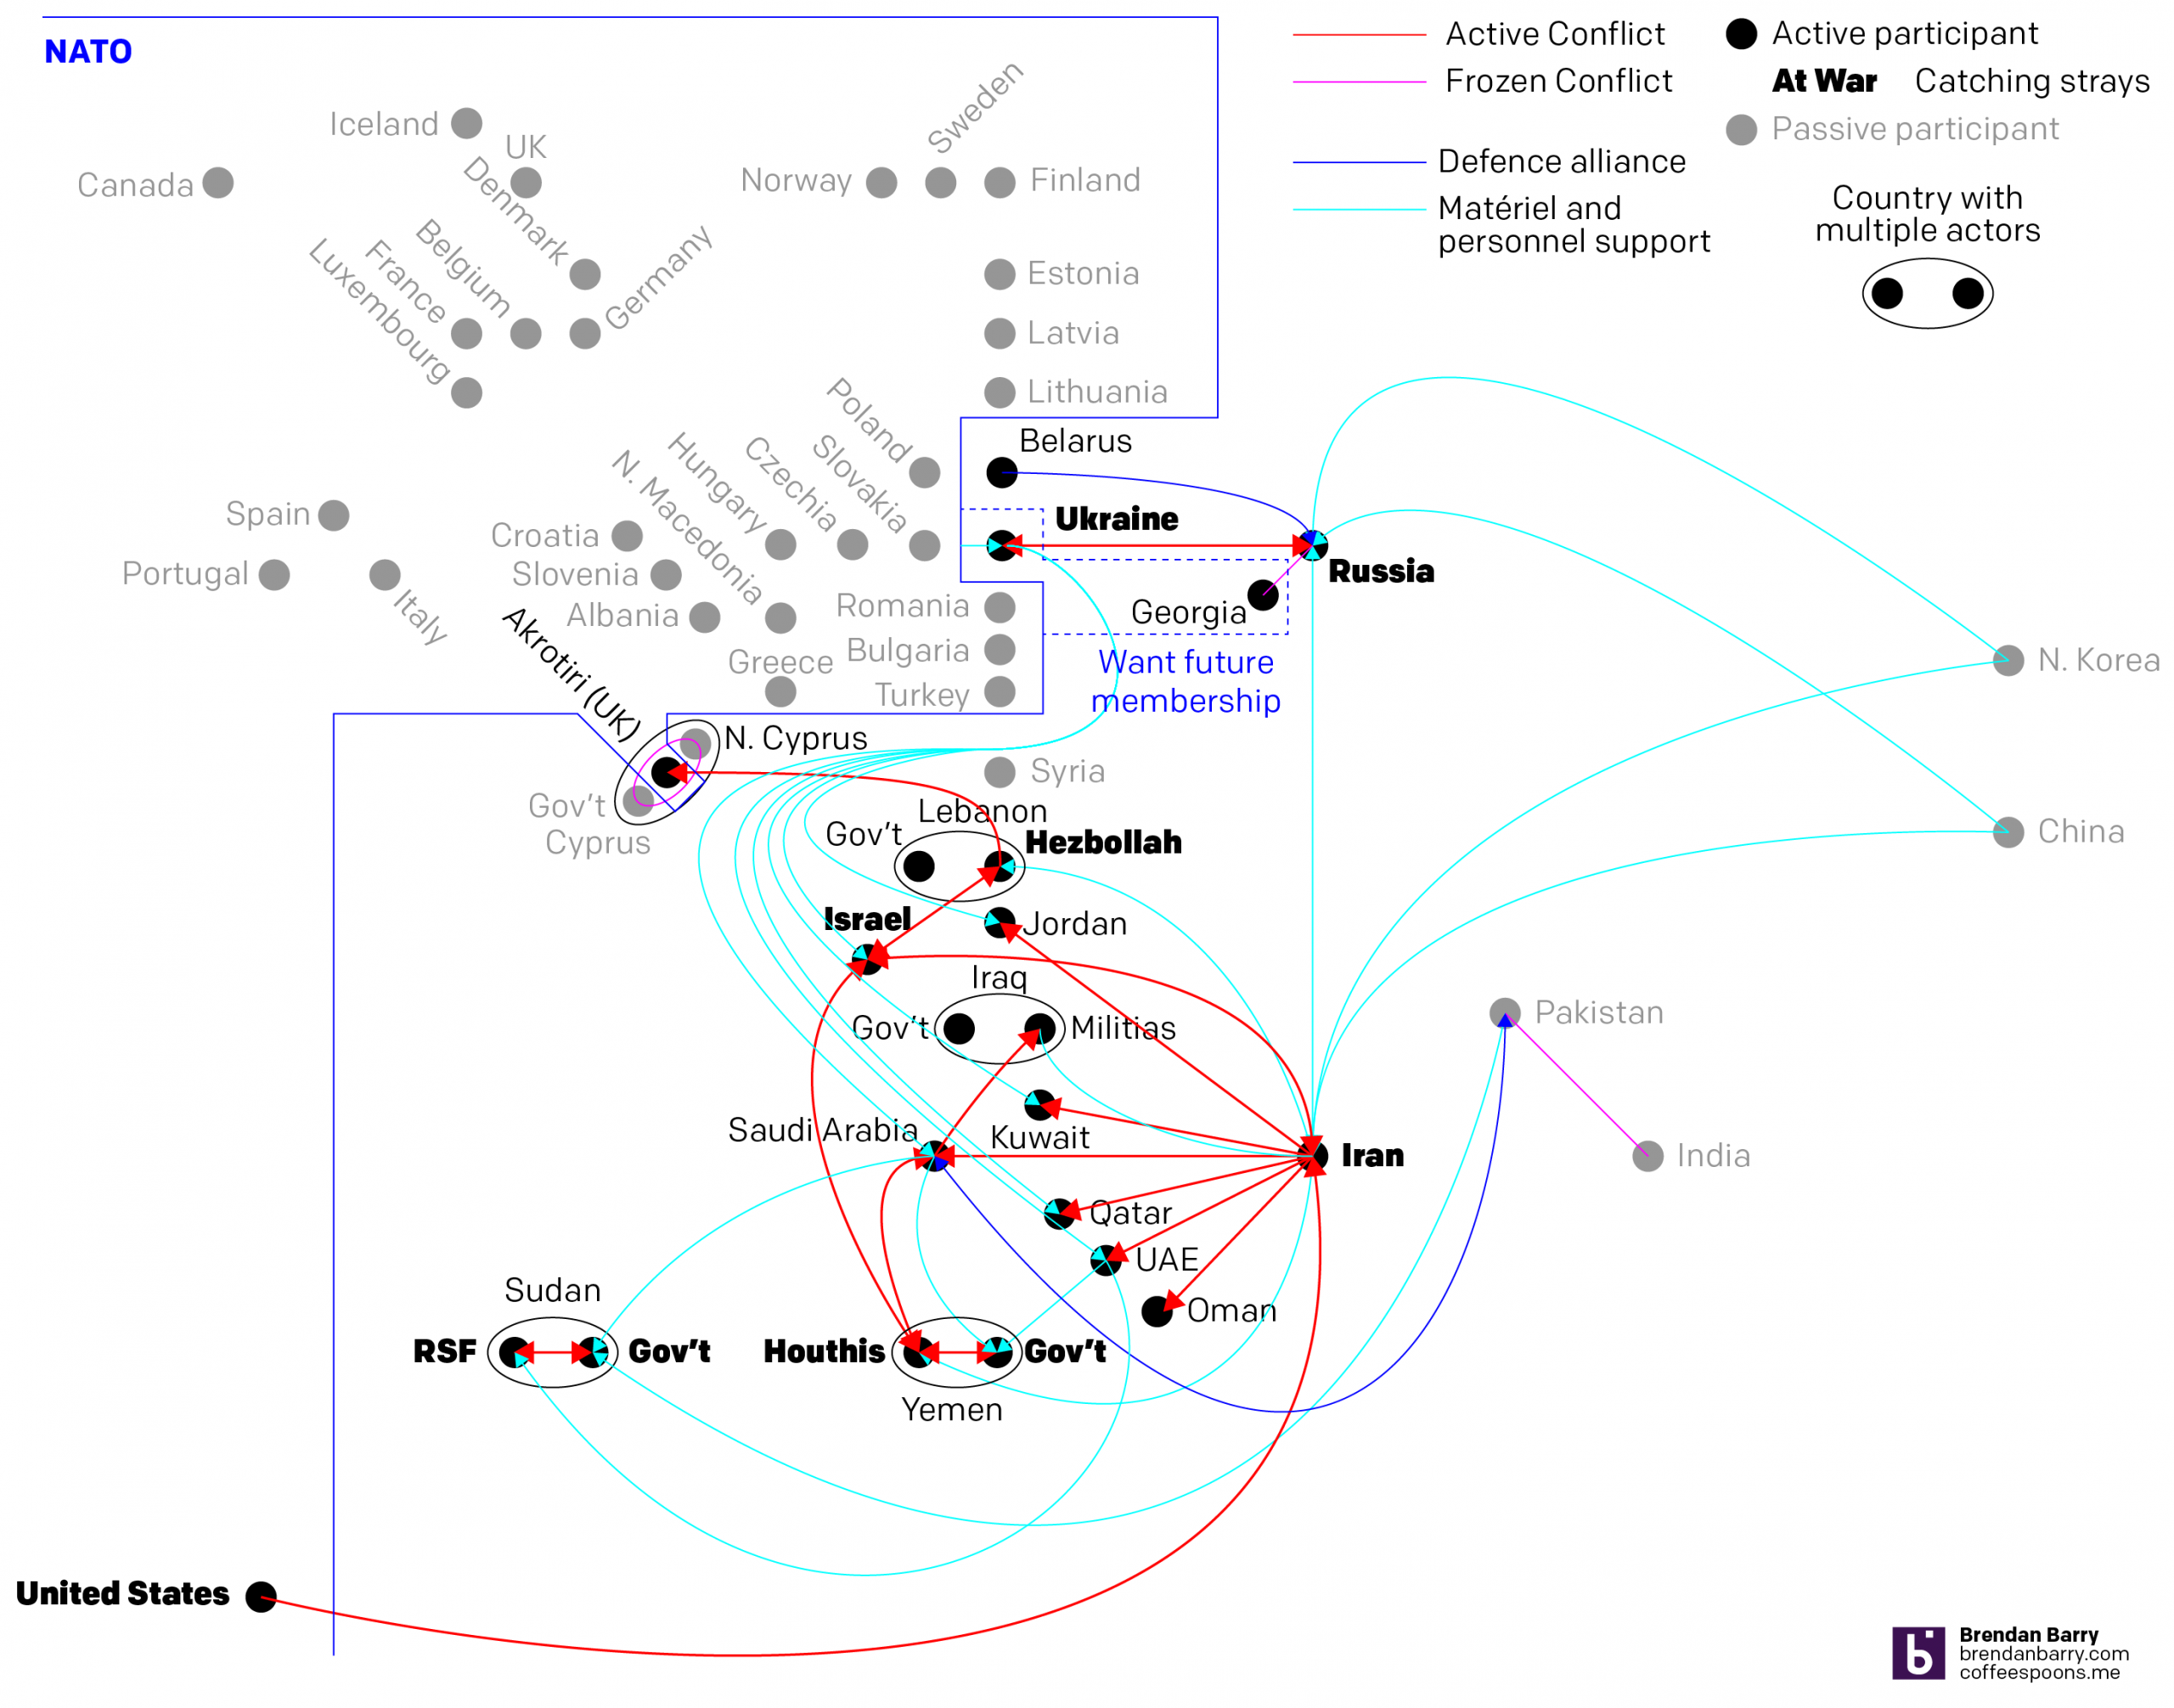
Global Integration. The Bad Kind.
I was hoping to post this yesterday, but as you will see momentarily, it is very much still a work-in-progress. Earlier this week, Ukraine sank an Iranian freighter in the Caspian Sea—a pugnacious though innocuous sounding sentence. Of course, Ukraine battles Russia in its eastern oblasts whilst Iran battles the United States and Israel in…
-
The David Petraeus Clusterfuck
This is sort of an early Friday post that follows up from my post on David Petraeus yesterday. Today’s comes from Hilary Sargent, once of the Boston Globe. It diagrams the network that ultimately resulted in the conviction I mentioned yesterday. For President-elect Donald Trump’s campaign to run so heavily against Secretary Clinton for mishandling classified…
-
Mapping the Stars
Of the acting and directing world over time. This interactive piece from the New York Times charts the networks between actors and directors. The networks on the right while examples and stories are located to the left. When you scroll to an example, the network to the right is highlighted in yellow. If you click…
-
Alaska Airlines
Here’s an older, March graphic from the New York Times that looks at Alaska Airlines. This exemplifies what maps do well; it maps relevant data onto a map. Perhaps that reads silly, but too often people map data just because most things are tied to a geography; things that happen in the world happen somewhere,…