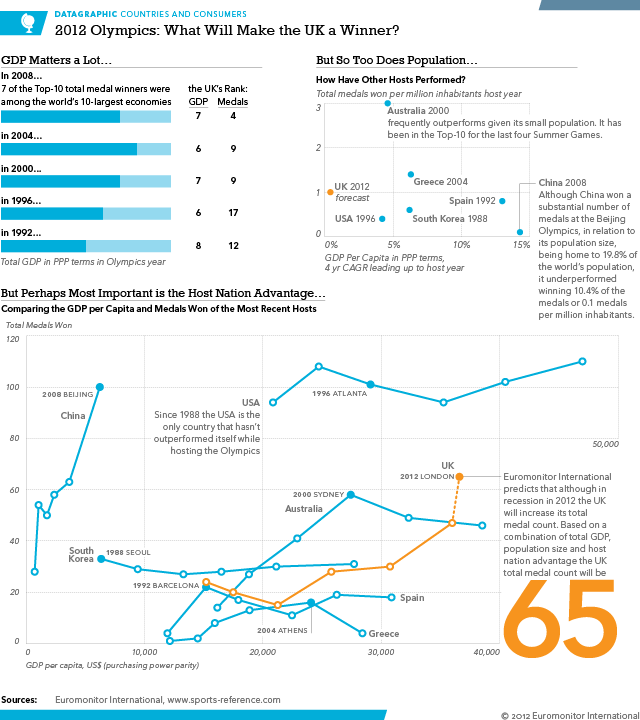
The Olympics are coming, the Olympics are coming. (As if you didn’t know.) In a rare moment of seeing my work outside of my company’s paywall, I can post a few infographics I have created for the 2012 Summer Games in London. The series looks at a few different non-Olympic variables like GDP per capita and mean BMI and sees whether they impact total medal counts in the Olympics.
This first datagraphic (to use my company’s internal language) looks at what makes a winner and will the UK be one this summer. The main chart in the piece compares GDP per capita performance to total medal count in each Olympic year from 1988 to 2008. And yes, we are predicting the UK to win a total of 65 medals this summer.

In the interest of full disclosure, I work as the senior graphic designer for Euromonitor International. This series was not intended to be used as part of marketing/promotional piece (I probably need to include the link to download that document here), but instead I designed them all as client-only content. But since others decided to use my work as marketing material, I am fortunately allowed to share it with all of you via my blog. So yeah, that’s pretty cool. Enjoy.
Leave a Reply
You must be logged in to post a comment.