I’m not working for a good chunk of the next few days. But, I did want to share with my readers an analysis of Pennsylvania’s missing votes. Broadly, Trump needs to win the Commonwealth of Pennsylvania next week—yes, the US election is now one week away. Though, Pennsylvania allows mail-in ballots postmarked on Election Day to arrive within a few days and still be counted. So we may not have final tallies for the state until the weekend or Monday after Election Day.
Pennsylvania, of course, narrowly voted for Donald Trump over Hillary Clinton in 2016 with 44,000+ votes making the difference. In 2020, polling has consistently placed Joe Biden above Donald Trump by 5+ points. But, can Trump again pull off an upset victory?
I argue that yes, he can. And fairly easily too. (If you want to see why I think Pennsylvania is really Trumpsylvania, I recommend checking out my longer, more in-depth analysis.) So where would the votes come from? I mapped the 2016 difference between votes cast and registered voters, i.e. people who could have voted, but did not for whatever reason. I then coloured the map by the county’s winner in 2016. Red counties voted for Trump by more than 10 points and blue for Clinton by more than 10 points. The purple counties are those that were competitive, plus or minus 10 points for either candidate.
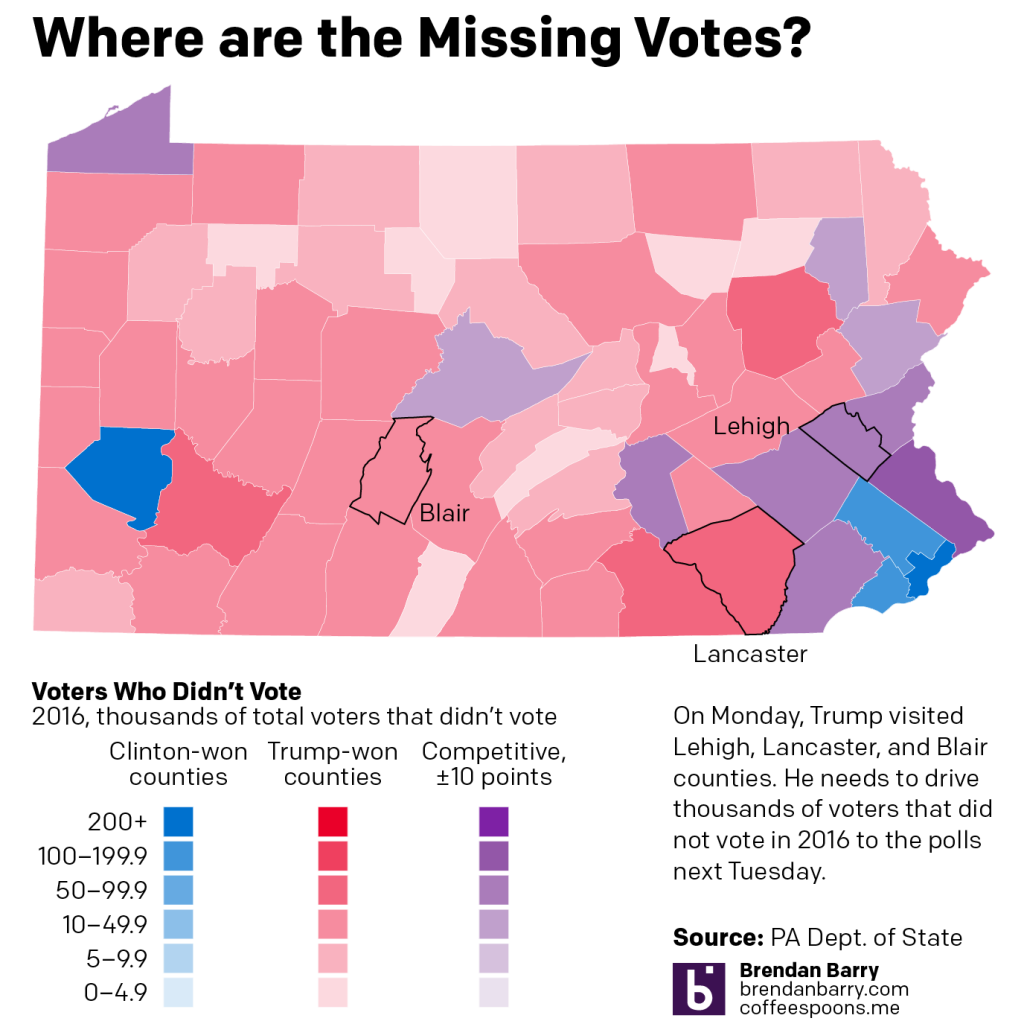
In the purple counties, both candidates will want to drive out as many voters as possible. But in the blue counties, Biden has reliably Democratic votes and in red Trump has reliably Republican votes. So why on Monday did Trump visit Allentown, Lititz, and Martinsburg? Because that’s where those votes are.
Allentown, in Lehigh County, is competitive. In fact, neighbouring Northampton Co. will be a key swing county next week and one I will be following closely as the returns come in. But Lititz, Lancaster Co., and Martinsburg, Blair Co., are in reliably red counties. (Though in my Trumpsylvania piece I argue Lancaster Co. is undergoing a transition to a competitive, albeit lean Republican county.)
In Lancaster Co., which went to Trump by nearly 20 percentage points in 2016, there were still just short of 100,000 voters who didn’t vote in 2016. Not all of those voters would have voted for Trump, but for sake of argument, just say 50% would have. That makes just short of 50,000 potential Trump votes—more than Trump’s entire state margin.
Blair Co. is in the Pennsyltucky region of the state, relatively rural, but in Blair’s case, its county seat Altoona is the state’s 10th largest city. While the total number of votes—and the total number of non-voting voters—are smaller than in Lancaster Co., add up all the available votes and it’s a large number.
If you add up all those red counties’ missing votes, you get a total of just shy of 840,000 missing votes. Far more than enough to drastically swing the Commonwealth to Trump in 2020.
Of course, Biden’s counting on driving out turnout in Philadelphia and Pittsburgh and their suburbs, along with other cities in the state, like Allentown, Scranton, Harrisburg, and Erie. In those blue counties, there were 927,000 missing votes, so the potential for a Biden win is also there.
But, if Democratic voters don’t vote again in 2016, Trump has plenty of potential votes to pick up across the state.
Credit for the piece is mine.
Leave a Reply
You must be logged in to post a comment.