Last weekend the United States and Israel preemptively struck Iran and kicked off a regional war. As I type this Monday morning, the US–Israeli strike forced assassinated the ayatollah and numerous other senior Iranian officials—but this seems to have been anticipated to a degree and the regime quickly retaliated and has delegated roles and responsibilities. Overnight Israel struck Beirut, Lebanon after Hezbollah retaliated for Khamenei’s death. On the other side of the ledger, Iran has struck US facilities throughout the Gulf along with Israel proper. Additionally, Iran has struck countries actively or passively supporting the US and Israel: Saudi Arabia, Kuwait, Jordan, the United Arab Emirates, Qatar, Bahrain, Oman, and even Cyprus—home to RAF Akrotiri, a key British and NATO airbase.
Regional war engaged.
As a city dweller, I do not drive. I take buses, trains, and the subway to get where I need to go. Petrol or gas prices do not directly impact me. They feed into the input costs of things like groceries through logistics costs, but I do not often see the “price at the pump”. But, one thing I will be keeping an eye on in the coming days and weeks is how Iran responds and whether it attempts to close the Strait of Hormuz.
At the weekend, CNN published a great piece about some of the downstream effects of the war, i.e. beyond the bodies and bombed out facilities. Their article had a large graphic showing oil tanker traffic through the Strait of Hormuz in the final week of January. And when I say large, I mean it could not fully fit on my laptop’s screen.
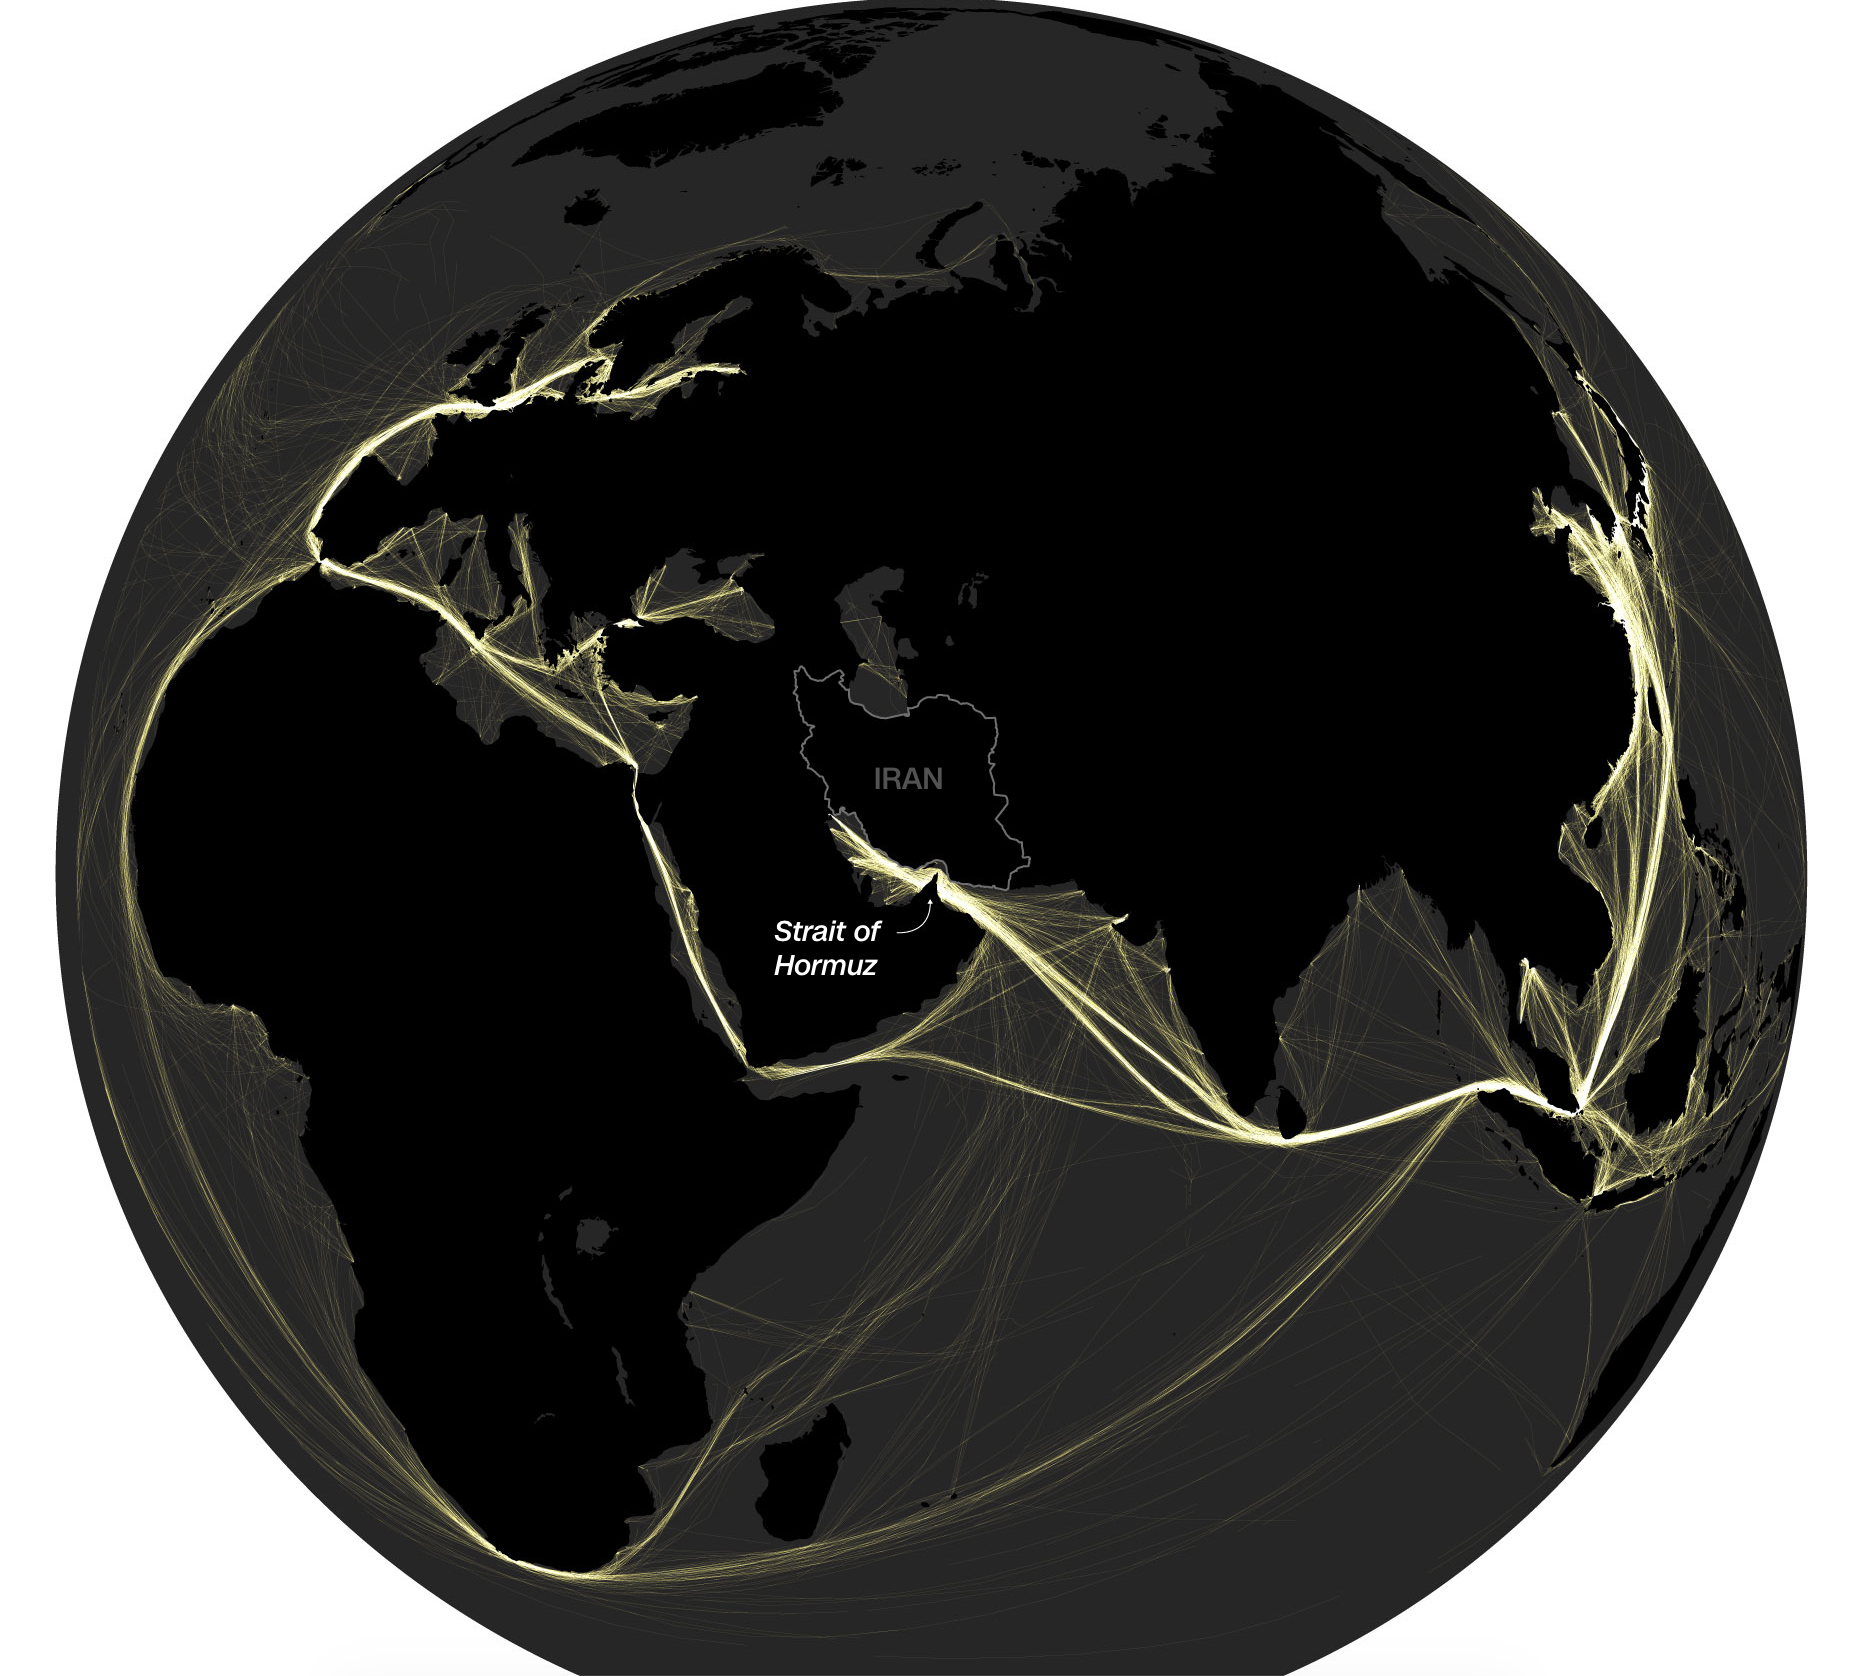
Undoubtedly, this is a captivating graphic—personally, I enjoy the aesthetic. However, I consider this more a data art piece, as it is difficult to analyse the situation with the graphic as is. What it shows is in that week, a lot of oil tankers transited the Strait. But so did they the Strait of Malacca, the Strait of Gibraltar, the English Channel, and other maritime choke points.
Instead, the article continues with a great graphic showing the Strait of Hormuz’s critical role in the energy markets. It uses a Sankey diagram and illustrates the various oil exporters in the Gulf and the ultimate importers—the origination and destination of crude oil.
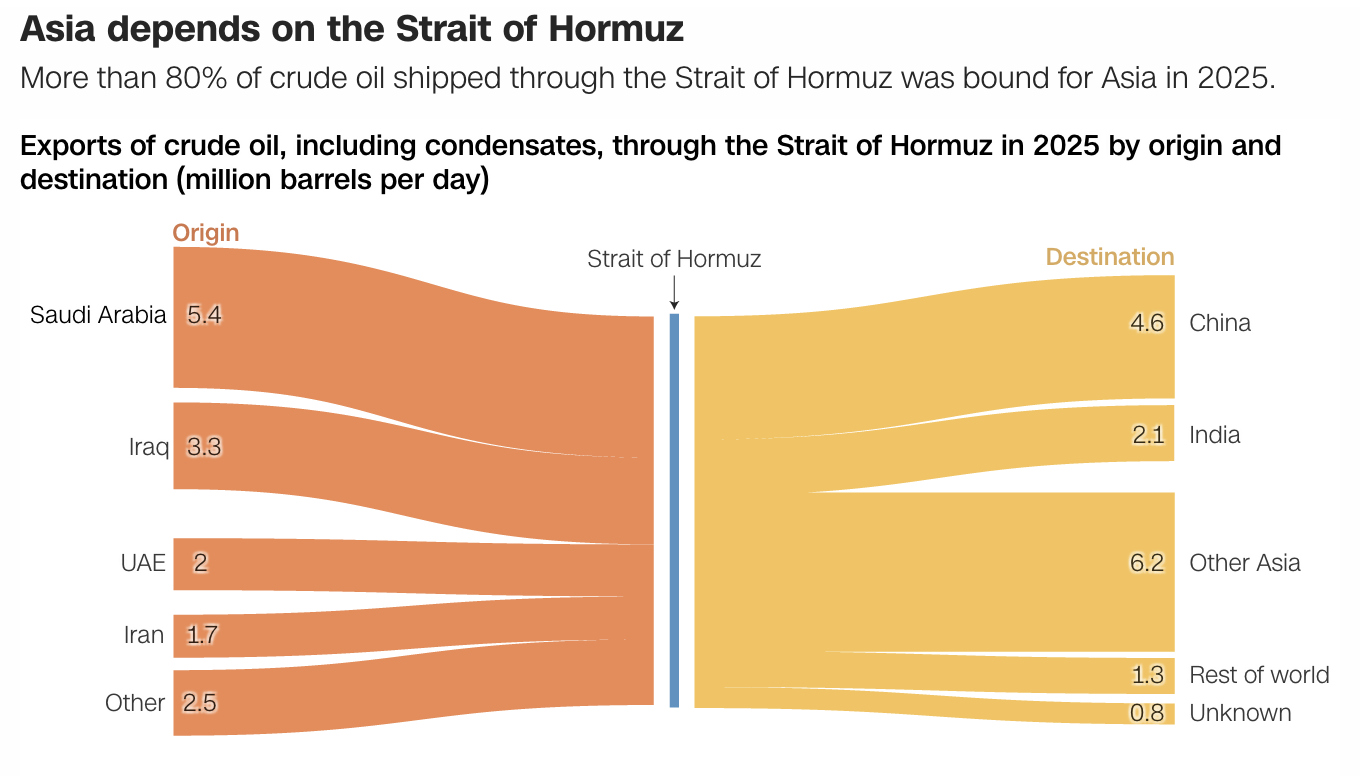
This graphic is far more relevant than the tanker traffic map, because it shows just how oil passes through the Strait—nearly 14 million barrels per day in 2025. And for international context in the geopolitical space, we can see that 85% makes its way to Asian markets. Of course, because oil is so easily traded, any impact to Asian markets—read, China and India—will force them to buy from exporters who might otherwise be supplying the American and Western markets. Then the inevitable, prices rises as demand remains stable and supplies shrink.
Will the prices at the pump in Philadelphia rise? Will the cost of goods and groceries inflate?
As to the graphic, I think one little tweak here could have been colour. The red and yellow for the Middle East/Gulf countries and the destination markets works. But if the Rest of World and Unknown had been coloured grey, the impact of the closure of the Strait of Hormuz on Asian oil supplies specifically would have been even clearer. Otherwise, this graphic is spot on.
The article has some additional graphics, which probably warrant attention. Perhaps later this week I shall attempt to address those. But for this roughly half of the article, things are very well done.
Credit for the tanker traffic graphic goes to Renée Rigdon.
Credit for the Sankey diagram goes to Rhyannon Bartlett-Imadegawa.