And I am not talking about Atlantic City. No, on Saturday, the Red Sox fired their manager Alex Cora and his entire staff. Or, rather, the staff loyal to him. I wrote about that on Monday. Little did we know that Saturday night, Alex Cora and the chief of baseball operations for the Philadelphia Phillies, Dave Dombrowski, spoke by phone. Dombrowski hired Cora for the Red Sox back in 2018 and the two are very close, Cora viewing Dombrowski reportedly as a mentor.
On Sunday, post-firing, the two were in negotiations for Cora to take over management of the Philadelphia Phillies. The problem? Rob Thompson was managing the Phillies. On Monday, however, Cora declined Dombrowski’s offer in favour of taking an extended summer holiday and spending time with his family. Tuesday morning, Dombrowski fired Thompson and named bench coach Don Mattingly the interim manager. Tuesday afternoon and evening, this timeline emerged from Dombrowski himself and other news reports.
Oh, the intrigue.
So I thought before the Phillies’ first pitch Tuesday night I would take a few screenshots of their performance like I did with the Red Sox and share them here.
Spoiler: the Phillies have been playing poorly.
And no, this is still not what I thought I would be writing from last weekend.
I wanted to start with two graphics that show team statistics in the aggregate, with the Phillies highlighted against the othe2 29 MLB clubs. First, batters that cannot hit.
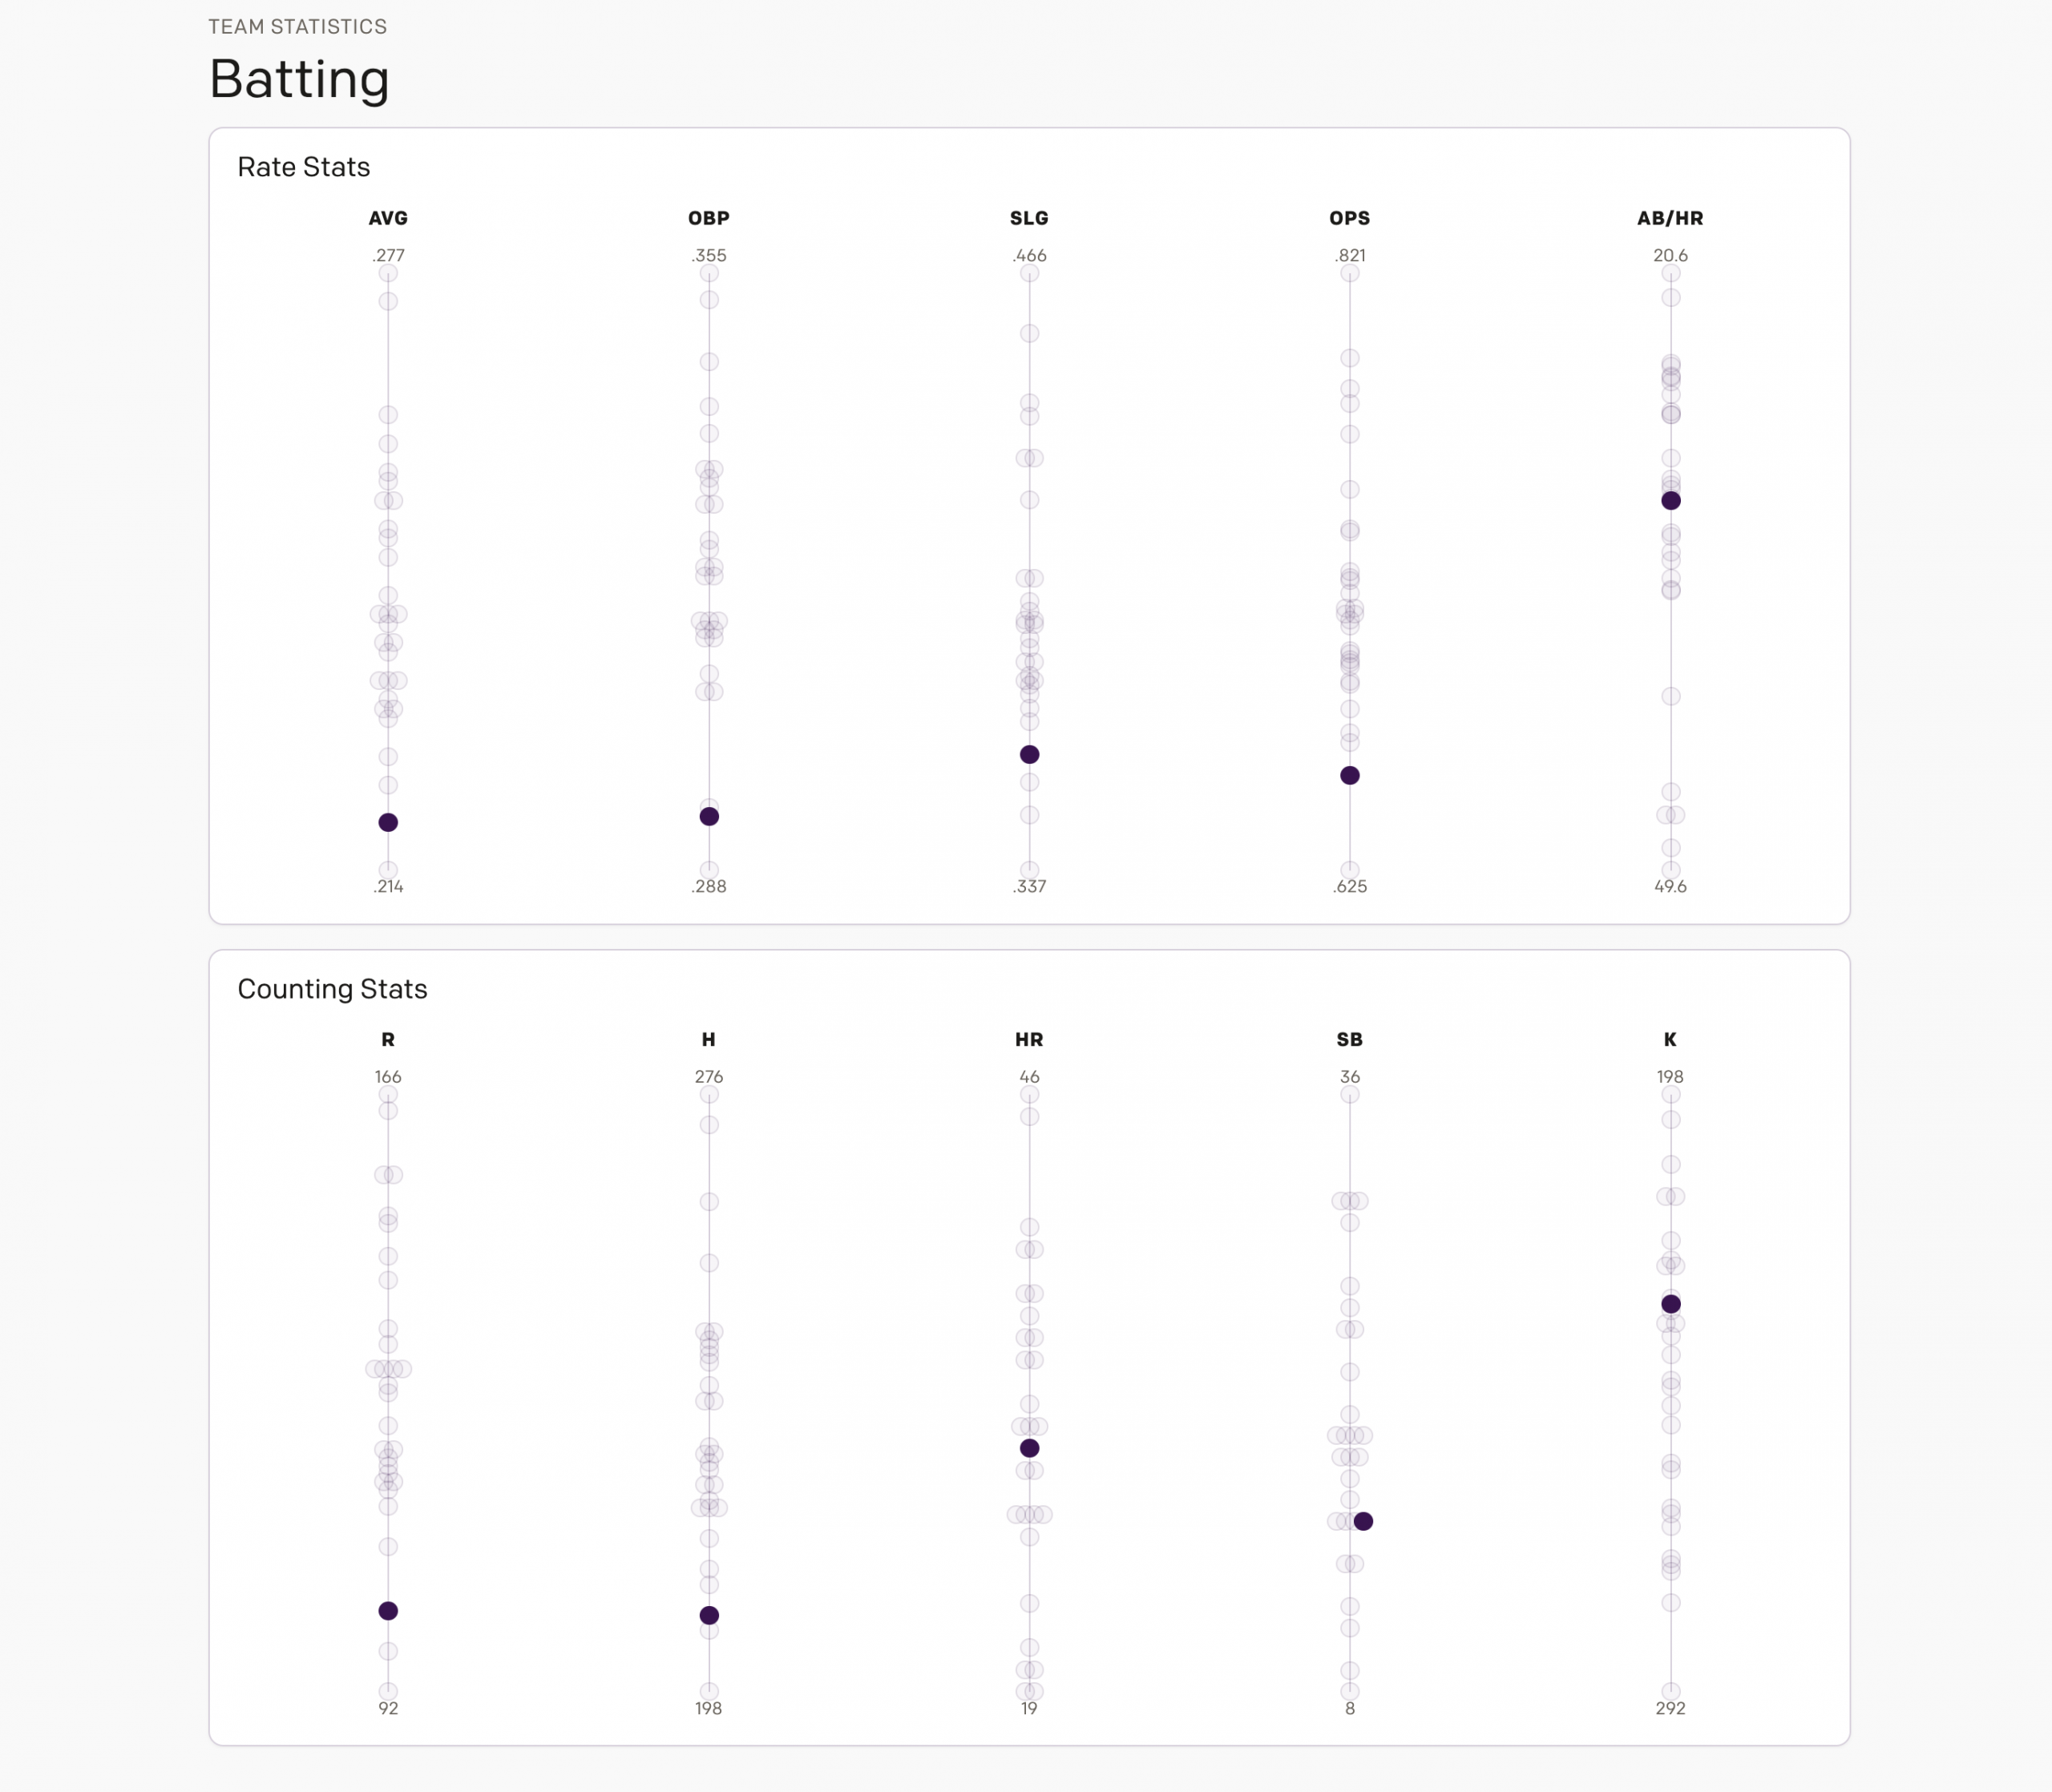
In general, this shows the Phillies have not (generally speaking) hitting the ball or getting on base. In short, the Phillies are not hitting. They get some walks, but not a lot to make even a halfway decent on-base percentage (OBP). Glass half full? They are better than average in terms of striking out, which suggests—perhaps, I would need to look at this data in particular—they are simply unlucky. In fact, when I look that statistic up, yes, they have the second worst batting average on balls in play (BABIP), which is basically a measure of luck. That suggests that with a larger sample size—there are still 134 games left to go—the Phillies’ lineup will improve just to regress to the average.
To examine the lineup’s performance at an individual level, I compared OBP to slugging (SLG).

The orange lines still represent the median for the displayed batters. You want to be in the upper right quadrant with these metrics, above average OBP and SLG. The Phillies, however, only have two batters living there: stars Bryce Harper and Kyle Schwarber. Only three players have better than average OBP numbers: Harper, Scwarber, and J.T. Realmuto, but he is below average in SLG. Conversely, Brandon Marsh has a better-than-average SLG, but a worse-than-average OBP. Everyone else who has more than 54 plate appearances? Worse in both.
Then we can look at the pitching.
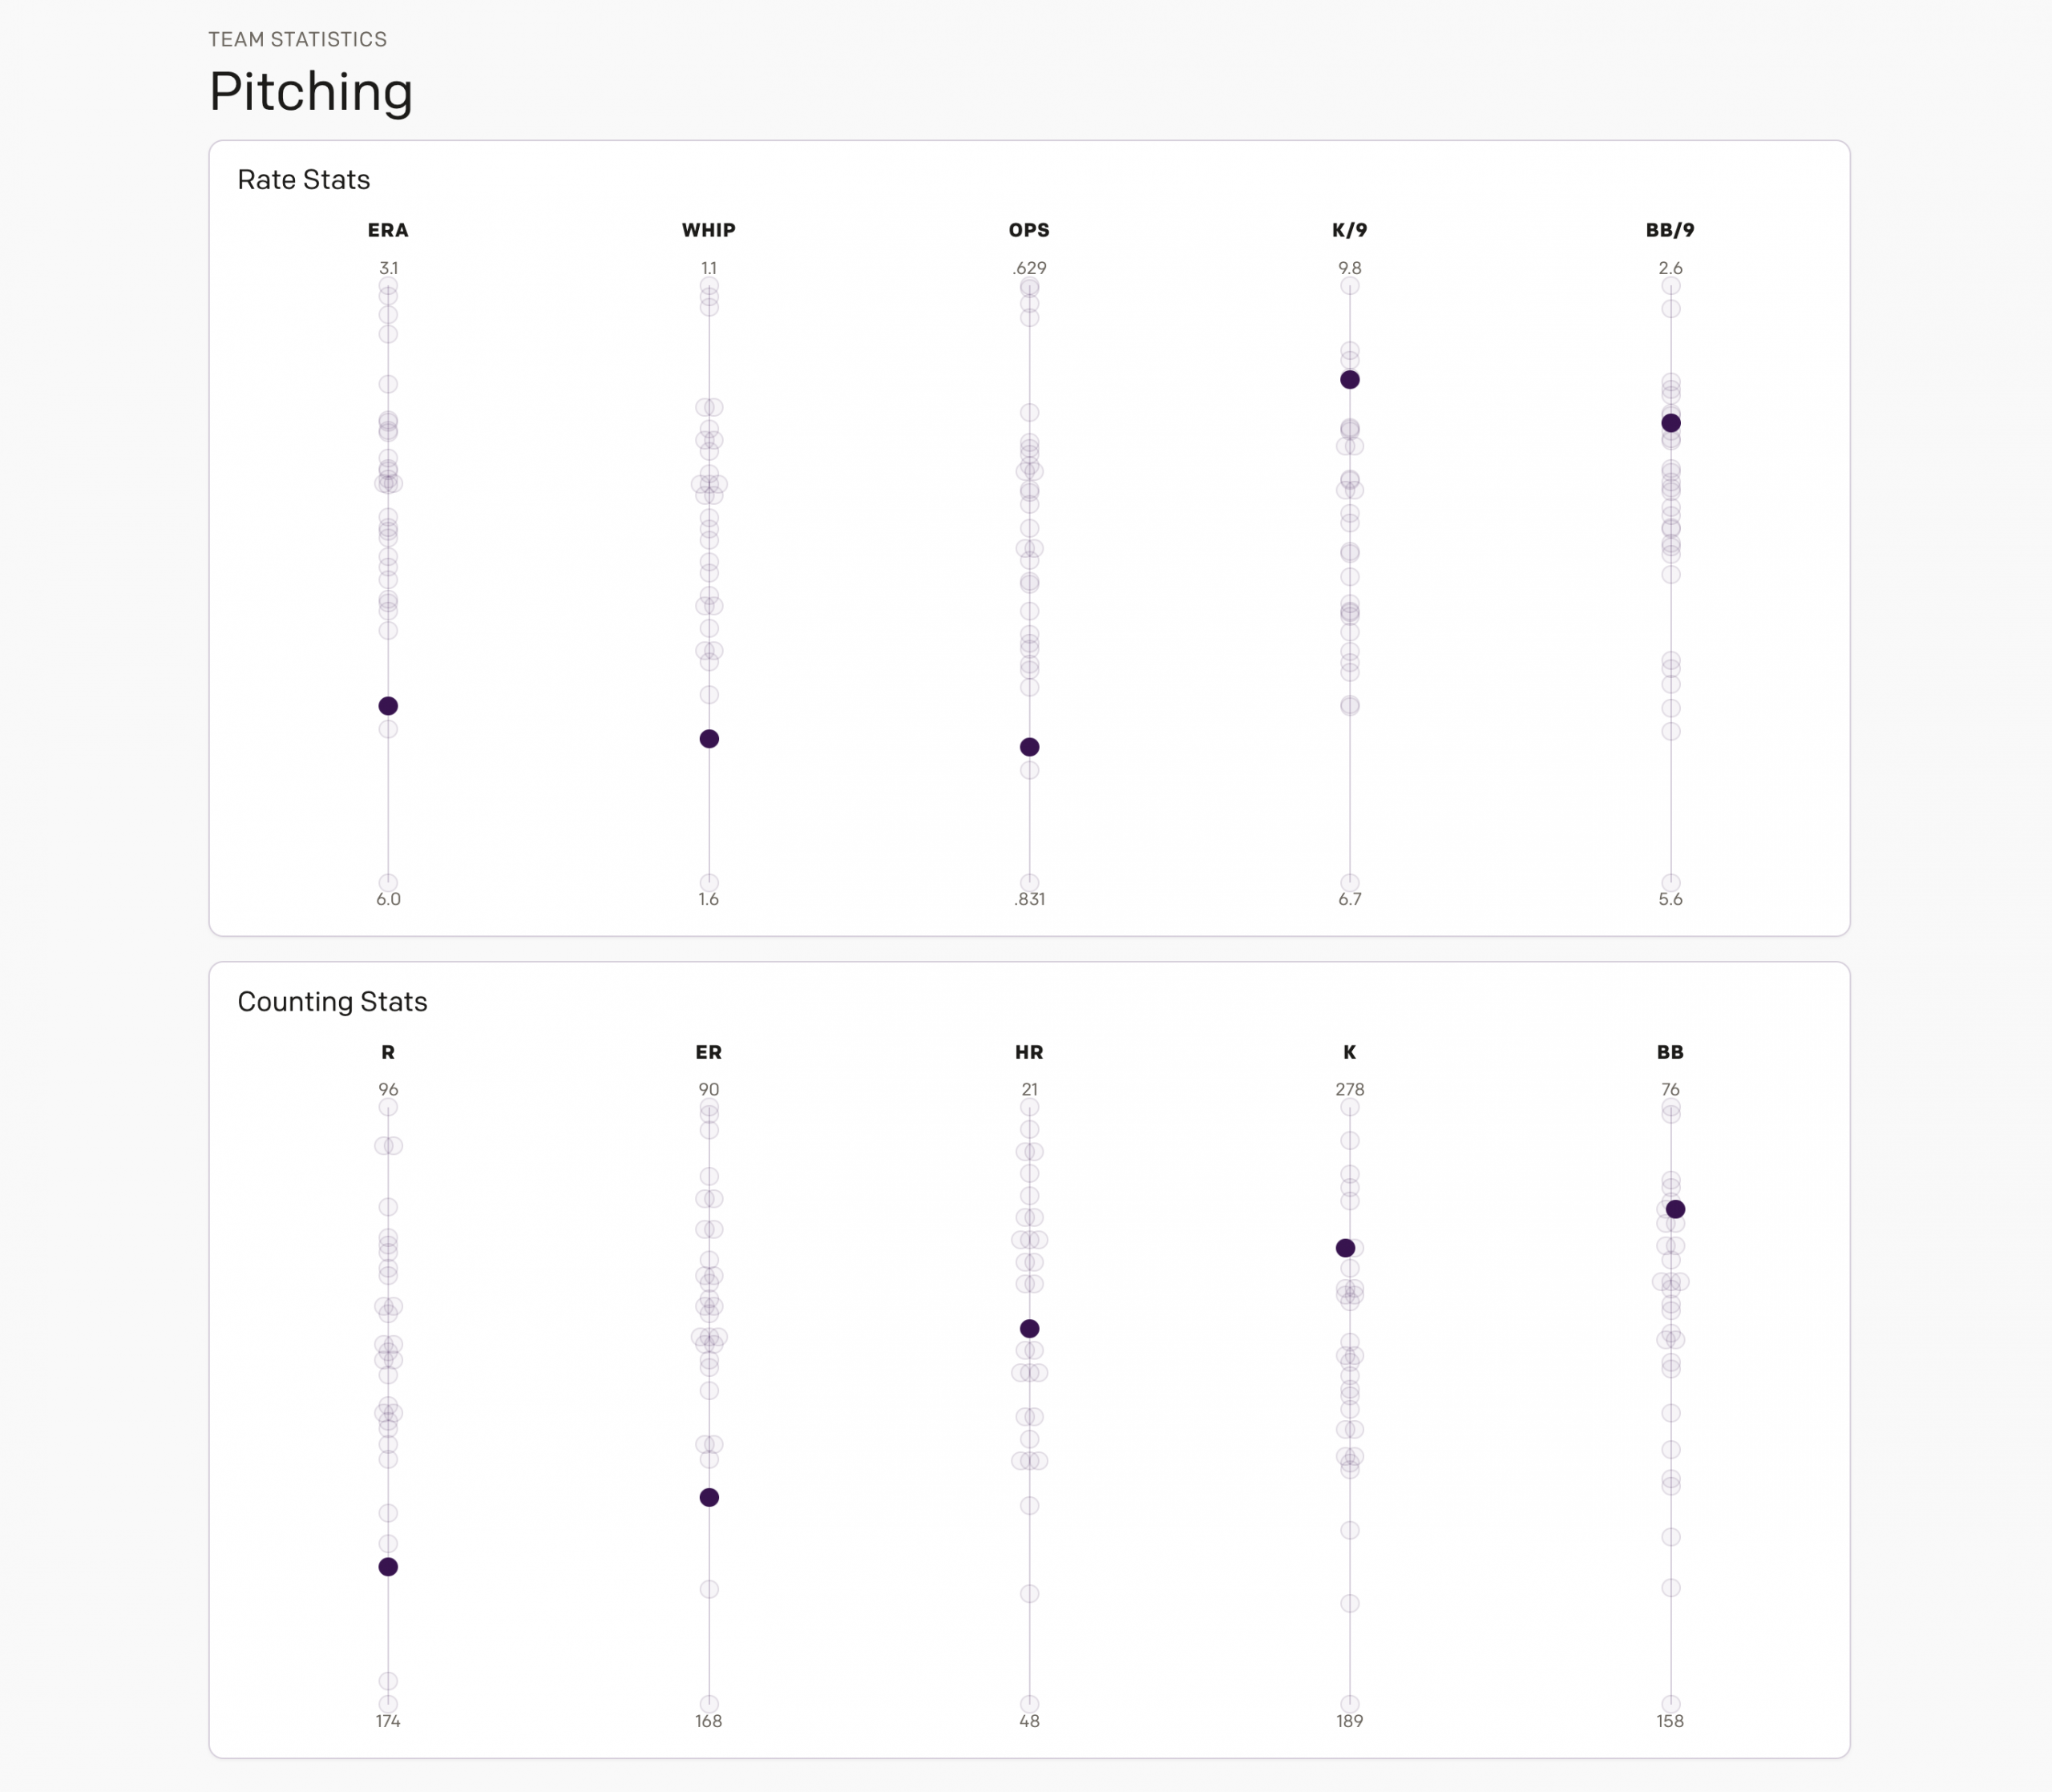
Here we have slightly better performance, but still not great. The only two metrics shown where the Phillies perform well? Strikeouts per nine and walks per nine. But in terms of ERA, walks and hits per inning pitched (WHIP), and opponents’ batting average, the Phillies are ranked near the worst—though the worst, Houston, is significantly worse.
I took two screenshots here for individual pitchers—the rotation starting five. First up, we look at WHIP vs ERA.
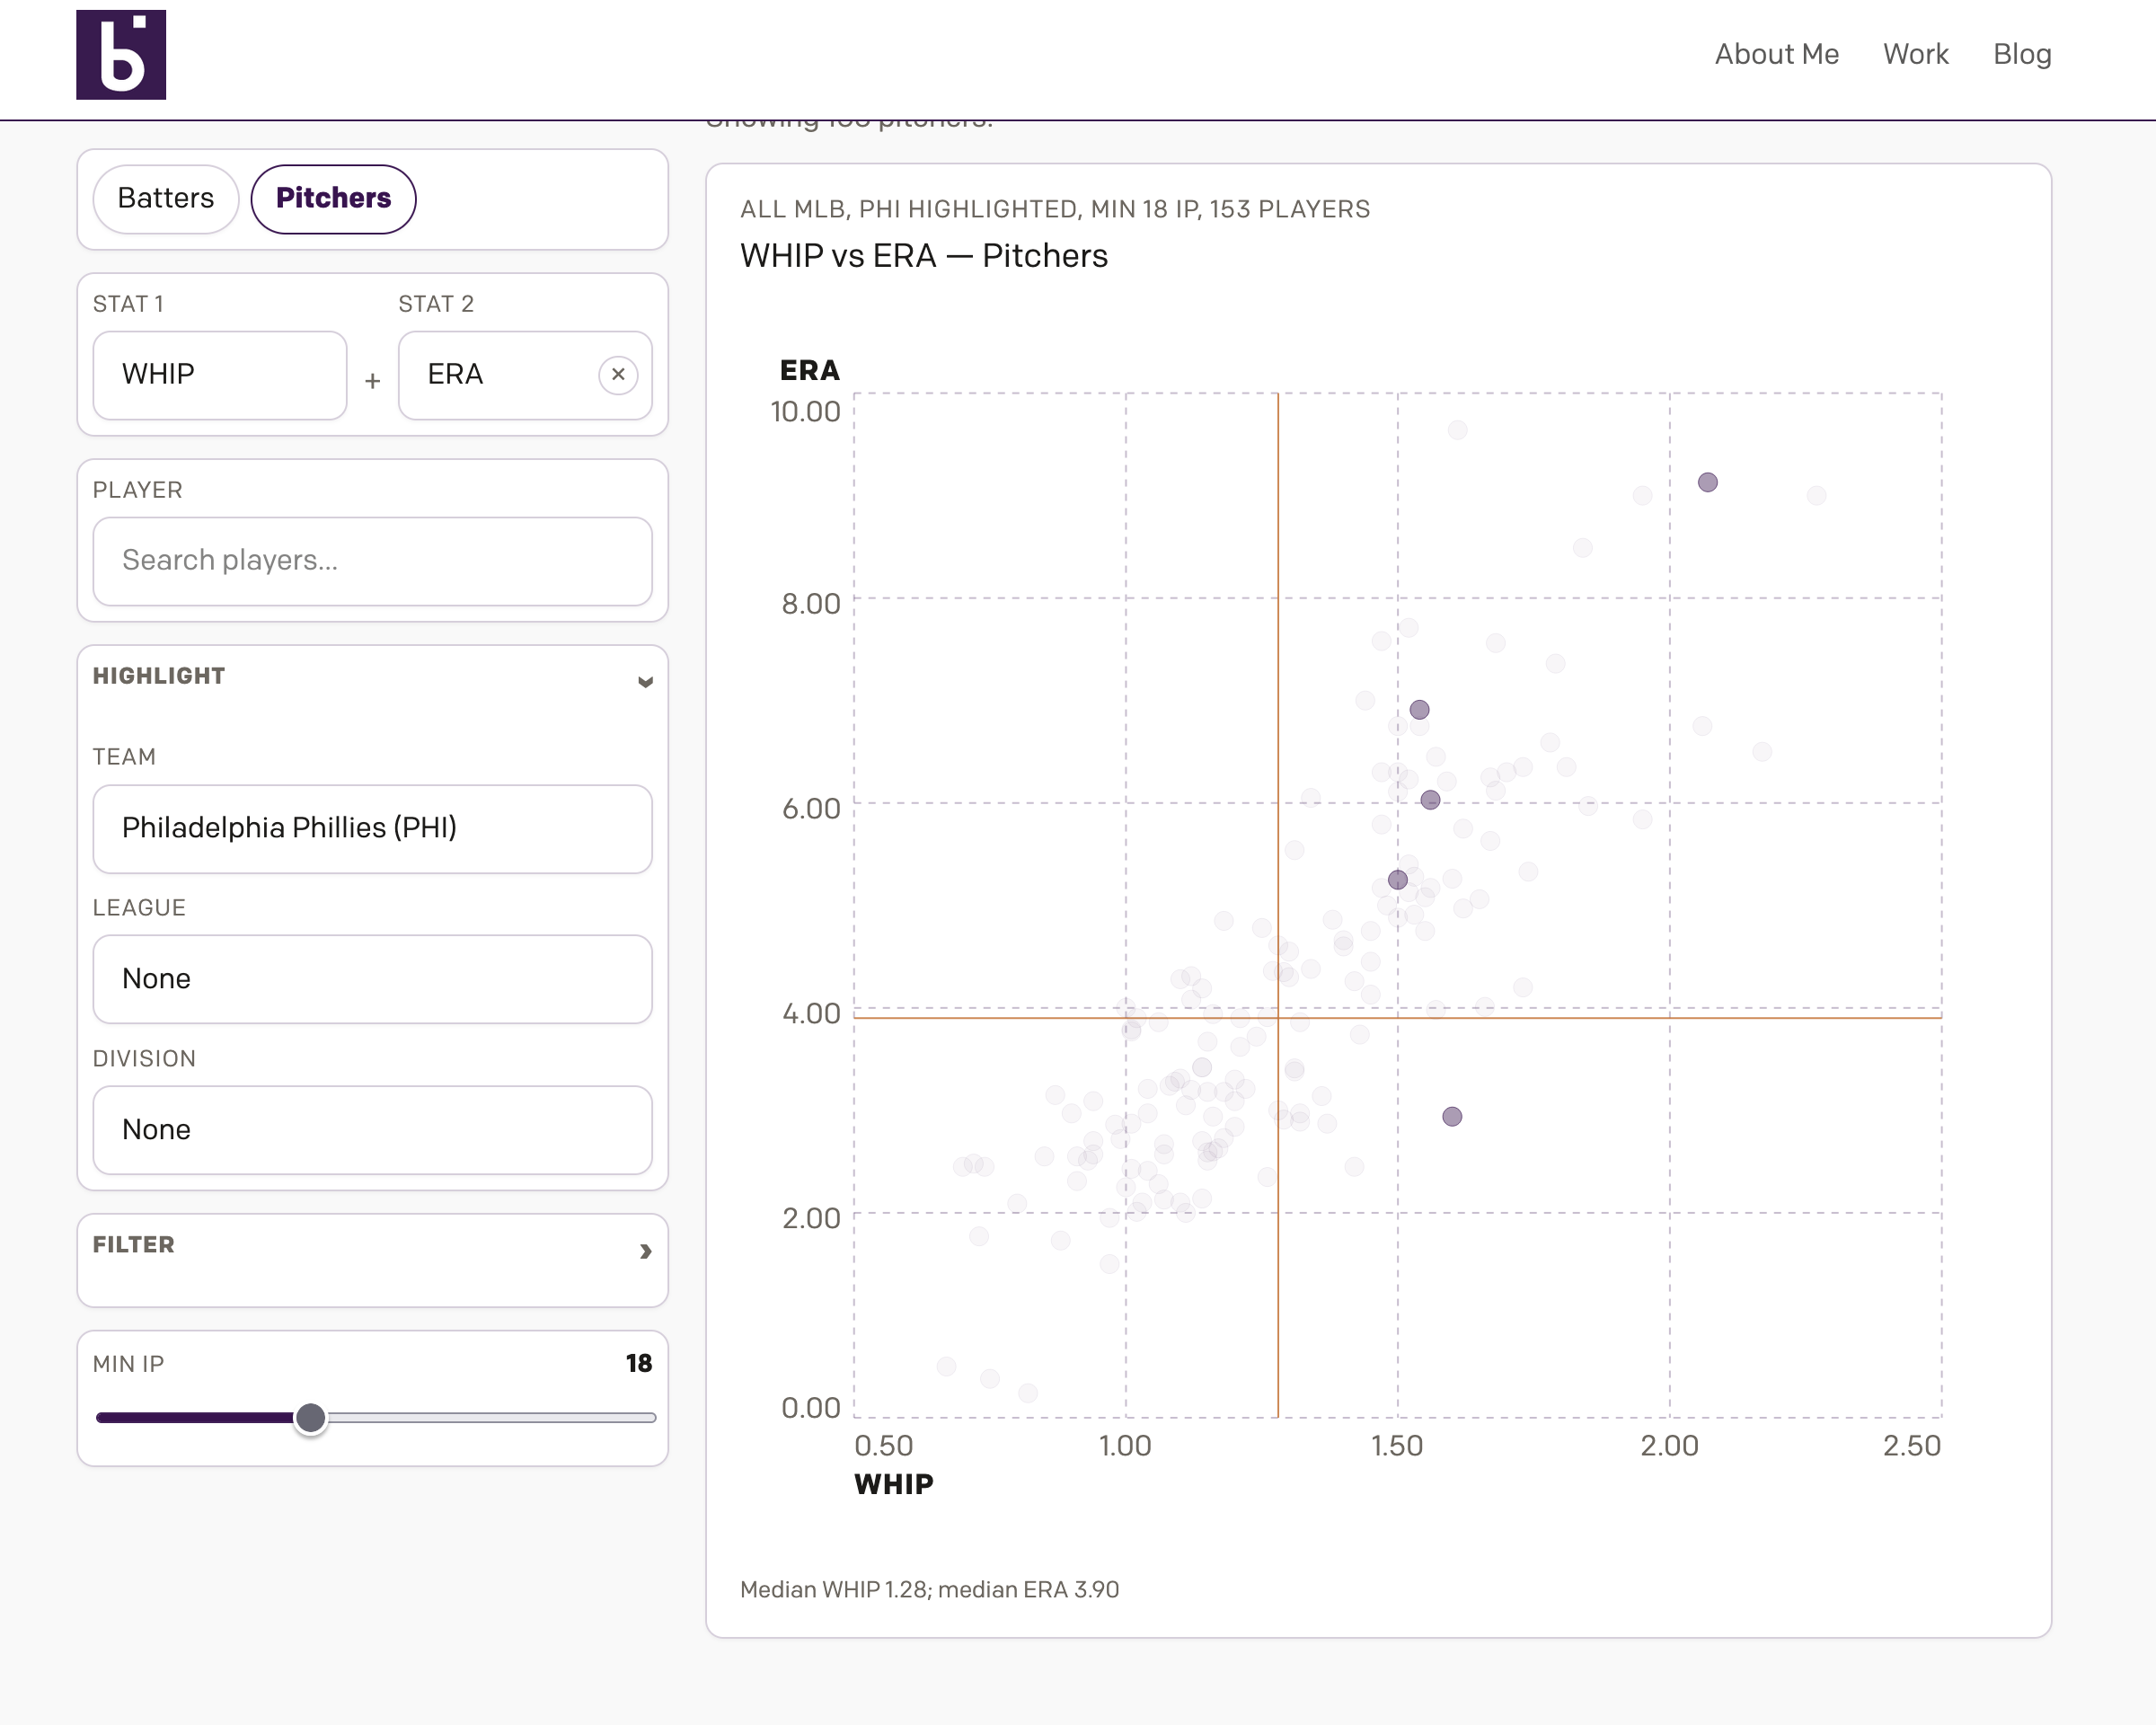
And what you can see is that it ain’t great, Bob. To be fair—sort of—the really bad dot in the upper right is Taijuan Walker, who the Phillies have already released. He has hurt the Phillies this year, but cannot any longer. The other four all have worse-than-average WHIPs, but Christopher Sanchez is the only one whose ERA is better-than-average.
More tellingly, we can look at strike out rate minus walk rate, or K−BB%, and how that compares to runs allowed per nine, R/9. K−BB% is as simple, calculation-wise, as it sounds. But those nerds I referenced on Monday will tell you that it is a good predictor of individual pitcher success. Low walk rates mean pitchers are not giving up free baserunners and high strikeout rates mean not only are they getting outs, but they are getting outs without relying upon the fielders behind them and instead depend upon the quality of their “stuff”.
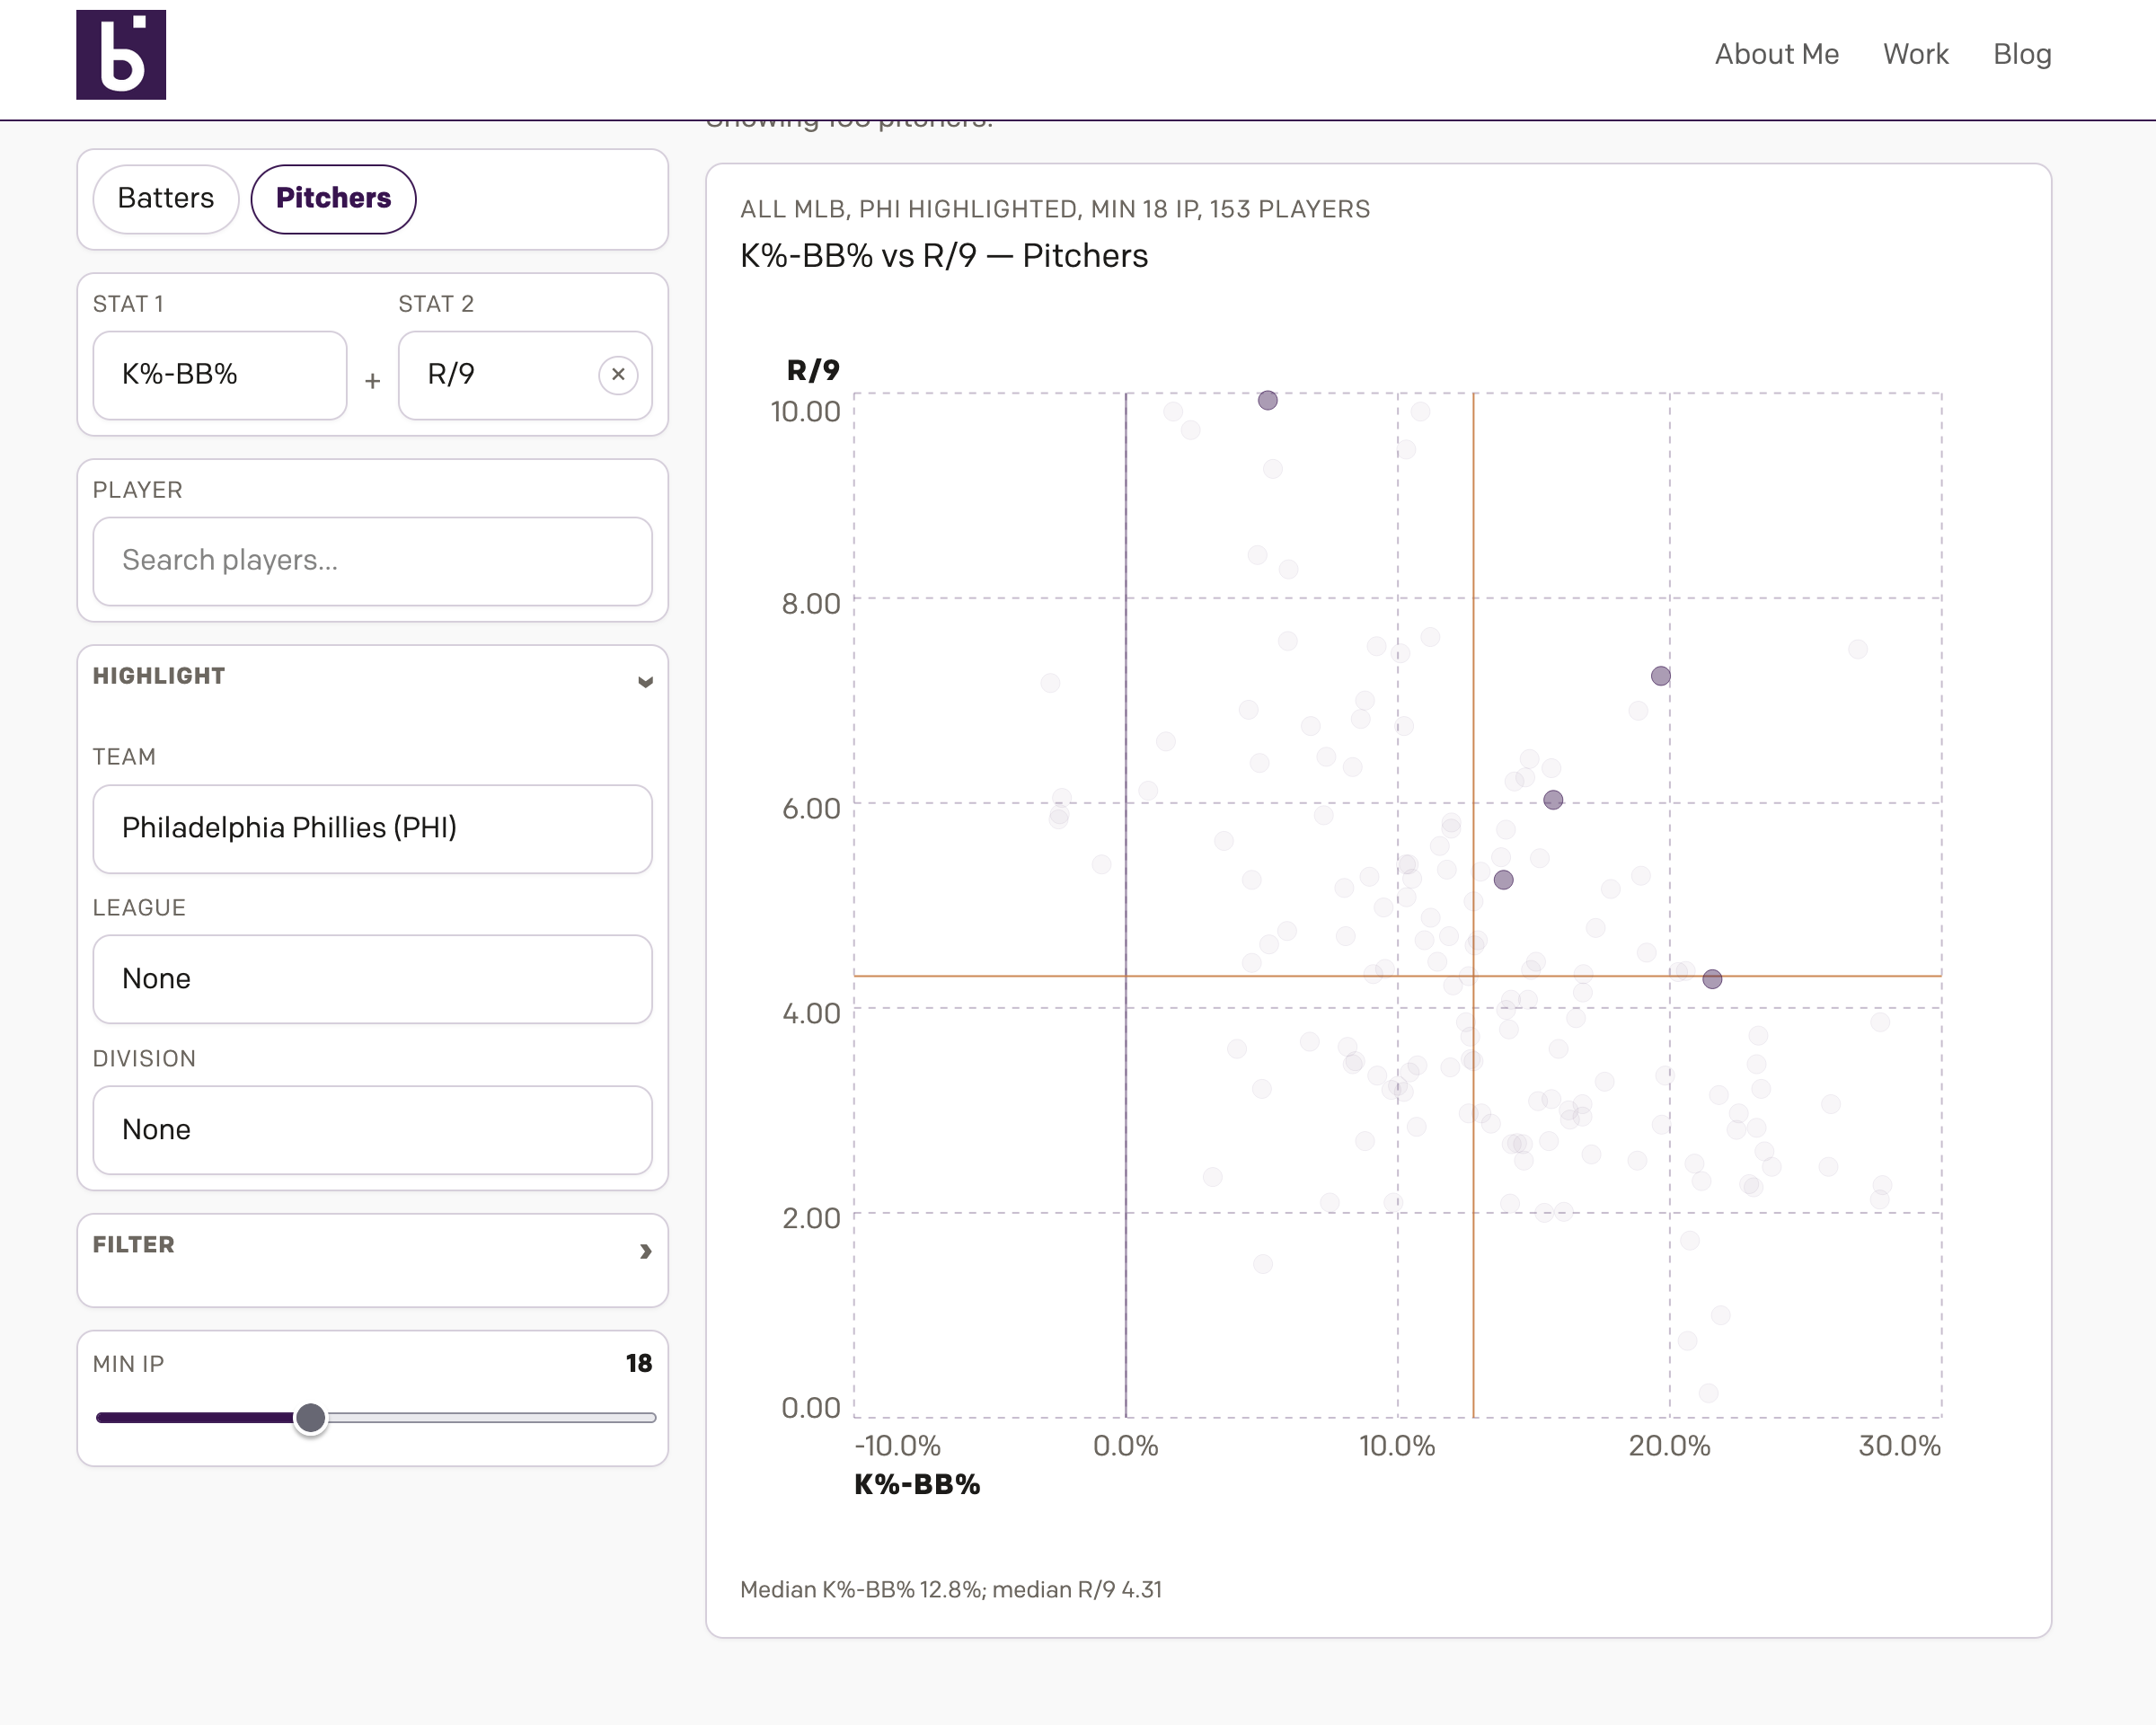
This graphic shows that, with the exception of Walker, the rotation has better-than-average K−BB% rates. But only Sanchez has an ever-so-slightly better-than-average R/9. In time, more time than fewer than 30 games into a season, good K−BB% numbers suggest that pitching performance will improve and even out.
In other words, the Phillies’ pitching performance looks like it will largely right itself if Phillies fans are patient.
As a native of the Philadelphia region, I can assure you Phillies fans are always patient. They are always calm, cool, and collected.
In short, by the end of the year, I expect the Phillies to be absolutely fine—barring injuries. As if to prove my point, I took these screenshots before first pitch last night. How did the Phillies do last night?
They beat the San Francisco Giants 7–0. The Phillies collected 11 hits, admittedly only 3 were for extra bases. And the starter, Jesus Luzardo went 7 innings, struck out 8, gave up 0 runs on 2 hits and 0 walks.
Thompson was not the problem. Small sample size and poor performance to start the year were. Thompson was simply scapegoated.
Credit for the piece is mine.