iPads on eBay

This post comes to us from eBay via cnet. Ebay does a wonderful thing, it fills in the gaps in the marketplace. If you live in, say, the Netherlands, and want something that is available only in the United States, chances are you might find somebody willing to sell it to you from the US.

Among those things that people want are iPad 2s. So here eBay has put together an infographic about their sales of iPad 2s from US sellers to foreign buyers.
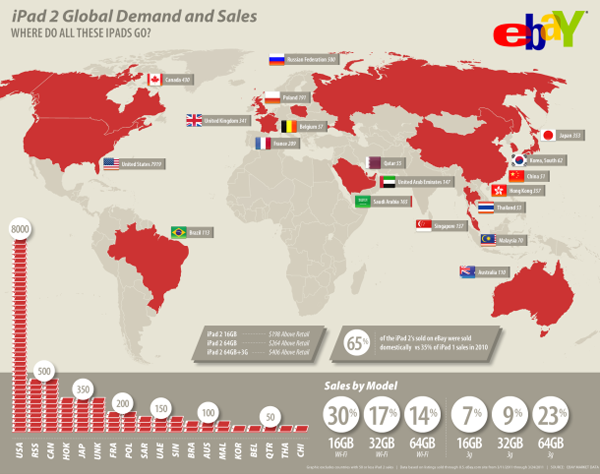
sales of iPad 2s abroad

I must admit to being a bit underwhelmed here. Maps are great and all, but here this map adds nothing to the story except that I can now identify where Poland is. It’s an island country north of Belgium. Or is that France? Wait, what is this lonely sticker-tag for the United Kingdom out in the Atlantic? The data encoded in the map is already present in the datagraphic, if you look to the bar chart of iPad shapes in the lower left quadrant.

But the bar charts do confuse me, I very rarely like using symbols of things for measuring precise numbers of things when those symbols of things represent a number of things more than just one thing. (And that is about as confused as I feel.) And then on another level, I have to strain for a moment to figure out what these three-letter identifiers are. As it just so happens, there is a standardised set of country abbreviations in both two and three letters. When I see UNK, I immediately think Unknown. And RSS makes me think of RSS feeds. Neither connects me to the United Kingdom or Russia.

In the bottom right is the breakdown of sales by model type. Here, where the treatment is simpler we see more success at clearly communicating the information. Could it be more succinct and a touch better organised, yes. But, in all, this is clear and effective. Ergo, it works.

Interestingly, cnet also posted the previous year’s infographic by eBay for sales of the first iPad.
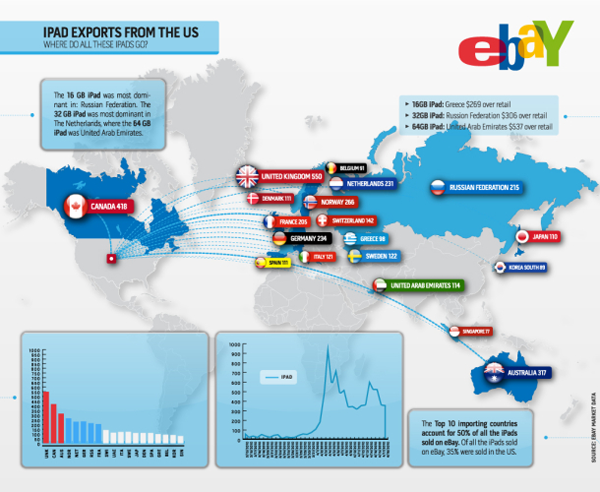
sales of the iPad abroad
sales of iPads abroad

Very loosely (and quickly), I think it is more successful and tells more data. The data on the map, like this year’s, need not be communicated by a map, that much is true—why are the countries two shades of blue, I have no idea if that encodes data. However, the same data is also duplicated in the chart in the lower left quadrant, but here far more succinctly and far more accurately than by weird symbols of the iPad. Last year’s infographic is missing the breakdown by model type, however, instead of those six datapoints, here we have a timeline of iPad sales that, it is safe to say, references more than six datapoints.

In a sense, eBay took a step backwards in their infographics. A pity, because one imagines that if they have the sales data for time periods, they probably have other sets of data that would make for an interesting and richer piece.

Credit to the designers at eBay and cnet for posting the article.

Pie Charts v Bar Charts, Round…Some Really High Number

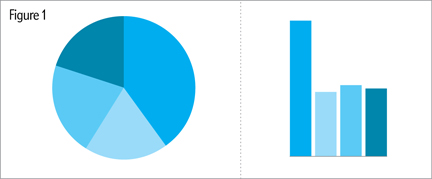
Not strictly a commentary on a piece or project, instead, this is a link to an interesting opinion piece about the Great Infographic Debate, i.e., most loosely and least helpfully, substance vs. style, vis-a-vis the use of pie charts and such vs. bar charts. Where does one draw the line between clear communication and, frankly, just getting somebody’s attention so that one can communicate?

From the article, an illustration of just how bar charts are significantly better than pie charts at clearly communicating data such as which is the largest data point.

The largest datapoint is obvious, but what about the order of those that follow?

Thanks to Ben for the heads up.

Counting People

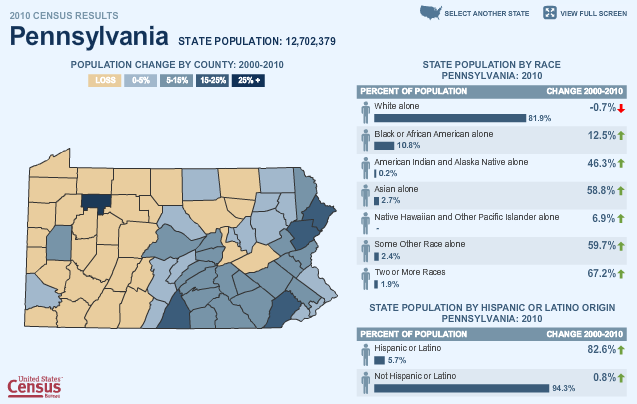
The Census Bureau has been releasing state population figures over the past several weeks and one means of accessing those figures is through a small, interactive map feature. Clicking through makes for some interesting observations—although not all states are currently available. In this screenshot, one can see an interesting story. Western Pennsylvania is shrinking whereas eastern Pennsylvania is growing. And, perhaps importantly, Philadelphia has perhaps reversed its long-term trend of population decline and saw a 0-5% increase in population while its further suburbs have seen increases in the 5–25% range.

census map feature
census map feature

If one is not viewing the piece in fullscreen mode, the navigation can be a bit small, especially for small counties. And the counties over which one rolls with the mouse cannot be selected, they are purely rollover functions that display census data from 1960 and the total population as of 2010. I would have liked the ability to select a particular county and then compare it to others by rolling over neighbouring counties. The colour choice, blues and a light, brownish-beige work rather well within the overall blue motif of the site. And by restricting the palette there, one gains the ability to use an altogether different colour, here green, to indicate which counties are rolled over along with differentiating the rollover box from the remainder of the map piece.

I wonder if more could not have done with the ethnic breakdowns on the right. Certainly the overall breakdown is effective, but it appears to lack a summary of sorts. What was the overall change for the state? And on a minor note, the person symbol is downright distracting.

To get to the first state, one clicks on said state from an overall map of the United States. States are blue if they have had their data released, grey otherwise. However, once looking at a state, there is no way back to the overall map as states are chosen from a small button in the upper-right. This works just fine, we are here to look at state data, not for a geography lesson. However, that they use the map at the beginning seems incongruent with the remainder of the experience. I wonder if they could not remove the map at the start, or keep the map but make it more useful. After all, it would be interesting to see the percentage change in the states displayed—the unpublished states could remain grey.

Further below the first map is a second map.

Census map 2
Census map 2

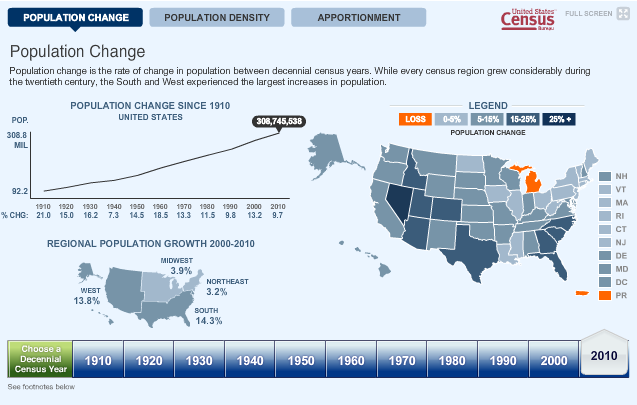
Here, one does have access to the state population change figures. Much of the critique above remains salient here, except the light brown for population loss in the first map is here replaced by a garish and obnoxious orange. An interesting addition is the range of historical data, from the 1910 census through the 2010 census and to see how those population changes affected the apportionment of seats in Congress. Another interesting story that one can glimpse is the ‘filling-in’ of the North American continent. Population density in 1910 was high only in the Northeast, but ever since, the people have spread, concentrating along the coasts and then moving inwards towards the vast centre of the continent.

Having Your (Presidential Birthday) Cake and Eating It Too

Presidents’ Day originally celebrated the birthday of George Washington, the first president of the United States. (Though, one could get crazy and say it was actually Samuel Huntington, but I fear I would digress.) Now technically the holiday still does celebrate Washington as the official name of the federal holiday is Washington’s Birthday, but by and large we group folks like Lincoln in there too.

Regardless of who exactly is remembered, we remember a United States of the 18th and 19th centuries. And thus it seems appropriate to share a piece from Charles Blow over at the New York Times.

United States' Ranking

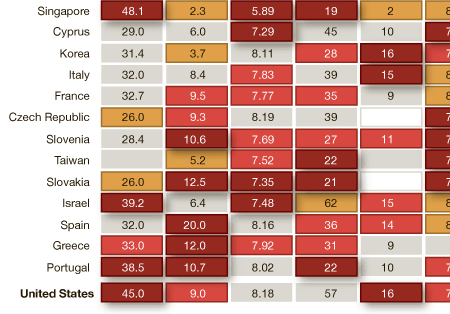
The information graphic is a heat chart of various rankings and index numbers that compare the United States across various metrics to the rest of the world’s “advanced economies”, as decided by the IMF. I certainly have some issues with a few of the metrics, for example what exactly does Gallup mean by percentage of people thriving? And are the math and science scales out of 600 total points? I presume as much but cannot be certain. These could have briefly explained in the footer, or similar to how the food insecurity metric is handled—though I suspect that would be too much from an aesthetic standpoint. The use of drop shadows, from a design perspective, I disagree with; the dark crimson should surely be enough distinction to stand alone. And for completeness, I would have included what appears to be the beigish middle ground between the best and the worst in the scale at the top of the piece.

As to the story the piece supports, I leave that for the audience to decide. Is the United States of the President Obama/Bush as great as that of President Washington/Adams?

South Sudan

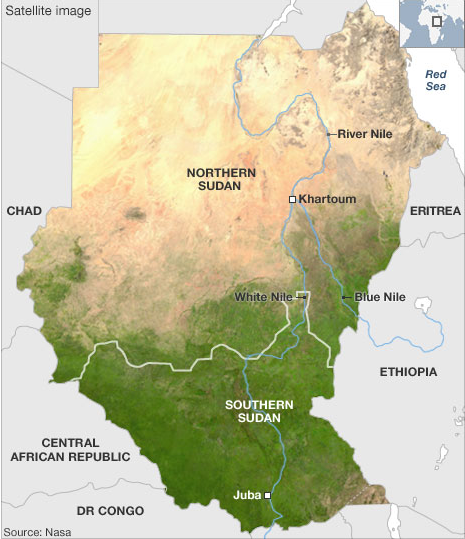
For those who may not be aware, part of Africa’s largest country is holding a referendum on whether it should remain a part of Sudan or secede and become an independent state, Southern Sudan—though one wonders if they would not come up with a different name. About 2005 a peace agreement all-but-ended a decades-long civil war in Sudan and as that violence subsided the attention in Sudan shifted to Darfur. The terms for the peace deal included a referendum on independence for Southern Sudan, long since joined with the northern half of Sudan as part of a British colony in Africa to control the Nile River.

Map of Southern Sudan

The two halves of the country were and are very much different and the BBC has used maps to highlight these differences. The problem is that there are oil fields along the proposed border and a disputed region, called Abeyi, has significant deposits of its own. And so the question of who controls the oil and thus the money and the power remains. That, however, is a story for another post. This is just to highlight the maps.

Overall, not bad. I find using the different hues for the different subject matters a smart idea. The shift forces the audience to focus on the change in meaning, which is very important if the shape of the coloured area is not otherwise changing. That said, the infant mortality choropleth uses too great a shift in hues between data bins when compared to the water, education, and food security maps. The oil field map, while not necessarily a data-heavy map in the same way as the choropleths, is a nice bookend to what started the series, i.e. the satellite view. These highlight the sheer environmental and, in a fashion, economic differences between the two regions of Sudan.

I find the ethnic groups map, however, the most difficult to fit into the series. Certainly from a subject matter it is the most important. However, the colours chosen to represent the various ethnic groups seem disparate. The southern Dinka, for example, are represented as an olive-green whereas the northern Beja are more of a bluish-green. I think a better solution would have been to keep the three main groups, i.e. the Arabs, Northern Sudan, and Southern Sudan, and then assign each a different hue, for the sake of an example say the three primary colours. Then within those groups, different tints for the various but related ethnic groups. This would highlight the various ethnic groups existing across Sudan, but show the geographic split between the two groups.

Overall, a good effort from the BBC to highlight the stark differences between Northern and Southern Sudan.

The Candidate Says Tweet Tweet

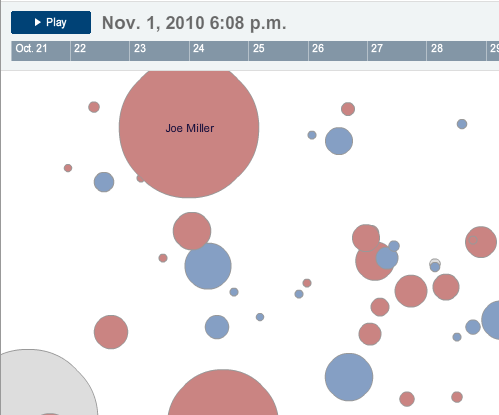
Yesterday, the New York Times released this interactive piece to look at the popularity of particular candidates in that seemingly ubiquitous world of Twitter. Perhaps it was inevitable that the Times or somebody else would create something like this. Regardless, it is out there and I have to say, I am left confused.

A cropping of the interactive piece.

No, not by the how it works. I understand that more activity makes for larger bubbles. (Although at this point I shall refrain from my usual diatribe on bubbles.) And if you click on a particular bubble/candidate, the vector and colour of the little bubbles describes the type of activity. Understand? Check.

But why are the bubbles placed where they are on the screen?

Perhaps the rationale is explained somewhere…but I have yet to find it. And after sitting down with a colleague yesterday, the two of us could not quite figure it out. Vaguely one gets the impression of representing actual geography—except for things like Delaware being in the bottom corner. Perhaps the bubbles’ centre points are randomly generated? They do not appear to be on separate loads of the Flash piece.

And so I am left with the thought that the bubbles are a needless distraction and, in fact, lead to greater confusion. What if, for example, the candidates were not bubbles but bars? The bars would create a visual rhythm as they grow and shrink and each could be clickable. One could sort the bars by some sort of a hierarchy: alphabetic, geographic, political, &c. You could even still click on a bar for more detailed views and perhaps do some other neat things.

I am just left scratching my head on this one.

Growing Pains

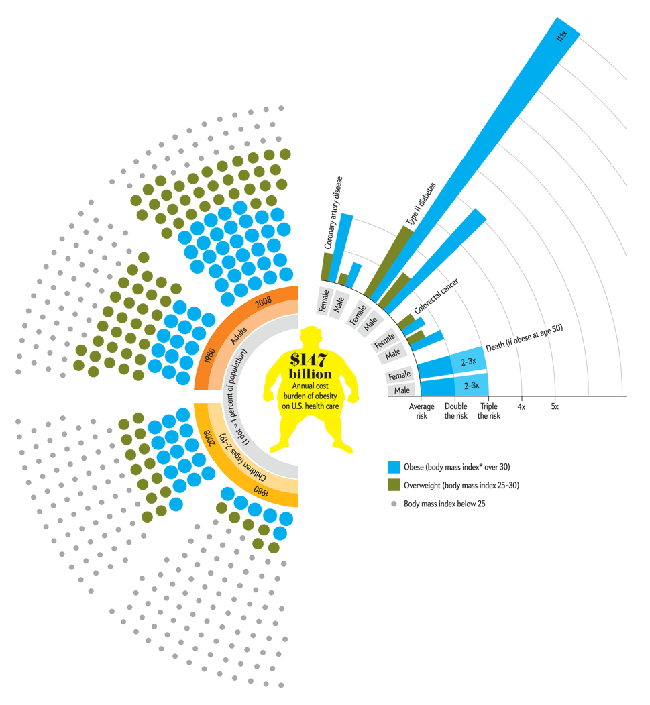
An information graphic looking at obesity in the United States

This piece comes from my coworker, Ben, who found the graphic in Scientific American. Broadly speaking the piece is looking at the obese and the overweight in the United States, comparing the numbers of both children and adults in 1980 to 2008. These numbers are supplemented by the risk of death posed to both men and women from a few different causes. (I know at least diabetes is linked to weight, but as to whether the others are linked I am unaware.)

I have a few quibbles with the piece; for in general I think educating the public about the health risks of obesity a worthy endeavour. From a more scientific-ish point of view, as I recall, BMI (body mass index) is not a particularly useful tool in determining obesity because it fails to differentiate people who are heavy with fat from those who are heavy with muscles. A strong and regular weight-lifter is not necessarily overweight, but simply has a lot of muscles. Does that make the weight-lifter less healthy than those with lots of body fat? Methinks not.

From the data side, I am curious to know why only the two years? It may very well be that they are the only two years for which relevant data exists. But I doubt that. 1980 compared to 2008 is interesting, but perhaps already well-known. What would perhaps be more interesting is whether over the past few years, the increasing attention paid to weight and other health issues has begun to affect the growth of the obesity problem—poor pun very much intended.

The accompanying text makes a point about the number of adult Americans being obese. Certainly the dots as a percentage of the population achieve that goal of showing percents—though I hasten to add that their arrangement around the body in the centre does very little to aid in comparing the adults of 1980 to 2000 let alone the children. And as to the children, the article points out that they are growing fastest. At this, however, I can only take the authors at their word for the graphic does nothing to visualise this statement. Perhaps they outgrew the adults—but then the adults were themselves at one point children, but that is another matter—but their growth could now be slowing as a recent turn of events. But since we only have two years, we cannot know for certain.

The risk of death by [type of death] is interesting. But running bar charts as more of a radial chart could become a bit confusing. Is there any reason the bars grow in width as they extend further out? Or was that part of an all-too-obvious play on the problem. After all, the growth in area could be significant; a simple line of constant stroke to a point along the radial distance markers would have sufficed. And then I would be particularly curious to know whether any of these types of death are related to obesity. Neither the article nor the graphic provide any clues besides whatever knowledge the viewer brings to the table. (Okay, I think I am done with the puns.) And if one happens across the article with almost no knowledge of what diseases or medical conditions are caused by obesity, how does the graphic tie into the cost of healthcare costs brought upon the country by obesity.

Overall, I think the graphic is well-intentioned. The public is becoming more accustomed to seeing data visualised. However, we need to make certain that we are communicating clearly by making datapoints easier to compare. (Looking at things across half of a circle is a bit tricky.) And then we need to make certain that the data we are visualising supports our statements. (Are children really the fastest growing? Over what span of time?) And then take the time to explain to the audience those things that may not be common knowledge. Does that mean dumb a piece down to the lowest common denominator of someone who has absolutely no knowledge? No. Design needs to elevate and educate its audience. Perhaps some of the finer details remain unexplained because of sheer complexity, but when amidst a host of details well-understood, that confounding bit may push an unsure viewer to do some additional research and educate him- or herself about the subject matter. And that, surely, is not a bad thing.

It’s the Economy Stew-pot.

Oh Cal Richards…

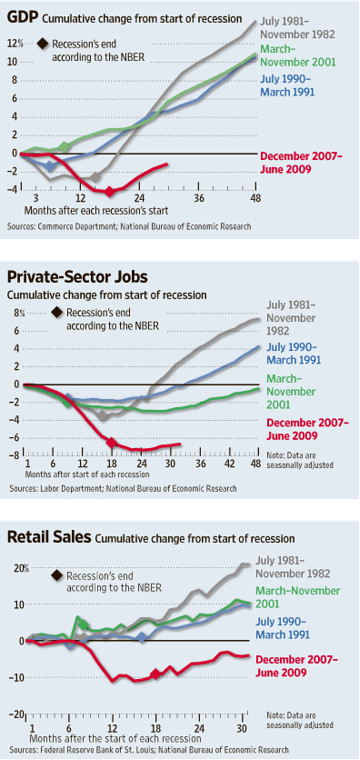
But anyways, according to the National Bureau of Economic Research—the people who declare when recessions and such begin and end—the recession that began in December 2007 ended in June 2009. Good news of a sort. And so naturally the press covered it, including the Wall Street Journal.

They included this image:

Three Charts of the Recession as Compared to Earlier Recessions

One, the drop shadows are unnecessary and the giant diamonds hide the actual turning point. The former could be eliminated and therefore allow the line to have greater, crisper detail as the colour should be enough to differentiate the lines. The drop shadow just sort of blurs everything together. The diamond could either be smaller or simply denoted on the timeline and thus allow the entirety of the line to be shown.

What I do appreciate, however, is that the first two charts show the same timeline and therefore allow for an easy comparison of the GDP turnaround to the jobs turnaround. And as one can see, while the recession has ended, if this most recent one is to follow in the paths of its predecessors, jobs will be a long time in returning to pre-recessionary levels.

Turkey Votes…Against Orange

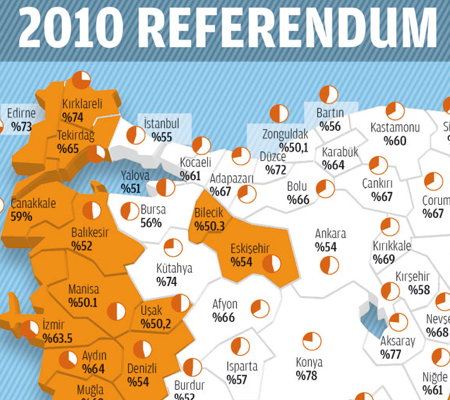
Turkish Vote Results

I like maps, I really do. And I also like politics. And that means I love election maps. Or just voting maps. This here comes from a Turkish news outlet, Today’s Zaman, via the Economist’s article on the election. A (very) brief background for those unfamiliar with the matter at hand: Turkey wants to be admitted into the European Union (EU), but the EU requires reforms made to the Turkish constitution to bring Turkey up to EU standards in terms of law, liberalism, &c. All well and good, except that Turkey has a unique history of being a staunchly secular country where Islam is the dominant religion. Relaxing the rules against Turkey’s strict brand of secularism has stoked resentment and controversy from those on the staunchly secular side. And the constitutional changes that upset this group of people are being enacted by a political party whose history is that of a party based in Islam. It gets a bit tricky…

But about the graphic…

First, I think a good if not expected place to start is with the three-dimensional pie chart and map. These two visual elements add little if not subtract from the overall graphic. By putting the ‘No’ vote in the background it is made to appear smaller than the ‘Yes’ vote and can be seen as marginalising that portion of the vote. Furthermore, note the change in the colour of the type for each section of the chart. While the orange and white is certainly a high contrast, the black versus white is even higher.

As to the map, I am not an expert in Turkish geography, but this appears to simply be adding a weird three-dimensional effect to the edges of an otherwise flat map. At least I should hope the map is otherwise flat and not distorting the geography. One can always make the argument that a map is not needed to show a single datapoint, in this case the ‘victor’ in the vote. However, from the perspective of an American not familiar with Turkish provinces (assuming they are indeed called provinces), this map is far more meaningful than would a statistically  more valuable chart highlighting the discrepancy in the vote. After all the little miniature pies in each province are largely useless except in the most obvious of differences. To actually show and detail the degree of victory a bar chart for all provinces would be more useful.

Or perhaps a compromise that would show each province in a colour that reflects the overall victor, yes or no, and the degree to which that camp beat the other through use of a gradient. Would that be ideal for showing the details of the numbers? No, not at all, but it would highlight that while the ‘No’ vote was concentrated along the western and northern provinces—do they share a political similarity because of their bordering on the Aegean or some other reason?—but that the strongest ‘No’ vote was in the very northwest—geographically the most European part—of Turkey, excepting some exceptional province in the centre of the country. None of this, of course, deals with the density of the population in each province, for none of that is known to me as a non-Turkish observer.

The colours, white and orange, work when considered against the blueish background. Of course, why the bluish background? It might be a branding element or some other such visual styling well-established with the news outlet with which I am unfamiliar. But if not, it does not really add anything other than that glossy feel. The white as a choice for the ‘Yes’ vote is interesting, because it draws more attention to the presence of the ‘No’ vote in the north and west whereas the positioning of the wedges of the pie in the pie chart would hint that the important element to draw forward is that of the ‘Yes’ vote. In terms of the message or the thesis of the graphic, I am unsure. However, using white to allow the orange to come forward is itself a nice visual touch to bring out one or the other camp. Now if only I could figure out which the graphic was going for…

All in all, it is an interesting piece that puts the news story in more context than I might typically read in a straight, text-only article. It has some flaws, but that might be owing to my perspective as an outsider looking in.