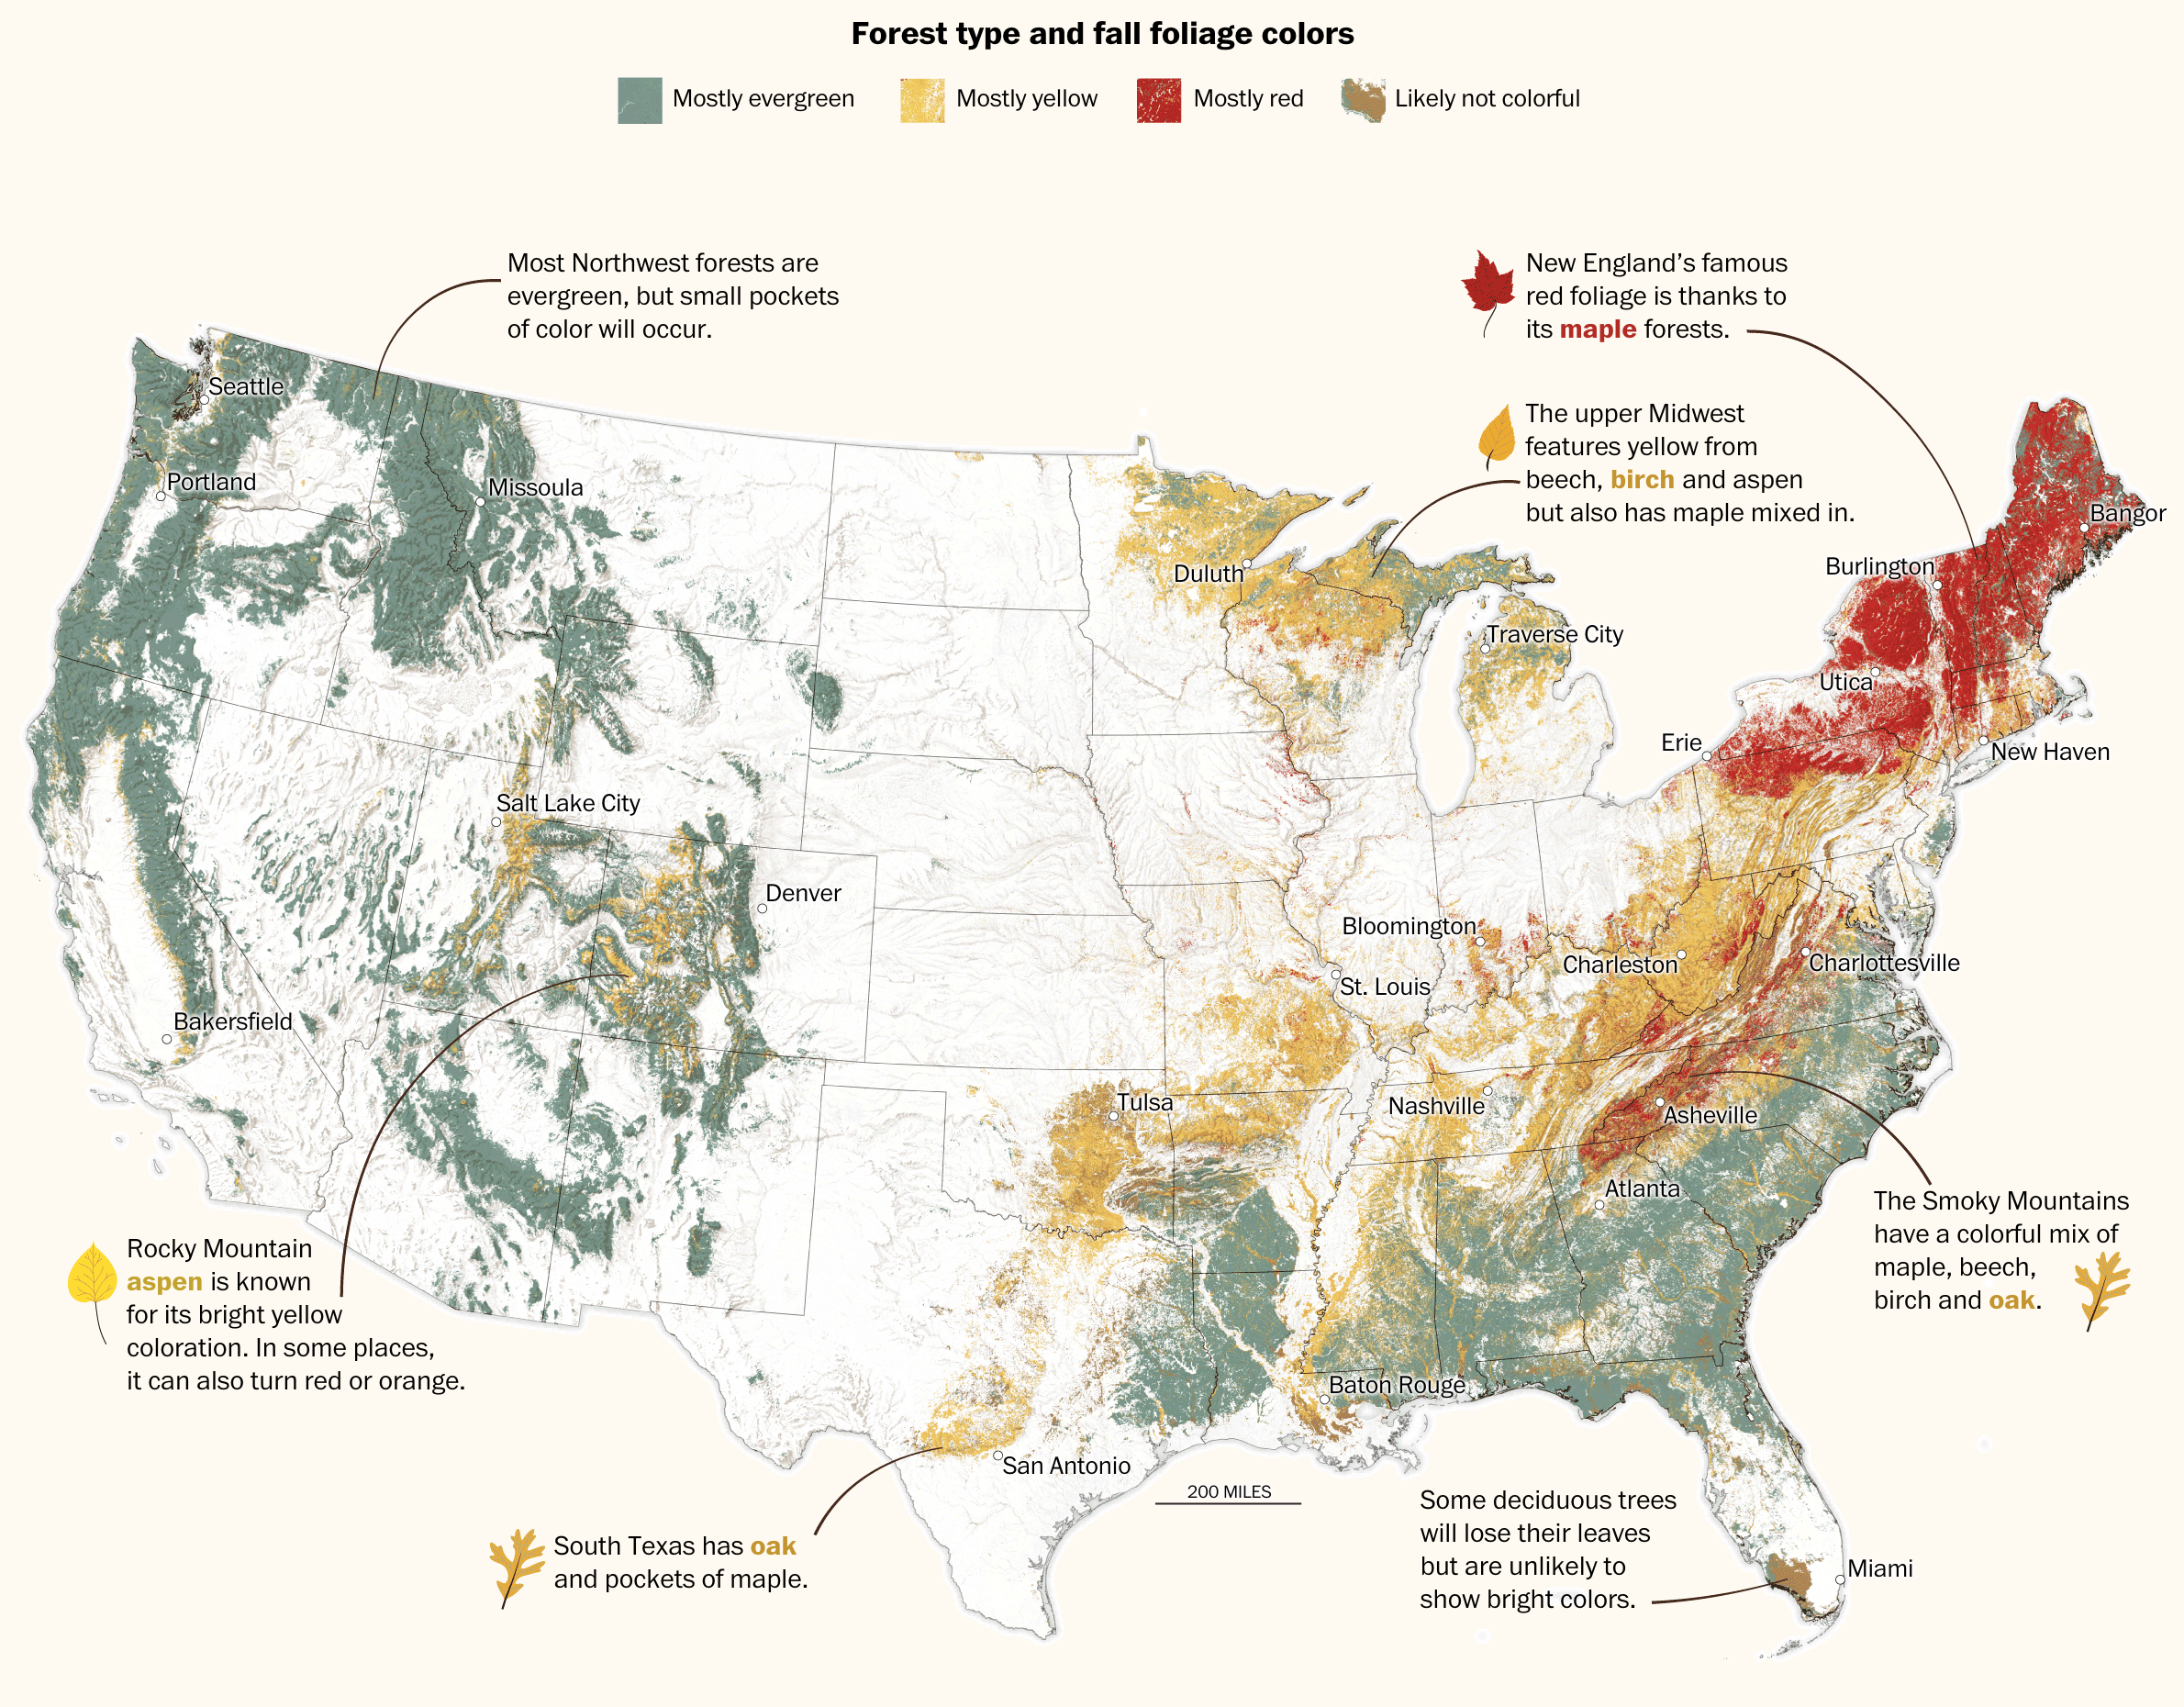
Depending upon where you live, autumn presents us with a spectacular tapestry of colour with bright piercing yellows, soft warm oranges, and attention-grabbing reds all situated among still verdant green grasses and calming blue skies. But this technicolour dreamcoat that drapes the landscape disappears after only a few weeks. For those that chase the colour, the leaf peepers, they need to know the best time to travel.
For that we have this interactive timeline/map from SmokyMountains.com. It’s pretty simple as far as graphics go. We have a choropleth map coloured by a county’s status from no change to past peak, when the colours begin to dull.
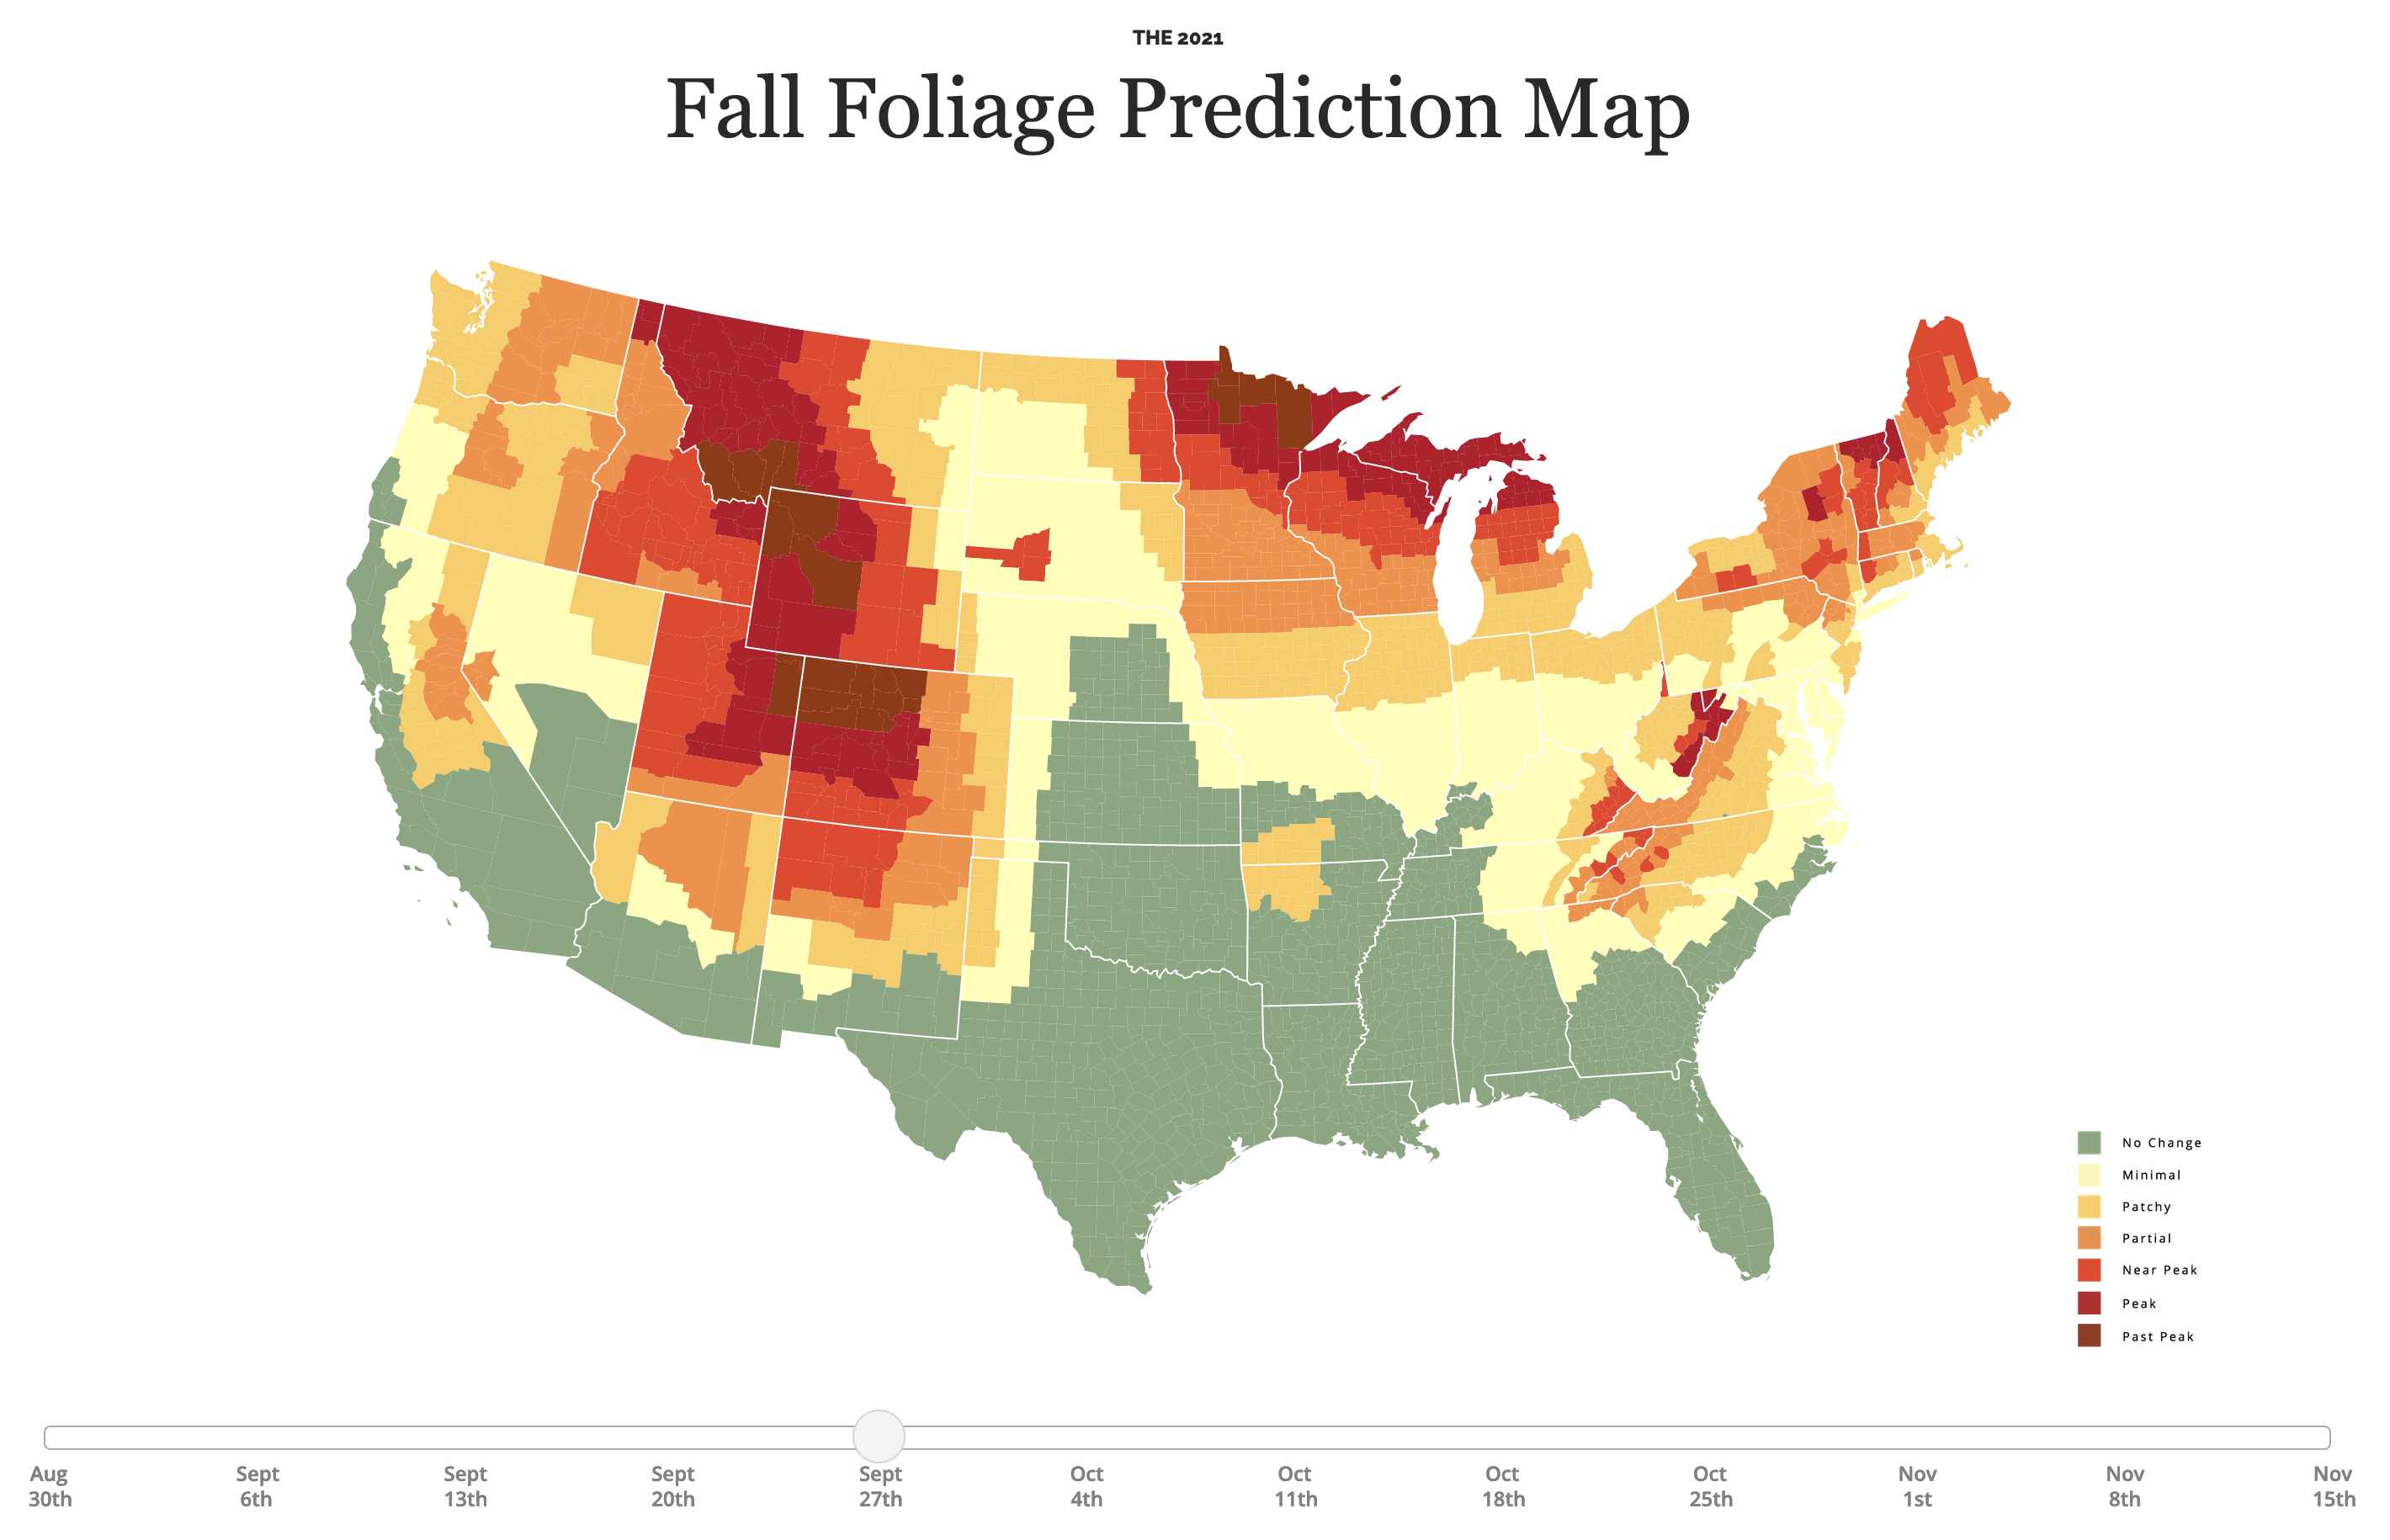
The map itself is not interactive, i.e. you cannot mouse over a county and get a label or some additional information. But the time slider at the bottom does allow you to see the progression of colour throughout the autumn.
Normally, as my longtime readers know, I am not a fan of the traffic light colour palette: green to red. Here, however, it makes sense in the context of changing colours of plant leaves. No, not all trees turn red, some stay yellow. Broadly speaking, though, the colours make sense.
And to that end, the designers of the map chose their colours well, because this map avoids the issues we often see—or don’t—when it comes to red-green colour blindness. This being the reason why a default of green-to-red is a poor choice. Their green is distinct from the red, as these two proof colour screenshots show (thanks to Photoshop’s Proof Colour option).
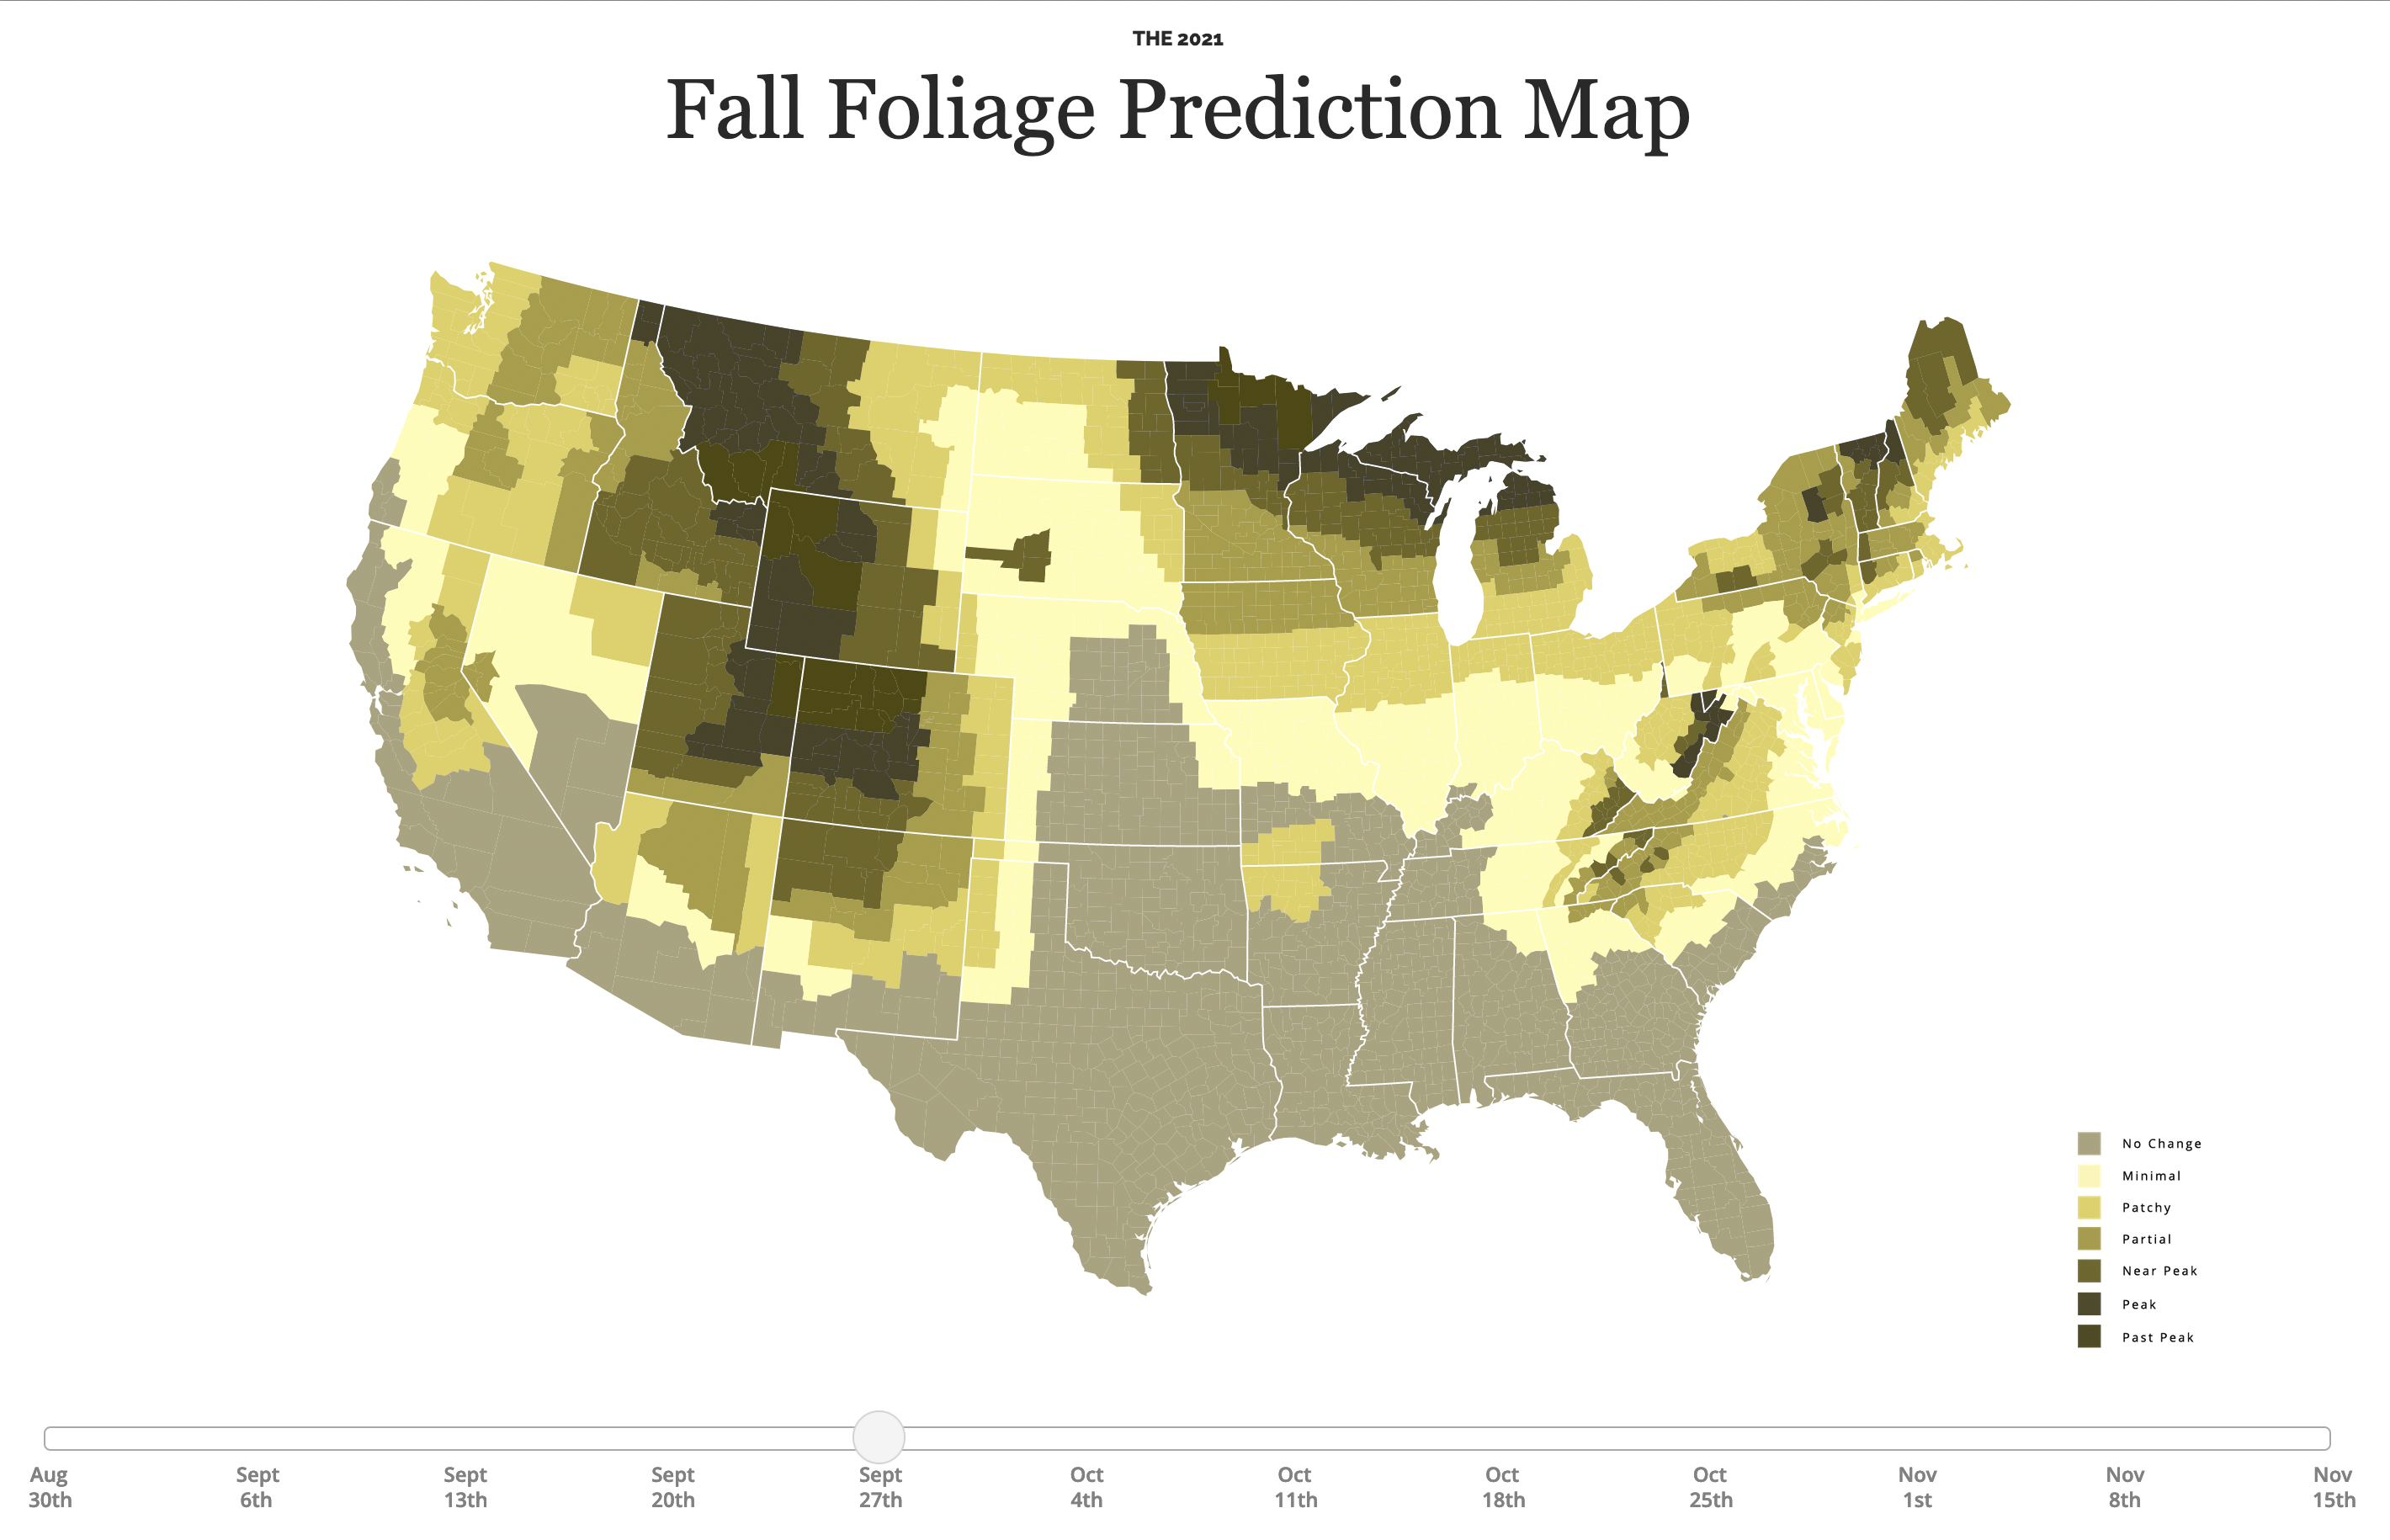
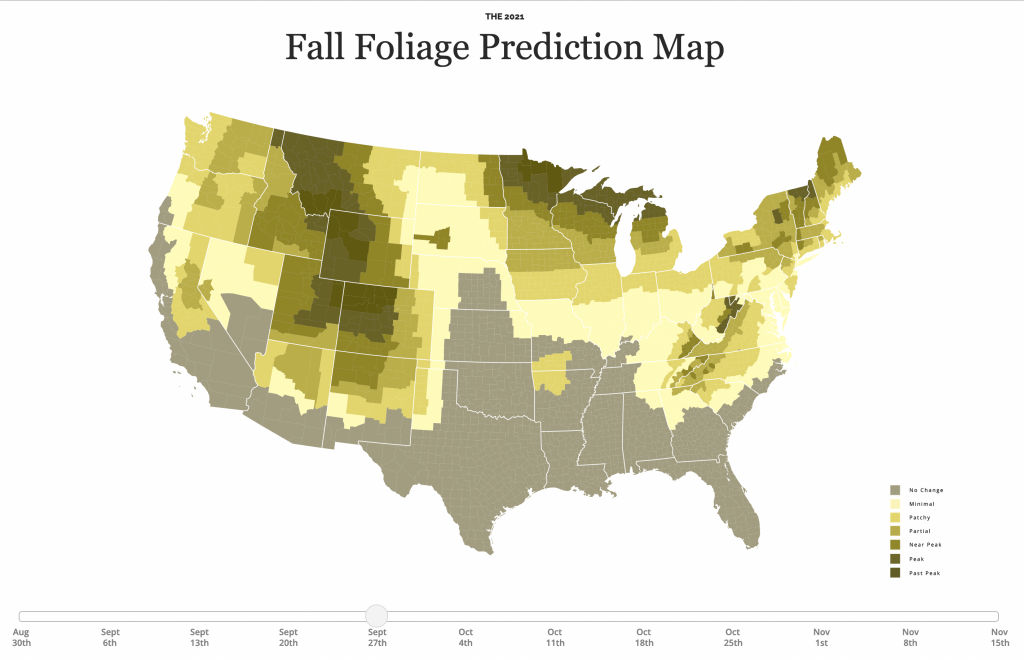
The choice isn’t great, don’t get me wrong. You can see how the green still falls into the shades of red. A blue would be a better choice. (And that’s why I always counsel people to stick to a blue-to-red palette.) Compare, for example, what happens when I add a massive Borg cube of blue to the area of Texas and Oklahoma—not that you have a choice, because resistance is futile.
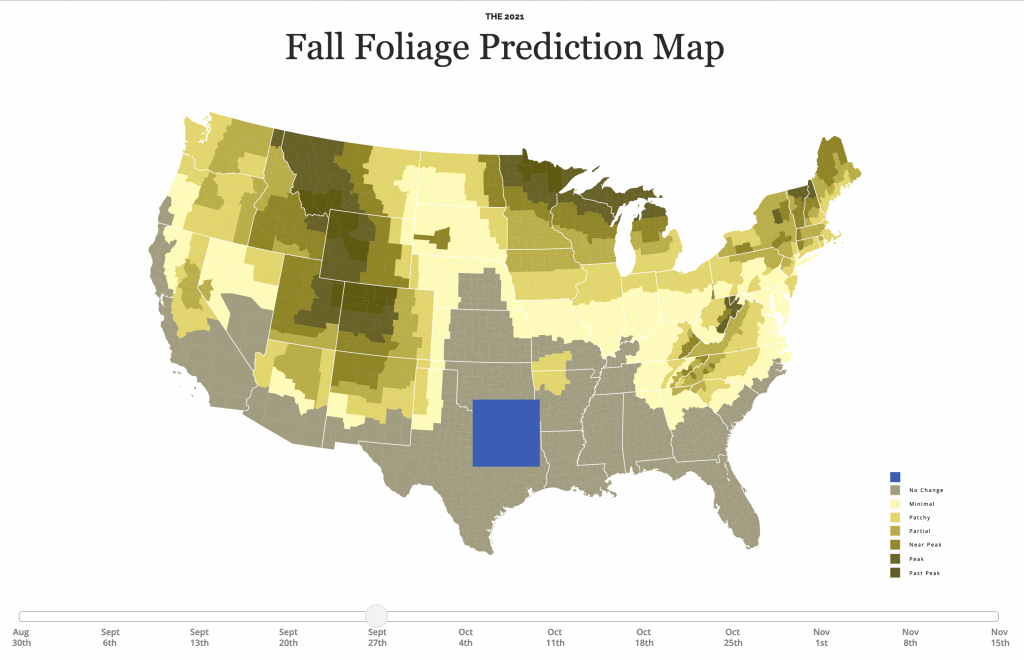
Here the blue is very clearly different than the reds. That makes it very distinct, but again, I think in the context of a map about the changing of leaf colours from greens to reds, a green-to-red map is appropriate. But only if, as these designers have, the colours are chosen so that the green can be distinguished from the reds.
As I always say, know the rules—don’t use red-to-green as one—so that you know the few instances when and where it’s appropriate to break them. As this map is.
Credit for the piece goes to the SmokyMountains.com

