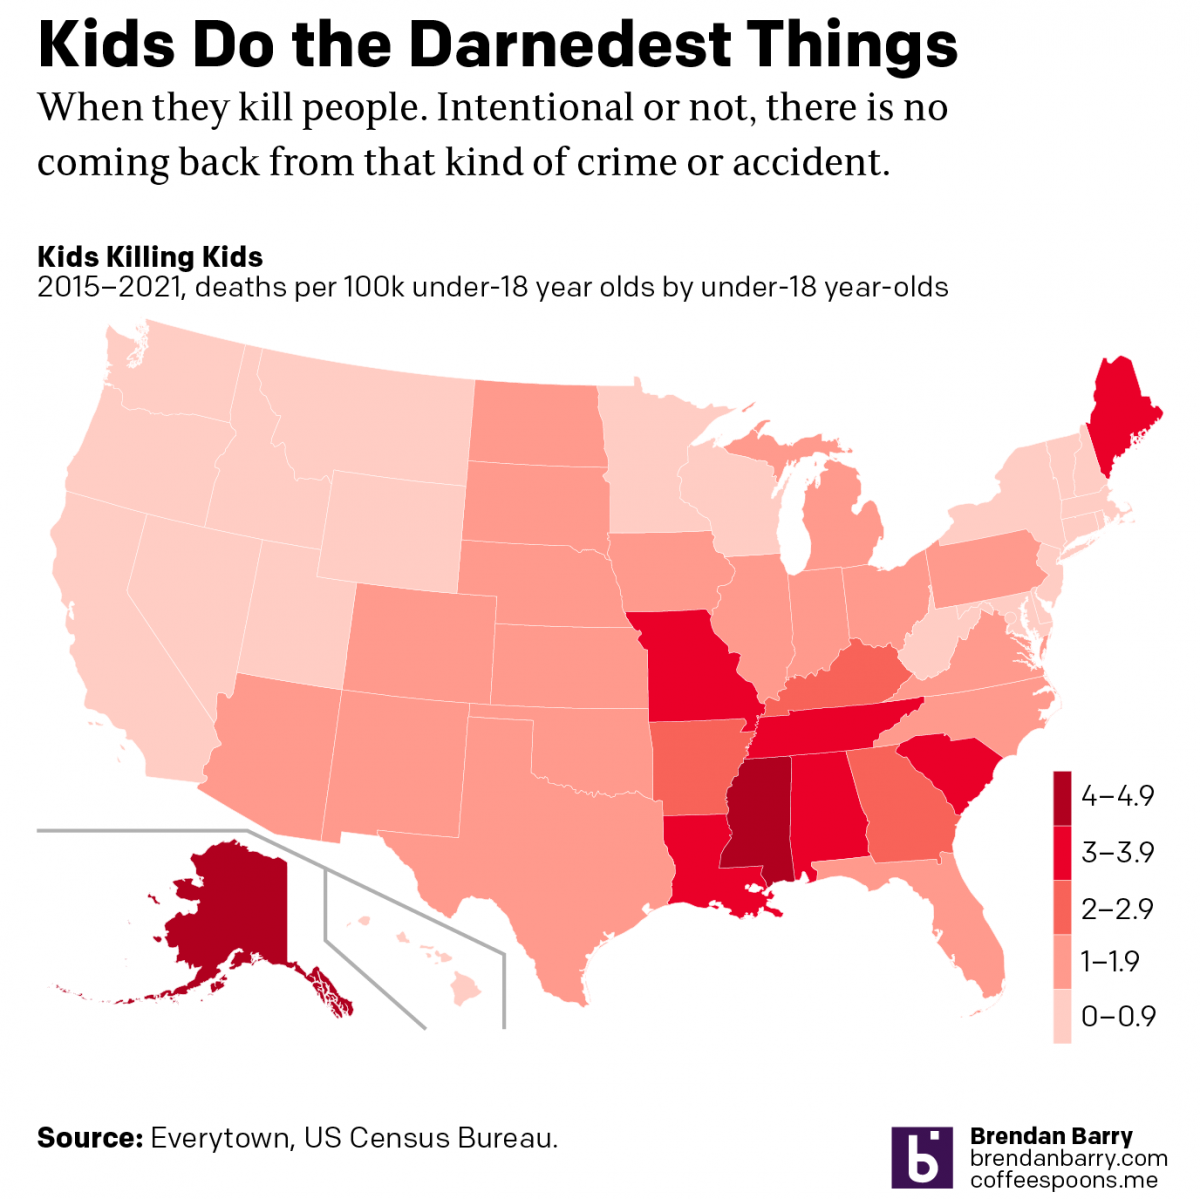
Kids Do the Darnedest Things: Shoot Other Kids

Last month, a 2-year old shot and killed his 4-year old sister whilst they sat in a car at a petrol station in Chester, Pennsylvania, a city just south of Philadelphia.

Not surprisingly some people began to look at the data around kid-involved shootings. One such person was Christopher Ingraham who explored the data and showed how shootings by children is up 50% since the pandemic. He used two graphics, one a bar chart and another a choropleth map.

The map shows where kid-involved shootings have occurred. Now what’s curious about this kind of a map is that the designer points out that toddler incidents are concentrated around the Southeast and Midwest. And that appears to be true, but some of the standouts like Ohio and Florida—not to mention Texas—are some of the most populated states in the country. More people would theoretically mean more deaths.

So if we go back to the original data and then grab a 2020 US Census estimate for the under-18 population of each state, I can run some back of the envelope maths and we can take a look at how many under-18 deaths there had been per 100,000 under-18 year-olds. And that map begins to look a little bit different.

If anything we see the pattern a bit more clearly. The problem persists in the Southeast, but it’s more concentrated in what I would call the Deep South. The problem states in the Midwest fade a bit to a lower rate. Some of the more obvious outliers here become Alaska and Maine.

As the original author points out, some of these numbers likely owe to lax gun regulation in terms of safe storage and trigger locks. I wonder if the numbers in Alaska and Maine could be due to the more rural nature of the states, but then we don’t see similar rates of kid deaths in places like Wyoming, Montana, and Idaho.

Credit for the original piece goes to Christopher Ingraham.