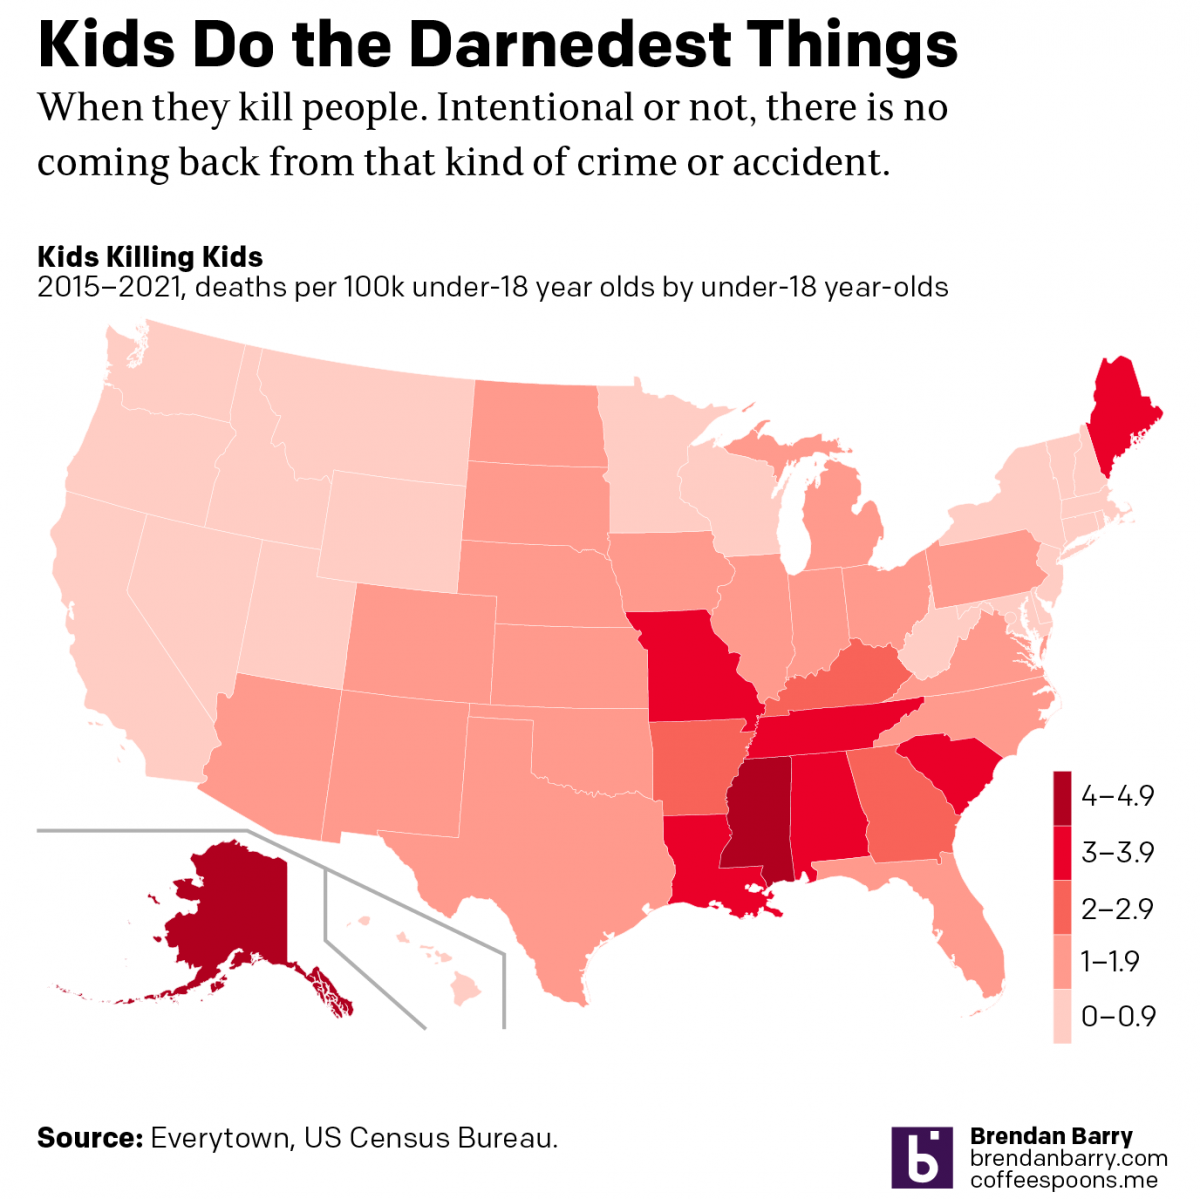
Kids Do the Darnedest Things: Shoot Other Kids

Last month, a 2-year old shot and killed his 4-year old sister whilst they sat in a car at a petrol station in Chester, Pennsylvania, a city just south of Philadelphia.

Not surprisingly some people began to look at the data around kid-involved shootings. One such person was Christopher Ingraham who explored the data and showed how shootings by children is up 50% since the pandemic. He used two graphics, one a bar chart and another a choropleth map.

The map shows where kid-involved shootings have occurred. Now what’s curious about this kind of a map is that the designer points out that toddler incidents are concentrated around the Southeast and Midwest. And that appears to be true, but some of the standouts like Ohio and Florida—not to mention Texas—are some of the most populated states in the country. More people would theoretically mean more deaths.

So if we go back to the original data and then grab a 2020 US Census estimate for the under-18 population of each state, I can run some back of the envelope maths and we can take a look at how many under-18 deaths there had been per 100,000 under-18 year-olds. And that map begins to look a little bit different.

If anything we see the pattern a bit more clearly. The problem persists in the Southeast, but it’s more concentrated in what I would call the Deep South. The problem states in the Midwest fade a bit to a lower rate. Some of the more obvious outliers here become Alaska and Maine.

As the original author points out, some of these numbers likely owe to lax gun regulation in terms of safe storage and trigger locks. I wonder if the numbers in Alaska and Maine could be due to the more rural nature of the states, but then we don’t see similar rates of kid deaths in places like Wyoming, Montana, and Idaho.

Credit for the original piece goes to Christopher Ingraham.

America’s Crime Problem

During the pandemic, media reports of the rise of crime have inundated American households. Violent crimes, we are told, are at record highs. One wonders if society is on the verge of collapse.

But last night a few friends asked me to take a look at the data during the pandemic (2020–2021) and see what is actually going on out on the streets in a few big cities. Naturally I agreed and that’s why we have this post today. The first thing to understand, however, is that we do not have a federal-level database where we can cross compare crimes in cities using standardised definitions. The FBI used to produce such a thing, but in 2020 retired it in favour of a new system that, for reasons, local and state agencies have yet to fully embrace. Consequently, just when we need some real data, we have a notable lack of it.

At the very least we have national-level reporting on violent crimes and homicides, the latter of which is a subset of violent crimes. Though these reports are also dependent on local and state agencies self-reporting to the FBI. I also wanted to look at not just whether crime is up of late, but is crime up over the last several years. I chose to go back 30 years, or a generation.

We can see one important trend here, that at a national level violent crimes are largely stable at rate of 400 per 100,000 people. Homicides, however, have climbed by nearly a third. Violent crimes are not rising, but murders are.

My initial charge was to look at cities and violent crime. However, knowing that nationally violent crimes are largely stable, the issue of concern would be how the rise in murders is playing out on American city streets. With the caveat that we do not have a single database to review, I pulled data directly from the five cities of interest: Philadelphia, Chicago, New York, Washington, and Detroit.

I also considered that large cities will have more murders simply by dint of their larger populations. And so when I collected the data, I also tried to find the Census Bureau’s population estimates of the cities during the same time frame. Unfortunately the 2021 estimates are not yet available so I had to use the 2020 population estimates for my 2021 calculations.

First we can see that not all cities report data for the same time period. And for Detroit in particular that makes comparisons tricky. In fact only New York had data back to the beginning of the century. Regardless of the data set’s less than full robustness we can see that in all five cities homicides rose in 2020 and 2021.

Second, however, if squint through that lack of full data, we see a trend at the city level that aligns with the national level. Homicides, tragically, are indeed up. However, in New York and Washington homicides are still below the data from near 2000 and at that time homicides already appear on a downward trajectory. I would bet that homicides were even higher during the 1990s and that the 2000s represented a long-run decline. In other words, whilst homicides are up, they are still below their peaks. A worrying trend, but far from the sky is falling.

That cannot quite be said for other cities. Let’s start with Detroit. Sadly we have too few years of data to draw any conclusion other than that homicides rose compared to the years preceding the pandemic.

That leaves us with Philadelphia and Chicago. Philadelphia has less data available and it’s harder to make a determination of what is happening. But we can say that since 2007, homicides have not been higher. If you look closely though, you can see how there does appear to be a downward trend at the beginning of the line. We do not have enough data like we do with New York and Washington, but I would bet homicides are up in Philadelphia, but still far short of what they were in the 1990s.

Chicago is the oddball. Yes, it saw a peak in homicides during the pandemic. But in 2016 the city didn’t miss the pandemic peak by much. In other words, homicides were staggeringly high in Chicago before the pandemic. If anything, we see a failure to combat high crime rates. But even before that spike in 2016, we see more of a valley floor in homicides. True, at the beginning of the century homicides appear to have trended down. But unlike the other cities here, homicides bottomed out at around 450 per 100,000 people. I’m not so certain we had a persistent, long-run decline in Chicago with which to start.

And like I said above, larger populations we would expect to have more murders because more potential criminals and victims. When we equalise for population we see the same trends as we expect—the city populations have been relatively stable over the last 20 years. Instead what we see is that relative to each other murders are more common in some cities and less so in others.

New York is a great example with nearly 500 murders last year, a number on par with Philadelphia. But New York has over 8 million inhabitants. Philadelphia has just 1.6. Consequently New York’s homicide rate is a surprisingly low 5.9 per 100,000 people. Philadelphia’s on the other hand? 35.6.

Philadelphia is near the top of that list, with Washington and Chicago having similar, albeit lower, rates at 31.7 and 30.1, respectively. But sadly Detroit surpasses them all and is in league of its own: 47.5 in 2021.

Credit for the pieces is mine.

Delco vs Chesco

One of the things in the pop culture these days is an HBO show called Mare of Easttown. For those that haven’t heard of it, probably my more international audience, it’s a crime drama set in the near suburbs of Philadelphia, a placed called Delaware County that locals simply call Delco.

Last Saturday, the show got its limelight on Saturday Night Live, which spoofed the show in a trailer for a fictional show called Murdur Durdur, from the producers of Mare of Easttown as well as those of It’s Always Sunny in Philadelphia.

The SNL skit included a crime map of which I took a screenshot.

I can see my house from here. Dur.

This caught my attention because one of the characters mentioned Downingtown, which is where your author grew up until he was 16. SNL‘s map really just served as a vehicle to showcase Googling all the town names—and the Philadelphia region has a wealth of them—because the map is all over the place, pun intended.

Conshohocken is actually a real place in neighbouring Montgomery County, on the Schuylkill River (real place). Royersford is also real and also in Montgomery County. Hockessin is also real, but is in Delaware, the state, not Delaware County, which is in Pennsylvania. (Both border the Delaware River.)

The map also makes reference to Lionville, a real place near Downingtown. Your humble author worked in a restaurant in Lionville, located in Uwchlan Township. (They don’t mention that, but I can see people enjoying that name as well.)

The keen observers will also note the placement of a label for Altor, which is only about 2.5 miles from my aforementioned childhood home. Clearly some SNL writer is from or is incredibly familiar with the western suburbs of Philadelphia.

As for the map itself? Well, it’s fictional. One, there is no Jagoff Bridge. Two, it’s actually a map of Bethlehem, to the north in the Lehigh Valley. Route 30 is a real place and does run through Downingtown and Chester County. But nowhere does it cross any town or city like the one the map depicts. Instead that road is Route 378 crossing the Lehigh River. (Fun fact, Route 30 runs west and eventually through Indiana and Illinois, south of Chicago.)

In fact the funny thing is, the map spoofing the show set in Delaware County does not contain a single place in the real Delaware County. Easttown is, for fans of the show, not actually located in Delaware County. Instead, it’s in Chester County. And your author, not surprisingly perhaps, has connections there because it’s where you can find Devon and Berwyn. (My Chicago readers may recognise those names, as several streets were named for Main Line towns.) And where I attended middle- and high-school is across the street from Easttown Township. The real one.

Now I want to actually watch the show. The real one. Not the SNL one. But first I’ll need to grab a Yuengling and a Wawa hoagie.

Credit for the piece goes to probably the writers and props department of Saturday Night Live.

New York Is Still Beating London

So two weeks ago I posted about the graphics in a BBC article about how London has surpassed New York in terms of murders, due to a spate of stabbings in the British capital. Well, somehow I missed this: an article from the Economist that rebuts that point. And it does it brilliantly.

Lies, damned lies, and statistics.

I think everybody who works with data knows that adage. Now, I am not using it to say that the BBC—or the numerous other media outlets that ran the story—lied. Just that it is easy to change the story based on the data, how it is presented, or which subsets of the data are selected.

The Economist’s article points out that the surpassing of New York is a short term data point, a worrying short term trend, definitely, but they then look at the data. They select two timeframes and look at them side-by-side.

It's all about what data you show, choose to highlight, and then how you show it.
It’s all about what data you show, choose to highlight, and then how you show it.

And that is what I love about this piece. It shows the long-term context of New York having a far-higher medium-term history of murder (some 28 years of data is shown). When I was growing up in the 90s, murders in New York—and to be fair almost all large American cities—was just something that was a known fact. During that time, London hovered below 200 or so, compared to the 2000+ in early 90s New York.

But then they also show the short term, which does point to a steady rise in London murders. But, the data could also show a one-time dip in the murders in New York. But they also show that the total number of deaths is still higher in New York than London, despite the three months of data.

Murder is not good. But these graphics are a good example of how selecting different time series for the same data set, and then showing which parts of the data to show. The earlier BBC piece, and my revision of it, did not show the total deaths. Nor did either piece show the longer timeline of data.

Credit for the piece goes to the Economist graphics department.

More Murder in Merica

Today’s post was going to be something not this. But it is remarkable how many people die in the United States in mass shootings. It is, generally speaking, not a problem experienced in the rest of the developed world. The question is do we want gun violence to really define American exceptionalism?

Anyways, the Washington Post has a frightening piece exploring all the deaths, the guns, the killers, and the frequency of the killings.

Too many illustrations there

Credit for the piece goes to Bonnie Berkowitz, Denise Lu, and Chris Alcantara.

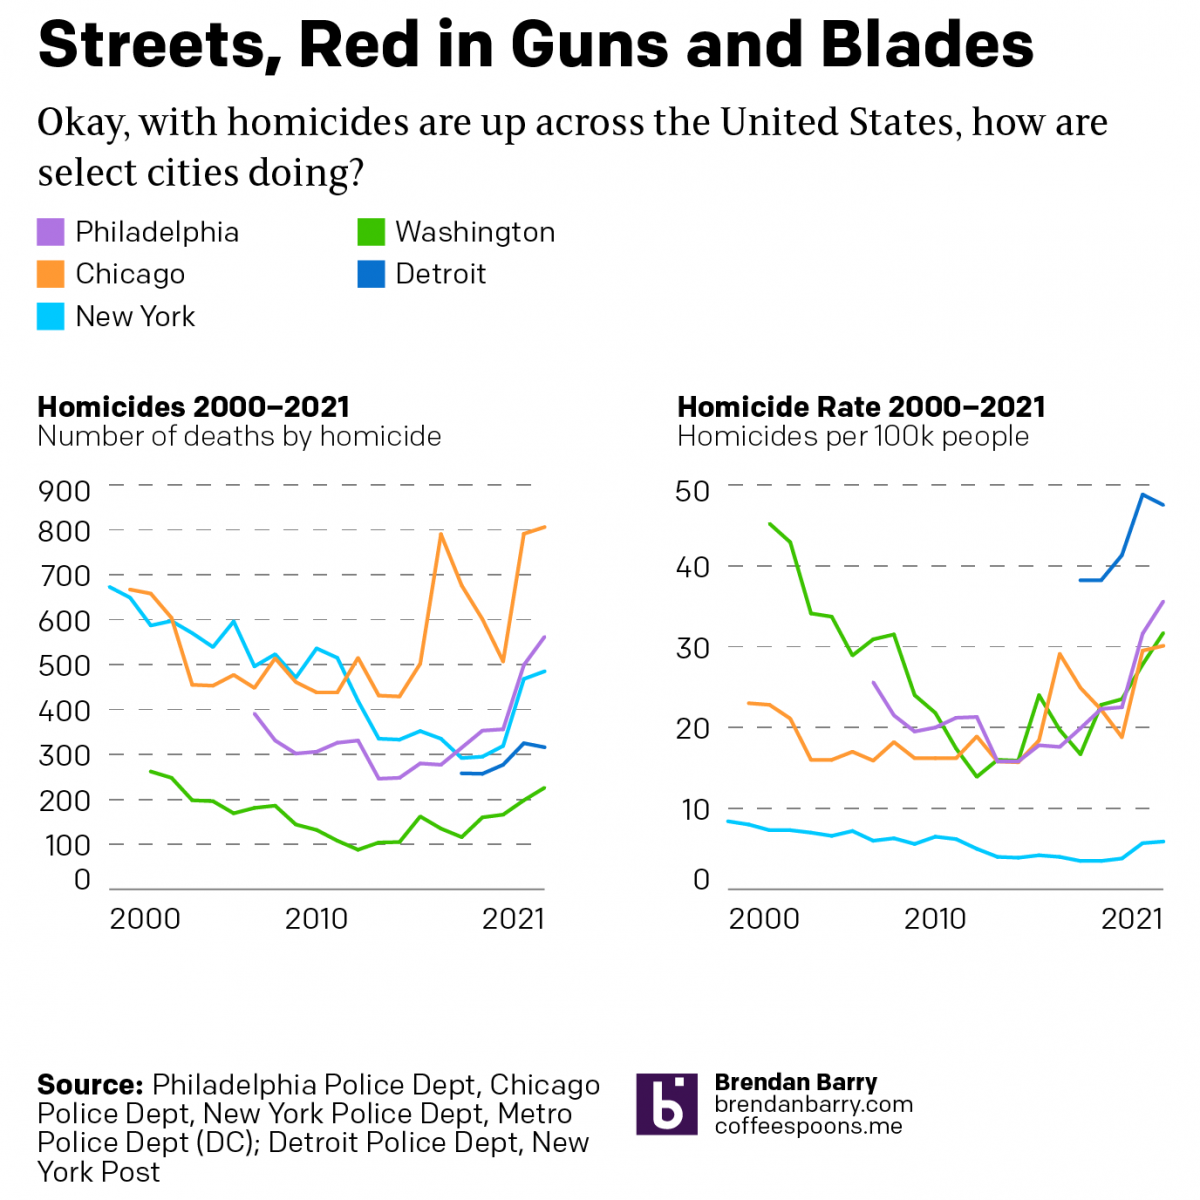
Murder Rates in the US

Yesterday we looked at an article about exporting guns from one state to another. After writing the article I sat down and recalled that the copy of the Economist sitting by the sofa had a small multiple chart looking at murders in a select set of US cities. It turns out that while there was a spike, it appears that lately the murder rate has been flat.

Chicago is higher than Philly, to be fair

It’s a solid chart that does its job well. That is probably why I neglected to mention it until I realised it fit in with the map of Illinois and talk about gun crimes yesterday. Because there is plenty of other news through data visualisation that we can talk about this week.

Credit for the piece goes to the Economist Data Team.

Exporting Guns

When I lived in Chicago, people back East would always ask if I was worried about murder and gun crime in Chicago. My reply was always, “no, not really”. Why? Because I lived in generally safe neighbourhoods. But on that topic, the second most numerous question/comment was always, why are the strict gun laws in Chicago not preventing these crimes? More often than not the question had more to do with saying gun control laws were ineffective.

But in Chicago, it seemed to me to be fairly common knowledge that most of the guns people used to commit crimes were, in fact, not purchased in Illinois. Rather, criminals imported them from neighbouring states that had far looser regulations on firearms.

Today’s post from FiveThirtyEight looks at that very topic.

They bring back more than just cheese from Wisconsin…

They bring back more than just cheese from Wisconsin…I am not the biggest fan of the maps that they use, although I understand why. Most Americans would probably not be able to name the states bordering Illinois, California, or Maryland—the two other states examined this way—and this helps ground the readers in that geographically important context. But, thankfully the designers opted for another further down in the article that explores the data set in a more nuanced approach. Surprise, surprise, it’s not that simple of an issue.

Credit for the piece goes to Rachael Dottle.

How Serious Is the Rise in Violent Crime?

On Monday, Attorney General Jeff Sessions and the Justice Department released figures for violent crimes in 2016. The administration talked about the rise in violent crime. And yes, such crime did rise in 2016. But, what was not raised nearly as much is that we are also living in an era of historically low crime. FiveThirtyEight broke down the crime numbers through a series of charts and put them in their historical context.

The screenshot below looks just at murder rates. And again, nobody denies that the murder rate is up. But it still below the level it was in the 2000s, 1990s, and 1980s. One has to go back to the 1960s to find murder rates so low.

Murder is up, but still historically low

The point is really just to reiterate that context matters. If we were to look at the rise over the last year, yes an increase from 4.9 to 5.3 would look bad. But, really, we are still living in a far safer country than we were for most of the latter half of the 20th century. You just need to extend the endpoints of the chart to see it.

Credit for the piece goes to Jeff Asher.

Metropolises of Murder

Quite a few things to look at this week. But I want to start with something that caught my attention last Friday. The Economist produced this graphic about the top-50 cities by the always pleasant metric of homicide. I bring it up because of the oft mentioned capital of carnage here in America: Chicago. (To which I’m briefly returning late this week.)

The capitals of crime, the metropolises of murder

Note which city is not on that list: Chicago.

Some countries, sadly El Salvador, Honduras, and Mexico, are among those expected on that list. But the United States is the only rich, industrialised nation present. Unfortunately this is not a list on which we should aspire to be.

The graphic itself does a few nice things. In particular, I like the inclusion of the small multiple national rate to the left of the cities. Because, obviously, high murder rates are not great in El Salvador, but on the plus side, they are down of late. And the same small multiples do go a long way to show that, in general, despite what the administration says, homicide rates in the United States are quite low by these standards.

My quibble with the graphic? Breaking out cities by country. Yeah, it does make a lot of sense. But look at that country listed two spots below the United States: Puerto Rico. I am not here going to get into the whole Puerto Rican statehood vs. sovereignty argument, but suffice it to say that it is a part of the United States.

Credit for the piece goes to the Economist’s graphics department.

The Trafficante Family

For the past few days I was in Las Vegas for a stag party. One of the things I got to see was the Mob Museum in old Vegas. As I am not a gambler, the other forms of entertainment garner my interest, and if you are like me, I would highly recommend the museum. I found it very informative and well designed. So over the next few days I will be showcasing some photos that I took in Vegas, but mostly at the Mob Museum.

The first is a diagram of the Trafficante family. It bears a striking resemblance to the genealogy diagrams with which I am very familiar. But since in many respects these mob families started as just that, perhaps the similarity should not be so surprising.

The Trafficante crime family

Credit for the piece, I assume, would go to the Justice Department.

Update: Thanks to Scott Deitche for pointing me towards the chart’s author: Ken Sanz of the Florida Department of Law Enforcement.