Covid Update: 28 June

Technical difficulties prevented me from posting yesterday morning. But we’re back today and even though it’s a Tuesday, I wanted to begin the week with a post about the current status of Covid-19 in Pennsylvania, New Jersey, Delaware, Virginia, and Illinois.

Broadly speaking, things continue to improve. I don’t have all the vaccination data plugged in yet as I have to admit that as life begins returning to normal the time considerations of keeping track of Covid is not always insignificant. But I do at least have the new cases and deaths to look at and compare to last week.

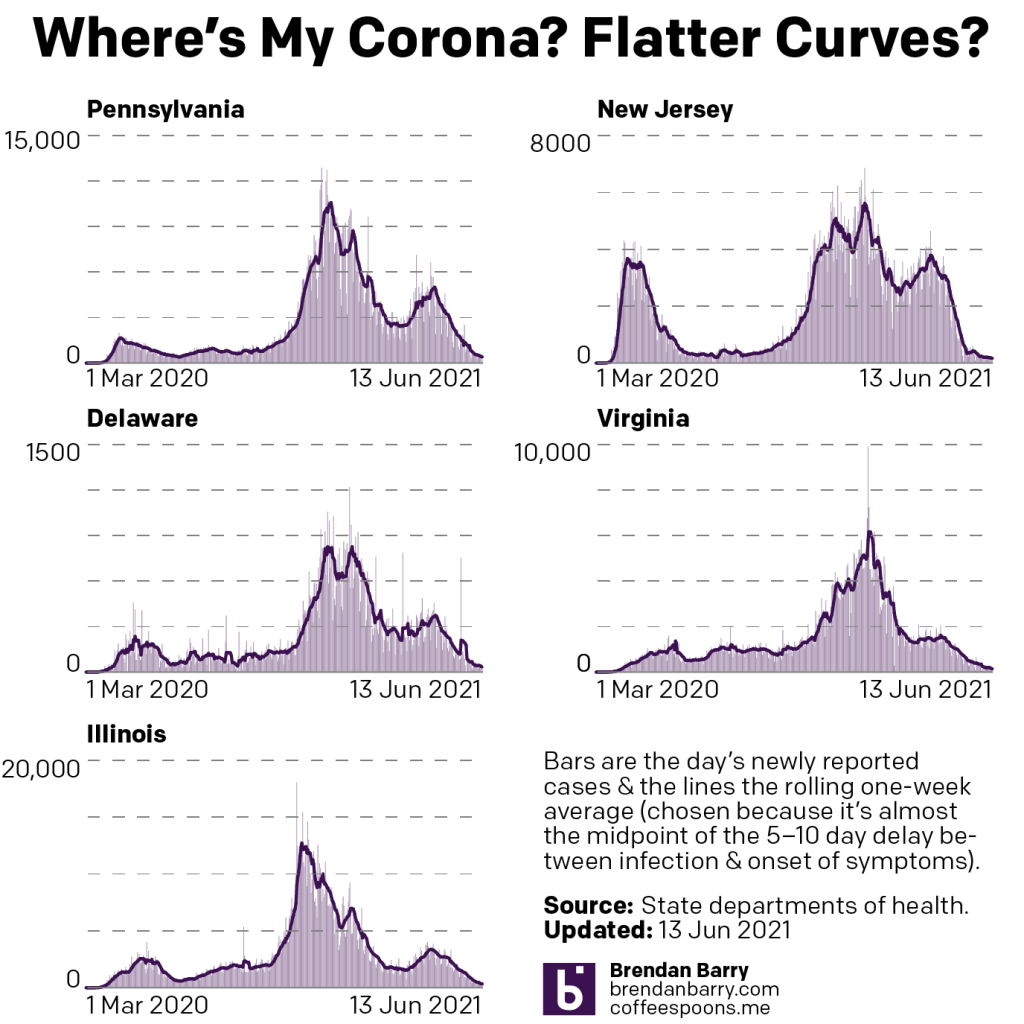
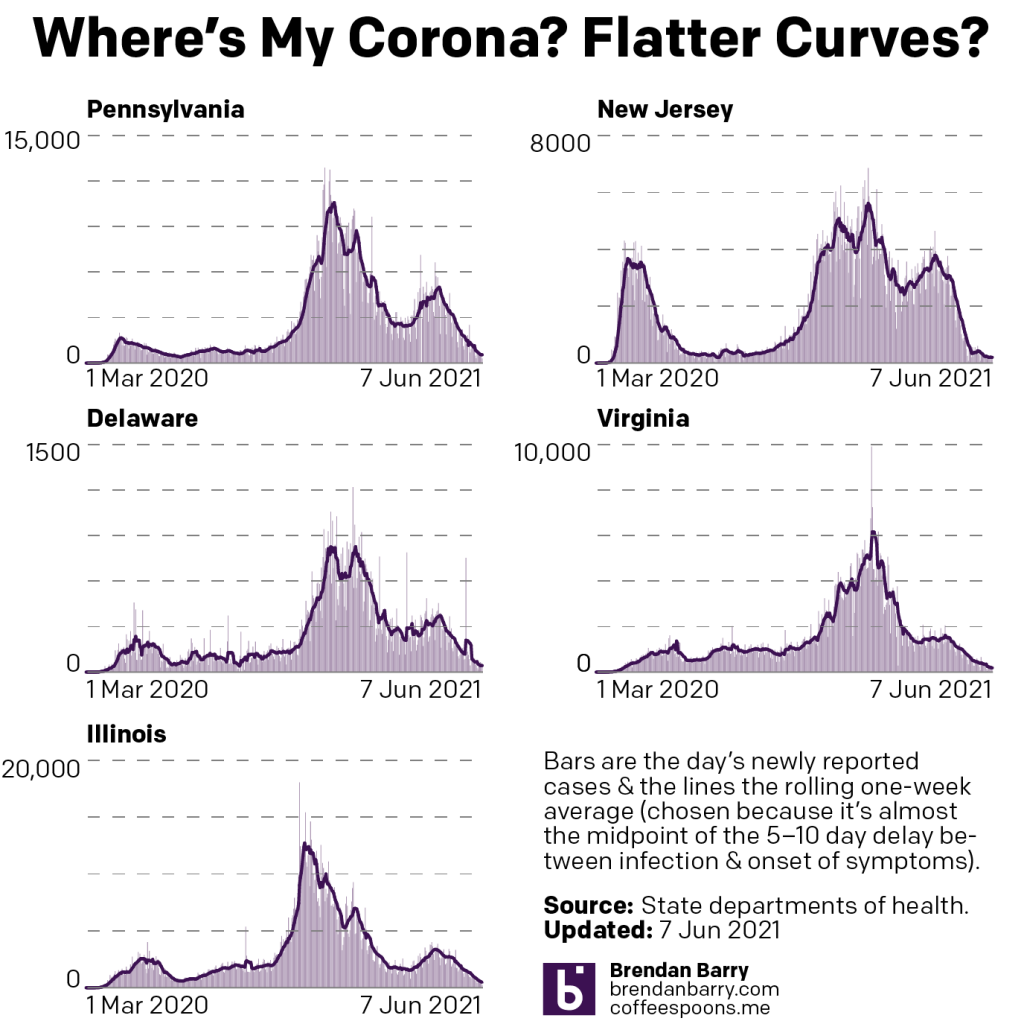
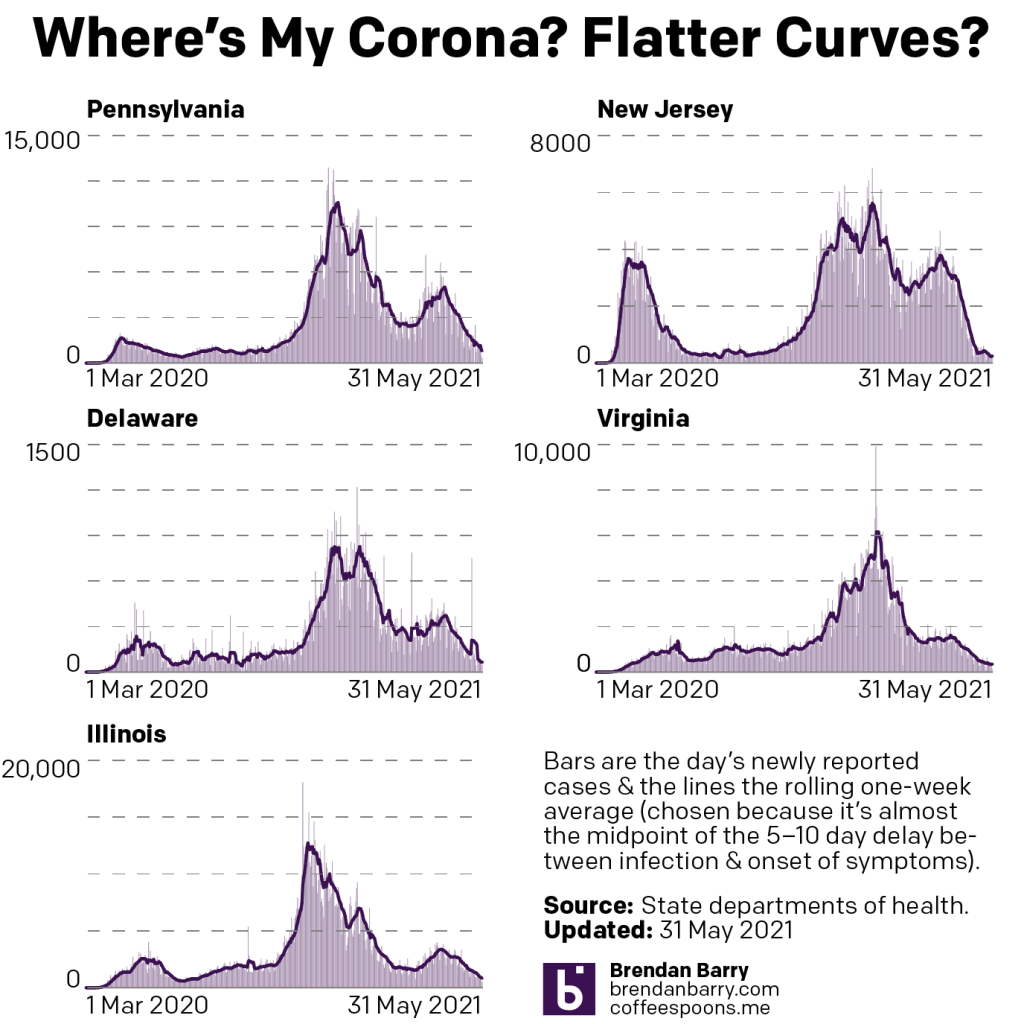
When we look at new cases, we can see some divergent patterns at the margins.
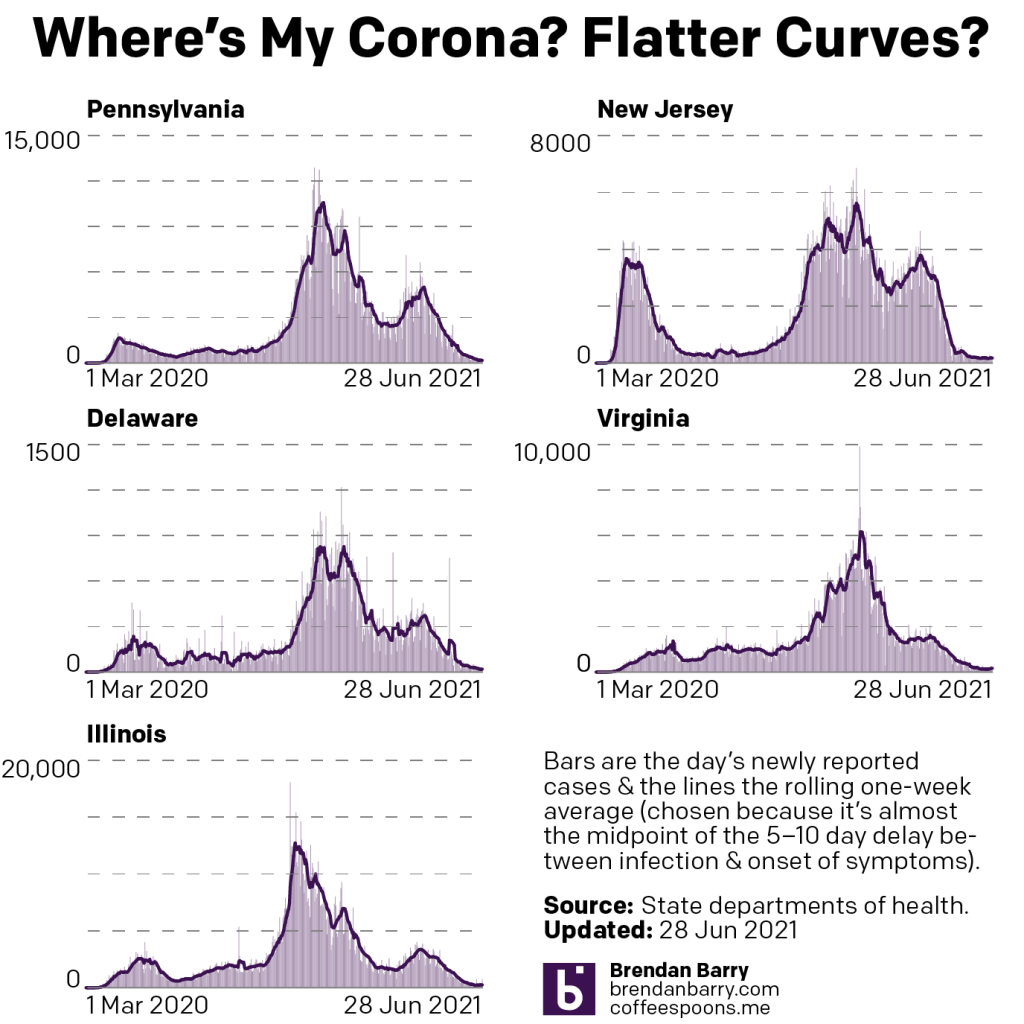
New case curves for PA, NJ, DE, VA, & IL.

In the tri-state area, new cases continue to fall. Pennsylvania reported just 104 new cases yesterday and its seven-day average fell to 177. That’s great news. And in New Jersey, the daily new cases fell to 104 and the average to 176. And in Delaware the daily number was just 18 and the average 19.

On the other hand we have Virginia and Illinois. First, I should note that for the second straight weekend, Illinois did not report data. I think we can begin to assume this will be the new reporting schedule moving forward. Last week that impacted the seven-day average, but now that it is a periodic event we can see it accounted for in the average of 248 new cases per day.

The issue is that 248 is greater than last week’s average of 233 of the averages. In other words, there is some indications the virus is spreading once again. Though, the week-to-week numbers offer a slight hope. Last Monday we had 755 new cases—keeping in mind that no new cases were reported Saturday and Sunday—and yesterday 747. That is down, though not a lot. We will need to keep an eye on Illinois’ data and how it progresses through Friday.

In Virginia we see a similar pattern as that of Illinois. Week-to-week, yesterday’s number was just 88 new cases and last week’s 116. That’s good. However, a look at the seven-day average shows some reasons for concern. Last week we were discussing Virginia’s fall to 129 new cases per day. But as of yesterday the average has climbed back up to 165. And that’s not a one-day jump. Instead since that nadir of 129, the seven-day average steadily climbed each day last week. That suggests new cases may be spreading in Old Dominion once more. But let’s wait one more week before we begin to become overly concerned as 165 is still lower than the month’s current average of 169.

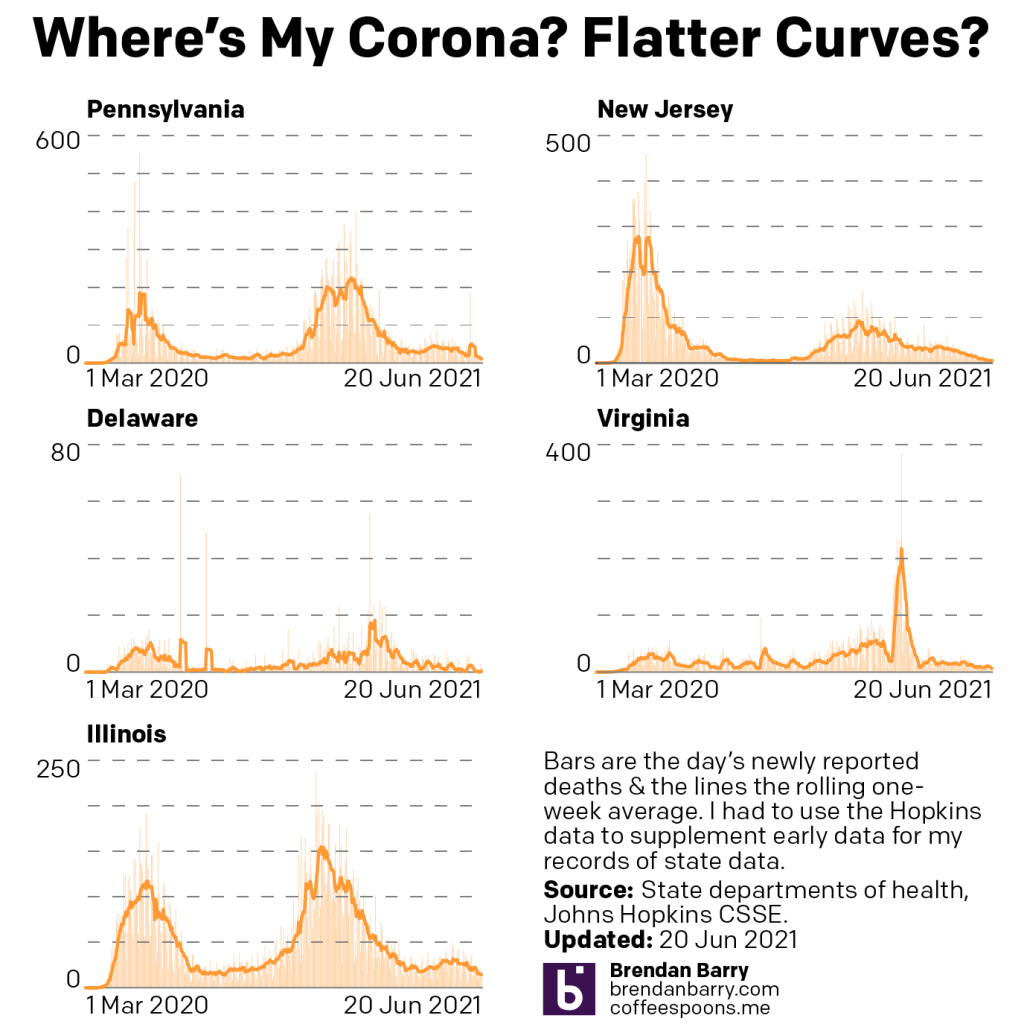
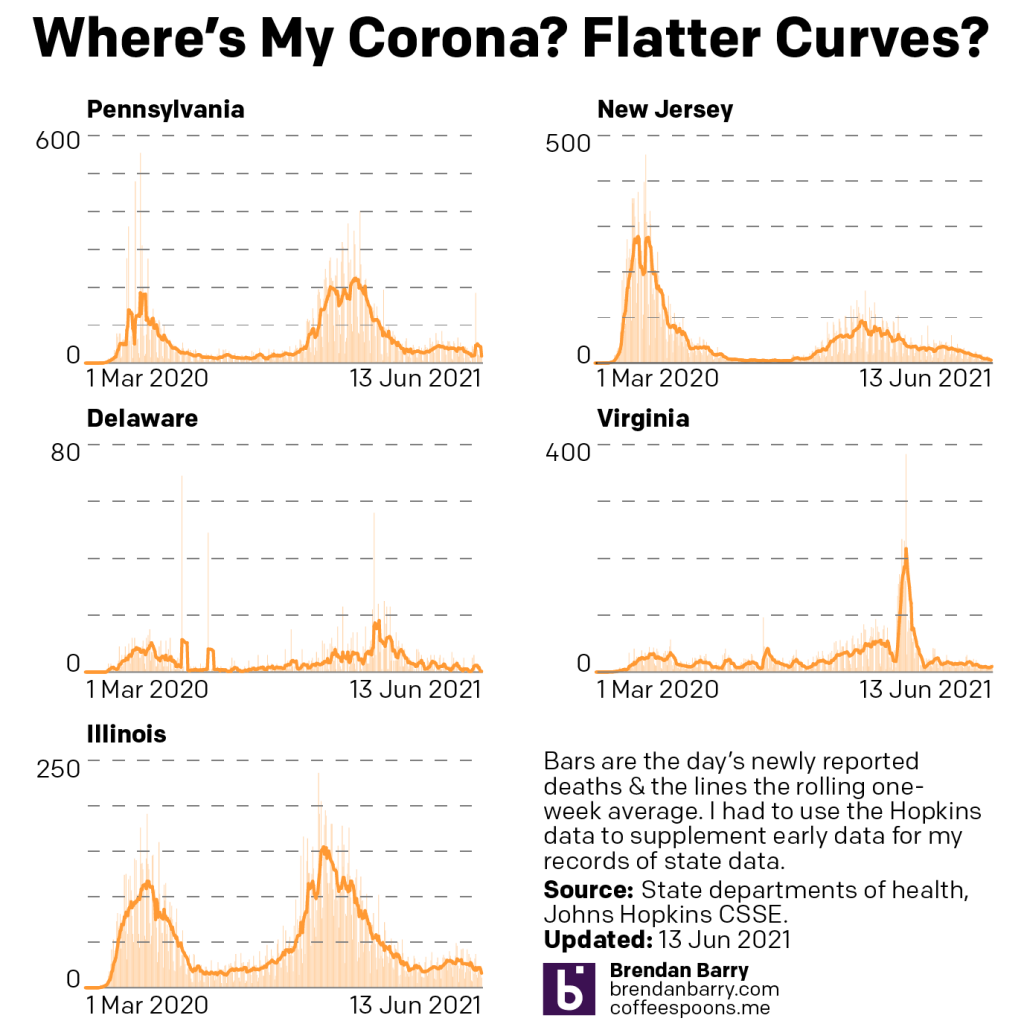
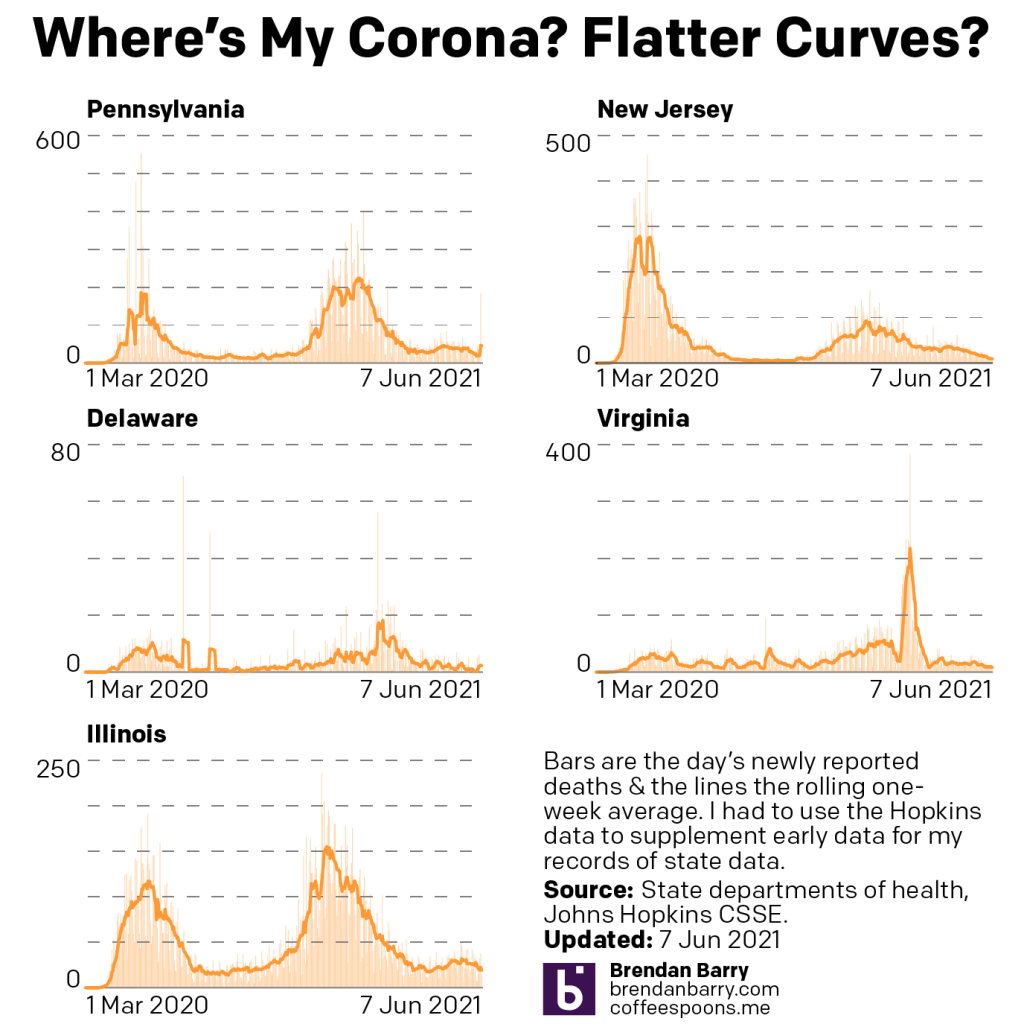
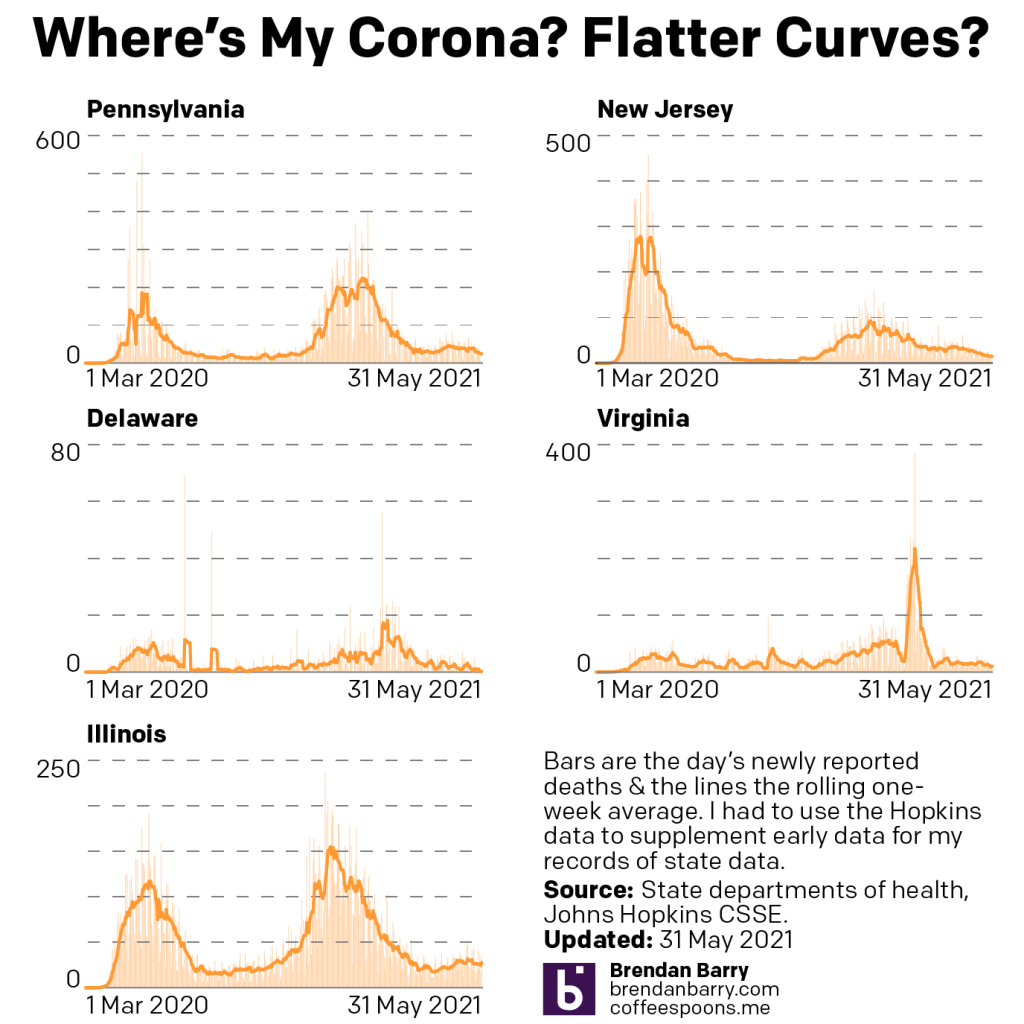
Deaths present us with the opposite pattern, however.
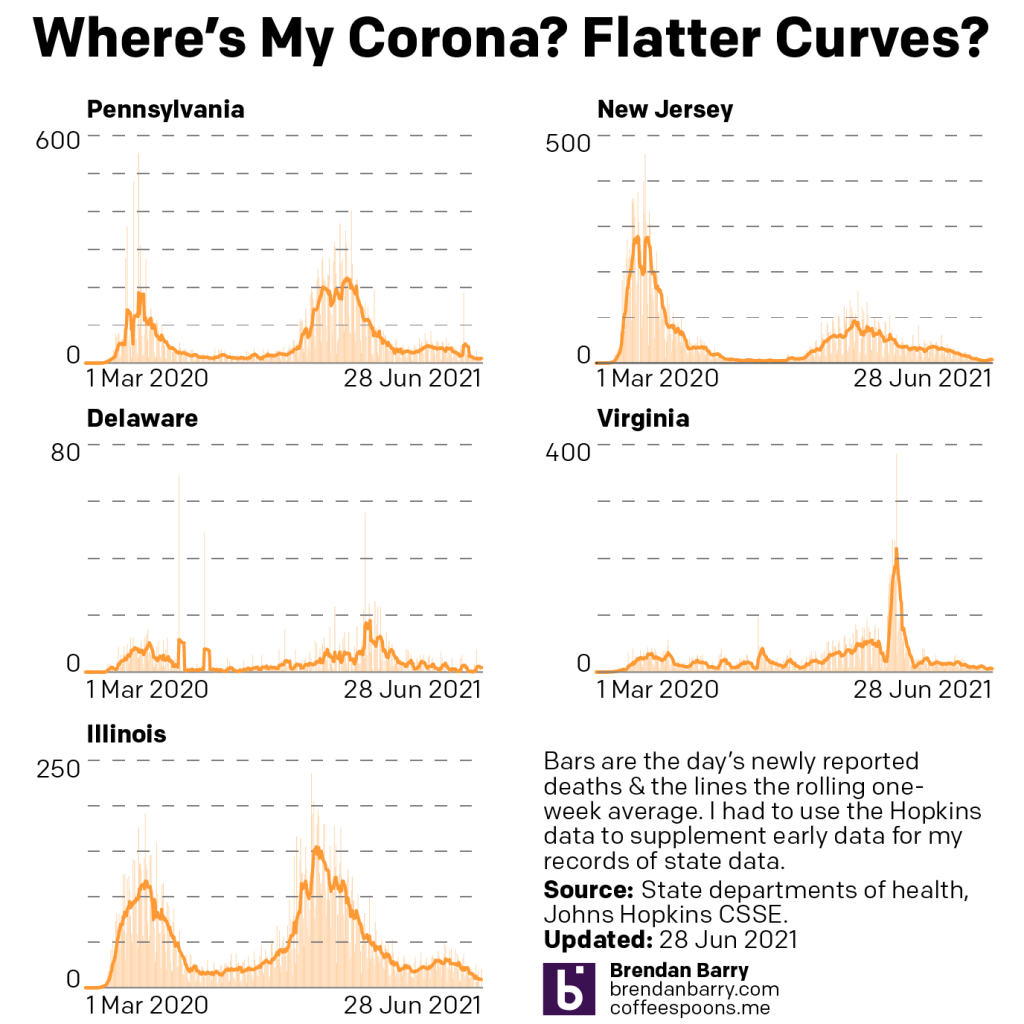
Death curves for PA, NJ, DE, VA, & IL.

Last week we looked at new lows for the tri-state area whilst Virginia and Illinois saw slight increases. I even suggested that we could see death rates in Pennsylvania slip into the single digits.

Well instead we saw slight increases in the death rate in Pennsylvania, New Jersey, and Delaware. Again, nothing massive. But on 20 June we had an average of 11.6 deaths per day in Pennsylvania and yesterday the average sat at 12.4. Not huge, and within a rounding of being the same number, but still an increase. Delaware had been at 0.6 deaths per day, so an increase to 1.6 is an increase, but there’s very little room left to improve when your average falls below 1 per day.

In New Jersey we saw perhaps the most concerning rise, though again still slight by comparison to the entirety of the pandemic. The average last week sat at 5.6 deaths per day and we enter Tuesday at 7.6. That is still lower than the numbers three weeks ago, but it’s a rise nonetheless. Like with the new cases, we will want to watch this week to see how the numbers progress.

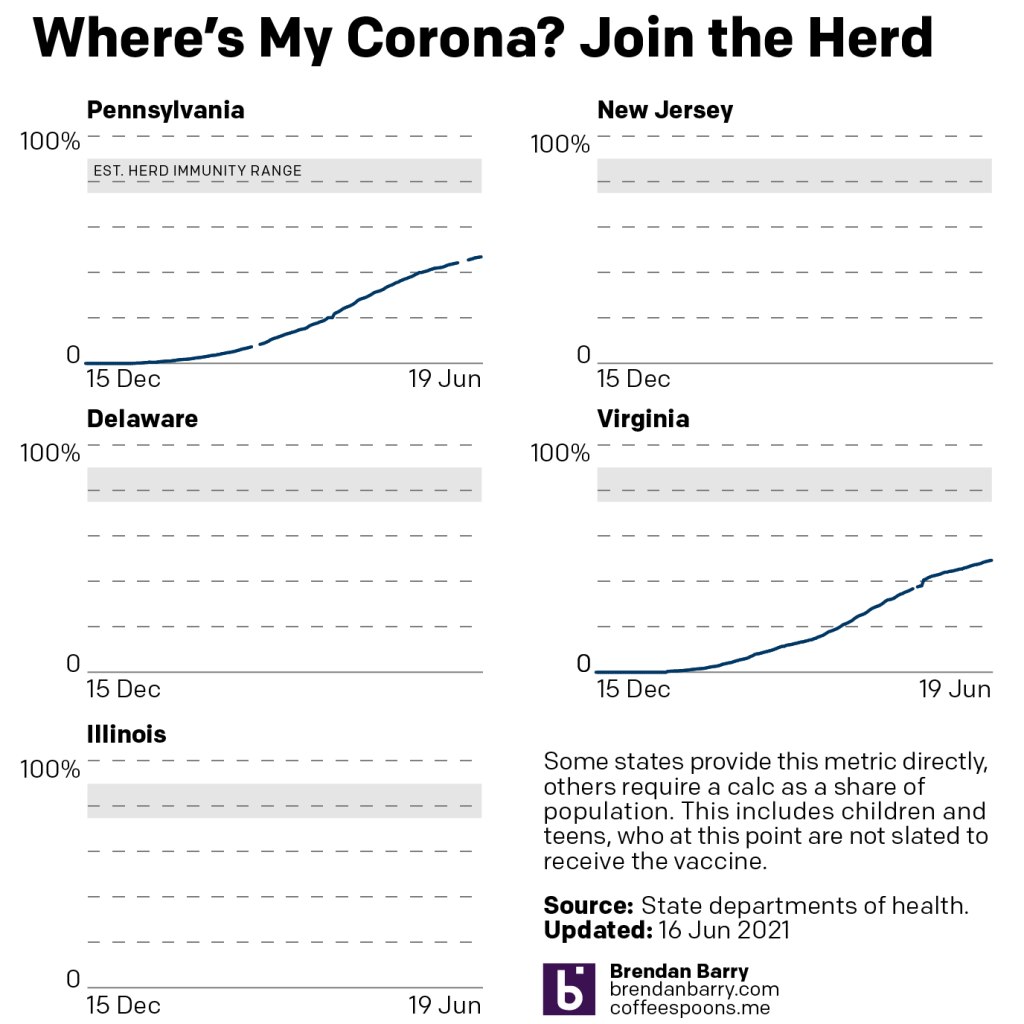
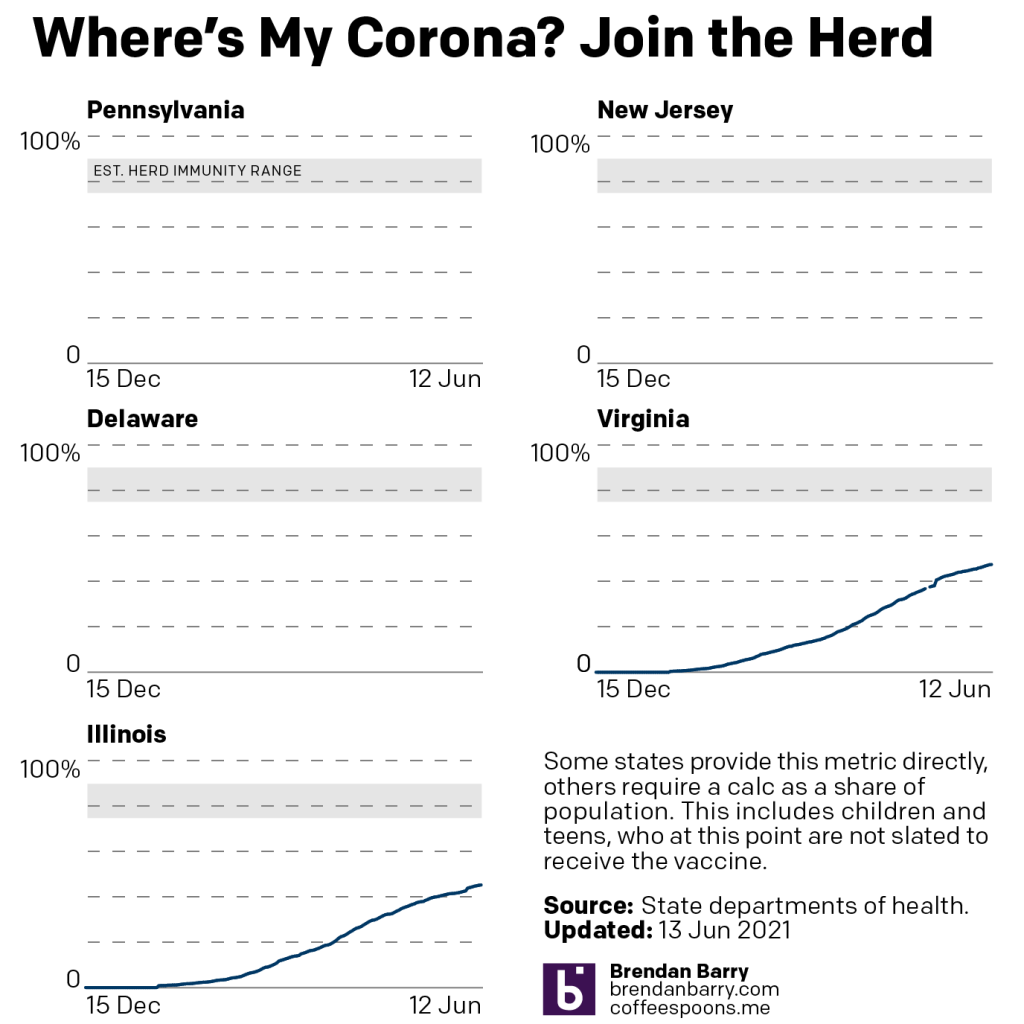
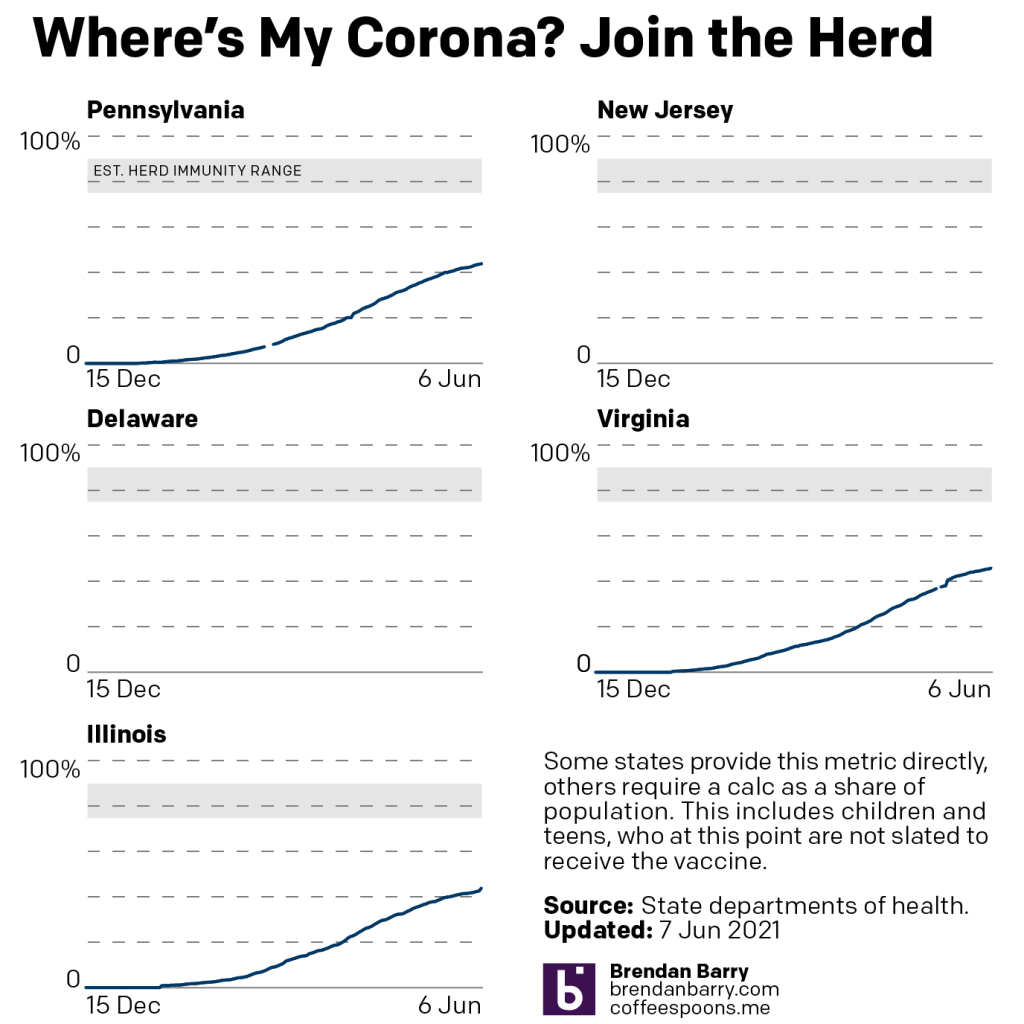
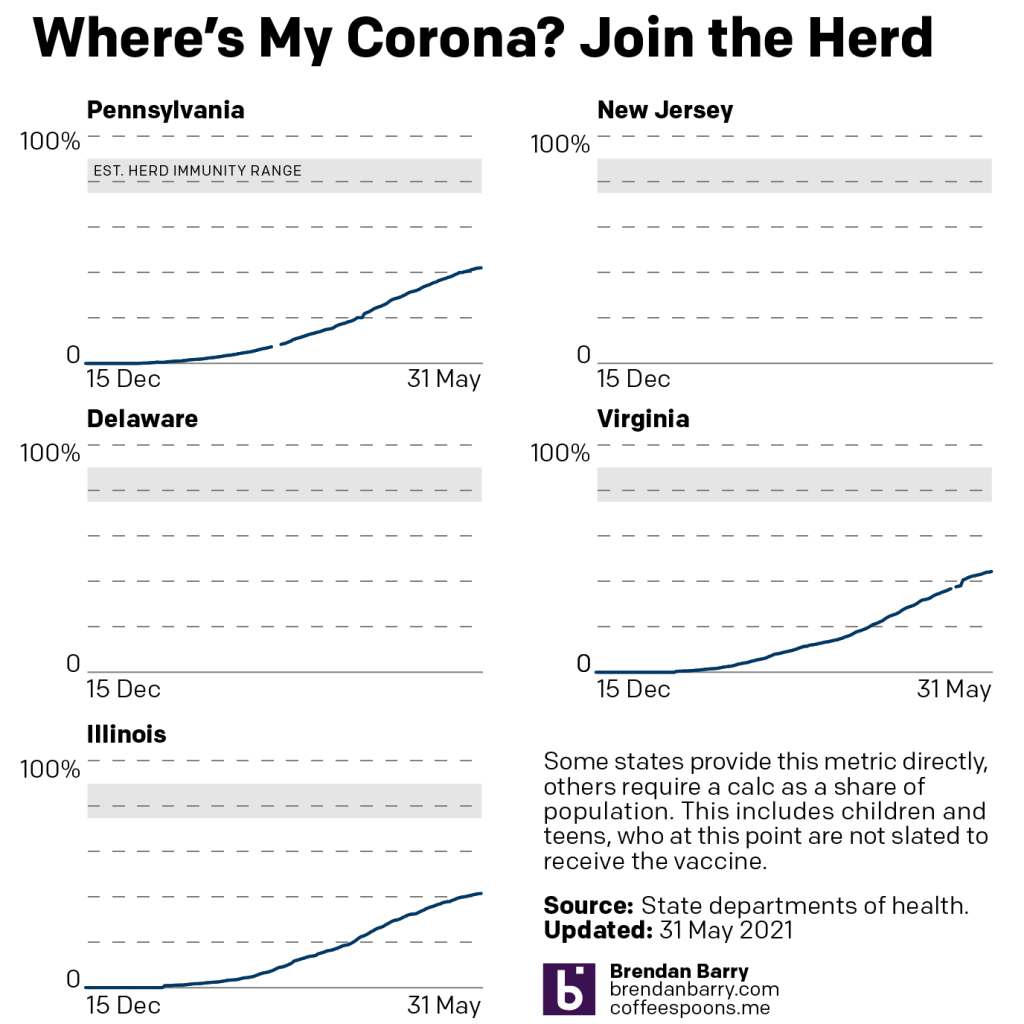
I don’t have any graphics or tables to present for vaccinations, but the numbers we do have show little to no progress in full vaccinations over the last week. Week-to-week, Pennsylvania, for example, saw an increase of 0.77 percentage points, or only 0.11 percentage points per day.

Now Pennsylvania’s fully vaccinated population rate sits at just a tick under 48%. Not bad. But Virginia is at 50.5%. And when last reported Illinois was 47.3%. We know that herd immunity, which we need to really starve out the virus, is probably above 75%—though likely higher with more transmissible variants of the virus—and we have currently failed to achieve that number.

That’s sad.

To bring my genealogical interest into this conversation, you only need to look to about 100 years ago when our ancestors did not, generally speaking, have access to vaccines. There was a reason people feared becoming ill, you were far more likely to die. But vaccinations eliminated the worst of the worst diseases and at the time people flocked to become vaccinated, recognising that they did not want to live in a world of mumps, measles, smallpox, or polio. If many of our ancestors were alive today, I believe they would be shocked at our society’s broad refusal to be vaccinated.

Covid Update: 20 June

So today’s post will be a little bit shorter than usual. The big reason is probably good, but also worth addressing. States are increasingly less reliable about their data. For several weeks I have mentioned that Philadelphia had not been updating their vaccination data. Last week or two weeks ago I noticed a small line of text had been inserted saying they were ramping down reporting to just two days per week. That’s unfortunate, because Philadelphia County represents 1/9 of Pennsylvania and that can make a significant impact on the Commonwealth’s total numbers.

But this week we have Illinois. There’s been no update since Friday and it’s not clear if this is due to a glitch, or given the coincidence, a change in reporting schedule that omits weekend data updates. Not reporting for a weekend is not a big deal, as states often have to perform back-end server maintenance or clean up data and the best time for that is the weekend. But heretofore, Illinois had been the most reliable state in terms of reporting data.

There was one thing I wanted to address this week, but the lack of Illinois data makes that tricky. So I may have to wait and maybe do it next week or later this week.

Anyway, the data below is not quite as up-to-date for Illinois, but we’ll see how the Land of Lincoln addresses the issue probably today.

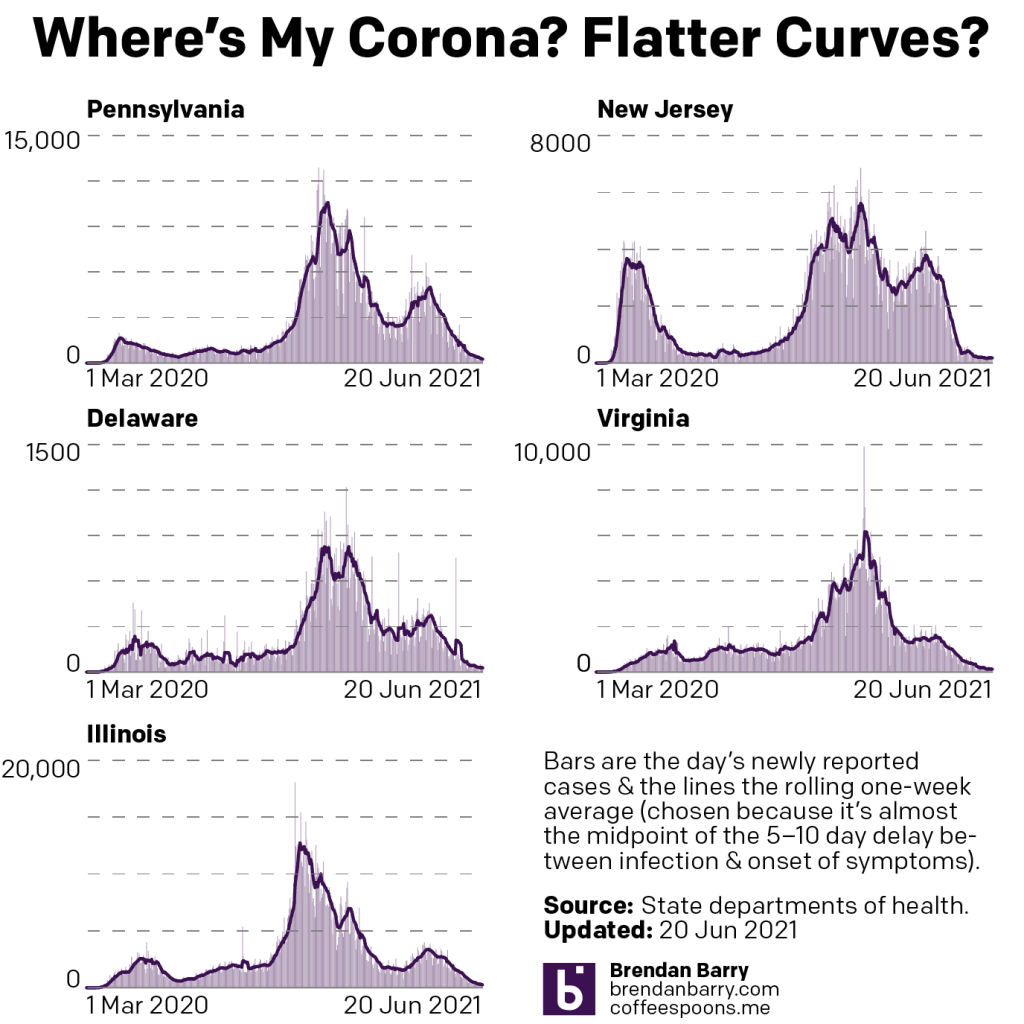
New case curves for PA, NJ, DE, VA, & IL.

Otherwise, the numbers are good. Yes, the downward slopes are shallowing out and that is increasingly obvious, but there’s increasingly less room to drop. Pennsylvania, for example, last week was just over 400 new cases per day, but the seven-day average now sits at 261. Illinois last week sat at 336, but as of its last update, that was down to 237. Virginia’s decrease was smaller, from 143 to 129, while Delaware fell from 33 to 27.

Only in New Jersey have we seen the seven-day average rise, from 168 to 179. This was not a one-off spike, however. As the delta variant takes hold in the United States, the variant brings increased ease of transmission and more severe effects for younger populations, the population group last to vaccinate and increasingly seen as not willing to vaccinate. Is this driving the slight uptick in New Jersey we saw last week? It’s too early to say.

But it serves as a reminder to everyone, please, if you haven’t already, get vaccinated.

Deaths now appear to be dropping once again across the board.

Death curves for PA, NJ, DE, VA, & IL.

Last we discussed Pennsylvania bottoming out around that 18 deaths per day level. After a week of declines, that average is now down to just under 12 deaths per day. If we see continued progress, perhaps this time next week I can be writing about the Commonwealth’s seven-day average dropping into the single digits for the first time since April 2020.

Illinois also looked like it was slowing, but again, the lack of data is making it hard to say one way or another. But at last report, the average was down to 14 deaths per day.

Last week we also discussed a slowing rate in New Jersey, and that continued to slow, but still continued to fall and deaths are now at 5.6 per day. And after a rise I noted last week, Virginia is back below double digits and at 6.3 deaths per day.

Delaware actually managed to hit 0.0 deaths per day for a stretch of two days last week as it went a week-plus without a single Covid-19 death. It has had a few reported over the weekend and so that number is up, but still below 1 as we head into the week.

Vaccinations remain the slowing curve that we saw last week.

Total vaccinations for PA & VA.

Thankfully we can see Virginia is now approaching and, hopefully, can cross the 50% fully vaccinated rate by the end of the week. Pennsylvania, again, is hard to gauge. The numbers sit at 46.7%, but the Philadelphia numbers have not updated in four days, so that could add a half percentage point or, earlier in the vaccination push, more. Optimistically, however, we are looking at numbers nearing 50%.

Credit for the piece is mine.

Covid Update: 13 June

Last week I mentioned how the rate of decline in new cases had begun to fall significantly, largely due to two factors. The first is good, that we are reaching low levels of new cases overall, but the second is bad, that we see a large proportion of the population hesitant to receive their vaccines. (The vaccines have been proven safe, effective, and they’re free. If you haven’t received your shots yet, I highly encourage you to do so.)

This past week that trend for new cases largely continued. But another issue I was concerned about was a slight uptick, given that last Sunday’s daily new case data was higher than the previous Sunday’s. So as we look at the chart of new case curves, how are we doing?

New case curves for PA, NJ, DE, VA, & IL.

Good news. Those numbers are back on the decline and, in fact, the daily numbers from this Sunday are lower than those of even two weeks ago. We would have had a more muddled picture if the numbers were lower than last week, but still higher than two weeks ago. This leaves me more assured that the numbers are in fact still headed down and the few upticks are outliers and not a trend.

I also wanted to point out another data point this week. This coming week will mark the one-year anniversaries of the summer lows we saw in 2020. These were the points at which Covid-19 was at its lowest ebb after the initial spring wave and then the rise in cases beginning in late summer and early autumn. This most recent spring, despite the initial burst of reopening, our new case levels never fell to anywhere near the summer lows.

I will chart more of this likely next week as we hit all but one of those milestones. But as a teaser, today, 14 June was the lowest point for Delaware, which on that day had a seven-day average of 46 new cases per day. The average heading into today’s data release? 33. Or in other words, Delaware is averaging almost 25% fewer new cases now than it was at last year’s summer nadir.

But as we head into the week, you can see from the charts above that the numbers for all five states are quite low. Pennsylvania and Illinois lead, but are also some of the most populated states in the country. They sit at 403 and 336, respectively. New Jersey and Virginia, more middle-tier states in terms of population, are also fairly close with their new cases as their averages begin the week at 168 and 143, respectively. Delaware, as we noted above is sitting on 33.

So what about deaths? Last week I discussed a pattern of bottoming out, especially for Pennsylvania and Illinois. Unfortunately, I also noted how Pennsylvania had an aberrant large, one-day spike of deaths that influenced the seven-day average.

Death curves for PA, NJ, DE, VA, & IL.

This week you can clearly see that spike in Pennsylvania phasing out of the data set. That’s good, because it allows us to begin to evaluate the true state of Pennsylvania’s average. That average? 18, which is squarely in line with the average before the spike. In other words, Pennsylvania may have indeed bottomed out.

Illinois, however, has resumed a slight push downward, as the seven-day average yesterday just hit 16, down three from Saturday’s 19. I’ll want to see that trend persist throughout the week before saying that Illinois has resumed declining death rates, but it’s a good start to the week.

In New Jersey and Delaware we continue to see falling numbers of deaths. This time last week we saw a small cluster of deaths that brought Delaware up from 0.3 deaths per day to 2.3. But Delaware is now back down to 0.3, perhaps the lowest it reasonably expected to be. New Jersey had just managed to fall below 10 deaths per day, and it’s nearly halved that at it enters the week at 6.3.

Virginia, unfortunately, is the outlier. Deaths had slipped below 10 for over a week. And last week they fell as low as 7.7. But as of yesterday they have climbed back over 10. We need to watch this week to see if there is truly a rising number of deaths or if we are seeing the emergence of more of a bottom or floor in terms of deaths.

Finally we have vaccinations.

Full vaccination totals

Unfortunately, the City of Philadelphia’s website has been broken for over a week and they’re now only reporting updates twice a week anyway. In other words, the data for Pennsylvania isn’t great. Because while we can report the rest of the Commonwealth, the City of Philadelphia—excluding the suburban counties—on its own represents nearly 13% of Pennsylvania. That’s a huge chunk to be missing.

That leaves us with Illinois and Virginia.

The good news is that they are going up and that Illinois just hit 45% fully vaccinated. Virginia is now at 47%. The bad news is that it took a week for both states to climb up one percentage point. More evidence that vaccinations are slowing dramatically with millions left unvaccinated.

And we’re going to need them to get vaccinated. Consider the United Kingdom, another Western country doing well in its vaccination programme and that had decided to increasingly open up large swathes of its economy.

That is now on hold for another four weeks. The UK had planned to end its lockdown on 21 June, but that will now be extended into the end of July. And it’s all due to the Delta, formerly Indian, variant that has taken root in the UK. It’s more transmissible than the earlier UK variant, which the UK called the Kent variant.

The Delta variant has emerged in small numbers here in the US. But in order to prevent another surge that could threaten our healthcare systems, we need to get people vaccinated. It’s not inconceivable that the US may need to reinstate restrictions or full lockdowns if the Delta variant were to take root and swamp the US healthcare system.

And so I will end this post as I began it. If you haven’t started your vaccination process, I encourage you to do so. The vaccines have been proven safe and effective. And if you’re worried about cost, they’re free.

Credit for the piece is mine.

Easing Back into Normalcy

Happy Friday, all. Apologies for the lack of posting yesterday, I wasn’t feeling well and sitting in front of my computer typing stuff up wasn’t happening. But now the weekend is nearly upon us and to get in the mood I wanted to share this great dot plot from xkcd. It captures something I’ve definitely been thinking about.

Hopefully crossing most of these off in the next few weeks/months.

For example, on 3 March 2020, I had a friend over to my flat for drinks and to watch the Super Tuesday Democratic primary results come in. Tomorrow, if all goes according to plan, will be the first time I’ve had company over in 15 months.

In essence we have check boxes of the normal things we did in the before times and we’re just checking them off one by one until we can feel normal again.

Just please don’t contract a novel bat virus again.

Credit for the piece goes to Randall Munroe.

Covid Update: 7 Jun

Technical difficulties yesterday. But I wanted to run the latest Covid numbers to start this week of posting, so we’re just going to use the Monday data, which is the lowest of the week since it captures the data reported by authorities on Sunday. That said, where are we?

Last week we began to see a slowdown in the rate of declining cases, though, crucially, cases were still in decline. The good news is that cases continue to decline. The seven-day averages for all five states are now well below 1,000 new cases per day, with Illinois dipping below 500. Only Pennsylvania remains above that level at 544 new cases per day.

New case curves for PA, NJ, DE, VA, & IL.

We are no longer seeing the numbers fall by hundreds per day, most notably in New Jersey, but we remain in a race to the bottom. Unfortunately, with significant numbers of the population refusing vaccination and the near certainty of this coronavirus becoming endemic, i.e. a persistent, circulating virus, we will never reach zero. The numbers at some point will bottom out and a slowing rate of decline could indicate nearing that point.

Death curves for PA, NJ, DE, VA, & IL.

Deaths have continued their even slower decline over the last week. New Jersey’s seven-day average fell into the high single digits for the first time since November. Virginia, which had flirted with single-digit days, has now reported a week-long run of about nine deaths per day. Delaware, due to its low population only reached double digits for most of February, but has seen a slight uptick to over two deaths per day.

The two most interesting states with regards to deaths are Illinois and Pennsylvania, for different reasons. Starting with Illinois, we are beginning to see a pattern of bottoming out. For most of the last week the seven-day average has hovered about 20 with day-to-day changes of one or two additional/fewer deaths per day. We will have to watch over the coming week whether the numbers can resume pushing downwards or if we continue to see this bottoming out.

Then we have Pennsylvania. Through the beginning of the weekend, we saw progress as the Commonwealth’s seven-day average dropped below 20 deaths per day for the first time since October. Two days ago the Department of Health reported an additional 185 deaths, but then yesterday the total number of deaths dropped by 174. I haven’t yet been able to piece together what happened, but it does make the sudden spike in the seven-day average—to 46 deaths per day—a wee bit suspect.

Finally we have vaccinations. And the news is there is no news. Over the last week we have seen almost zero growth in the number of fully vaccinated individuals in Pennsylvania (1.8 percentage points), Virginia (1.53 pts), and Illinois (2.41 pts).

Total full vaccinations in PA, VA, & IL.

If we look at where the cumulative rates remain stuck, however, we see numbers in the mid-40s, short of 2/3 the estimated herd immunity range. The flattening of the curve, indicating slowing rates of vaccination, have become increasingly pronounced. This is not the curve we want to see flattened. Ideally this slowdown would have occurred nearer the 70% range and we could have eased into the estimated herd immunity range.

That said, we are approaching 50% in these three states and numerous communities, though not all, within these states are now over 50% fully vaccinated. But the longer we have largely unvaccinated reservoirs available, the more likely it is we will see new variants emerge that could potentially evolve to be more transmissible or even more deadly.

And so for any of my readers who haven’t received their shots yet, I encourage you to please do so. They’re free, they’re effective, and they’re necessary for us to get back to some sense of normal.

Credit for the piece is mine.

Covid Update: 31 May

Last week I wrote about how new cases had maybe flattened a wee bit in their rapid drop from peaks earlier this year. But the good news is that even in where new cases declines may have slowed down, they continue to decline.

New case curves for PA, NJ, DE, VA, & IL.

We can see the tails at the right ends are all back to declining shapes. Delaware is perhaps the most deceptive, because remember that there was the anomalous spike from late processing of earlier new cases.

I had noted that deaths had finally seen some data showing them dropping. That has held true to some degree.

Death curves for PA, NJ, DE, VA, & IL.

Indeed, the tails at the end of each state have shown slow declines. Delaware is even near 0 deaths per day. Illinois, however, is an exception with a small increase lately.

Finally, a brief look at vaccinations.

Full vaccination curves for PA, VA, & IL.

You can see that the rate of full vaccinations has begun to slow. All three states we cover are over 40%, though all are below 45%. Pennsylvania is difficult to evaluate, however, because for the last four days Philadelphia has not updated its numbers. And as the largest county by far in the state, it’s shifts can swing the overall state numbers.

Credit for the piece is mine.

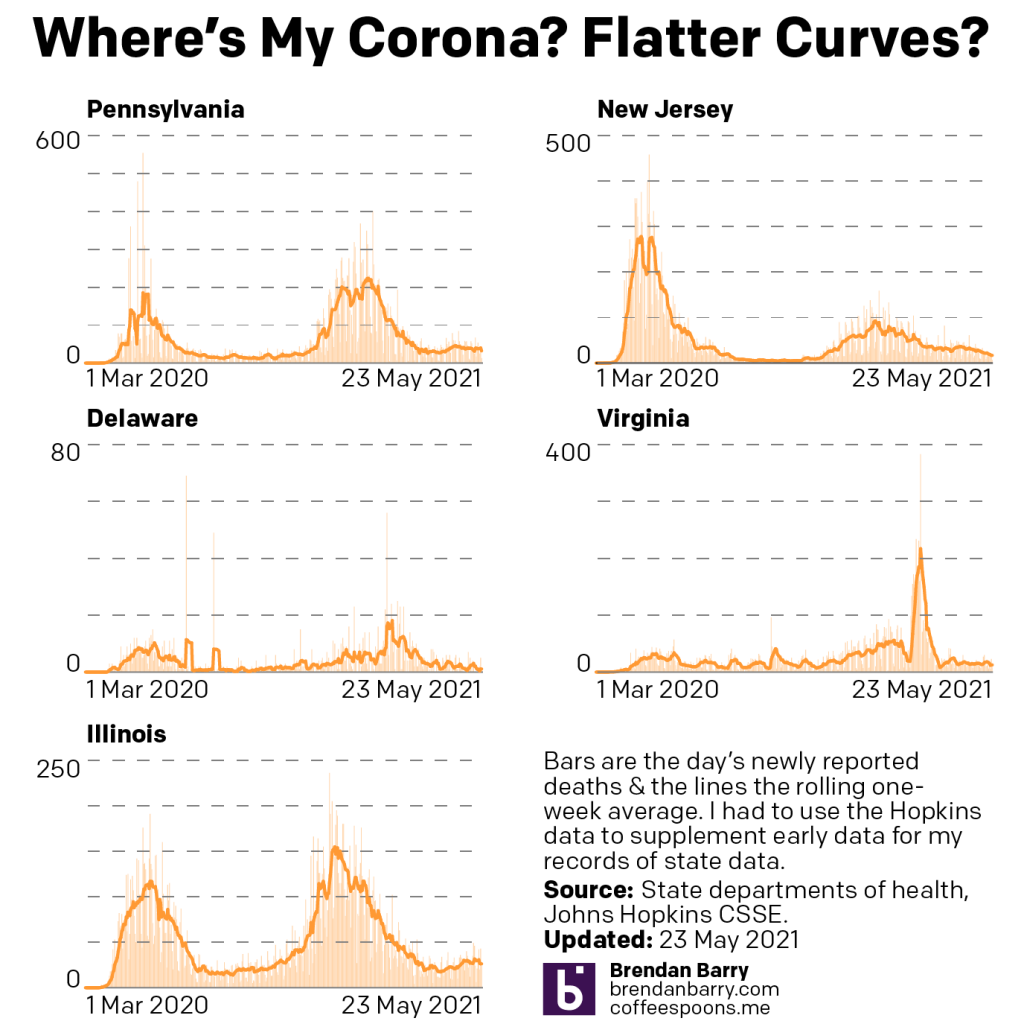
Covid Update: 23 May

Last week I wrote about how we were seeing new cases continuing to rapidly decline. This week we can say cases are still declining, but perhaps a bit less rapidly than earlier.

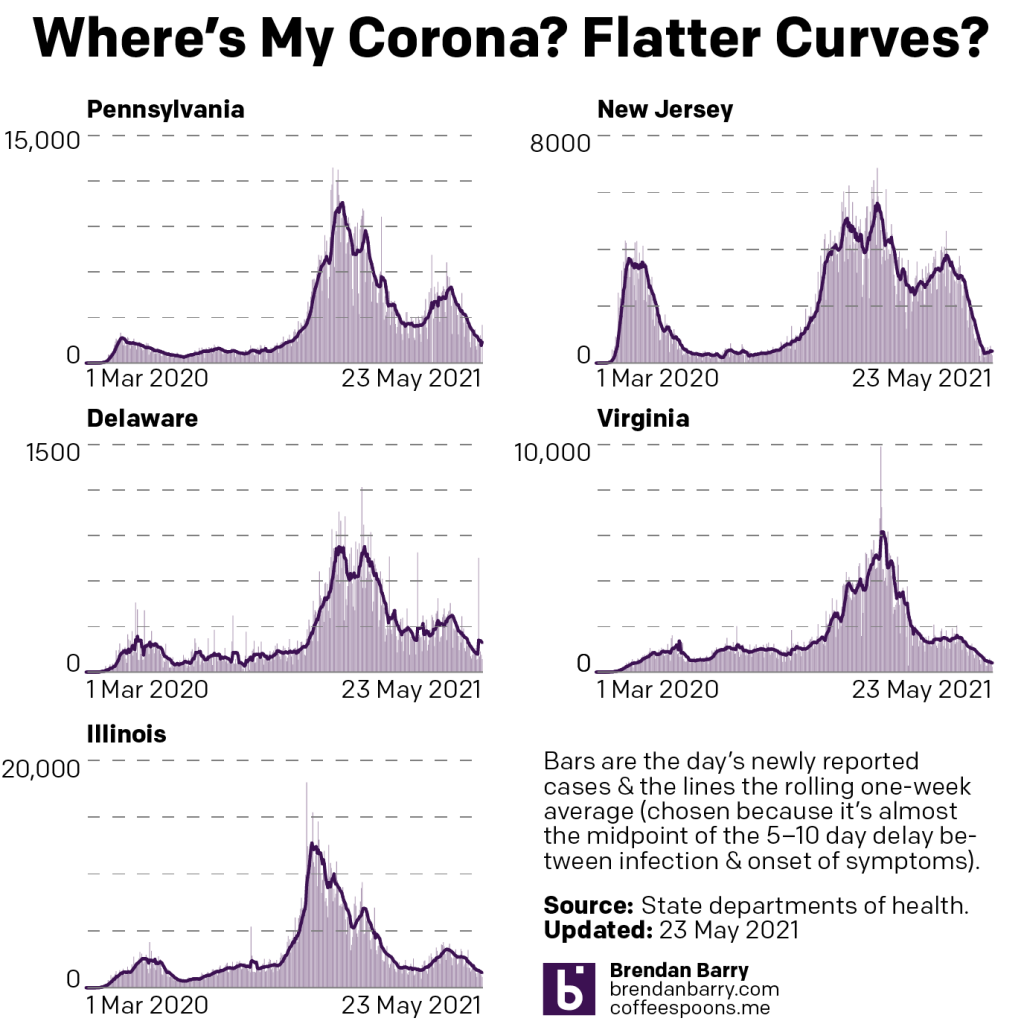
New case curves for PA, NJ, DE, VA, & IL.

The charts above show that slowdown in the tail at the right of the chart. First some points to note, Delaware reported that several hundred cases had not been entered into their database, and so we saw a one-time spike midweek. But note that after the spike, the numbers continue to trend down. In other words, the rapid decline was probably a bit less rapid than we saw, but it was still a decline.

Pennsylvania’s chart has a problem of your author’s own design. Now that I’m fully vaccinated I was able to leave the flat this weekend and the Pennsylvania data wasn’t ready by the time I left on Saturday. But by the Sunday data, it was and so the 2500 new cases is probably split somehow between those days—accounted for by the seven-day average. This points to a broader question for which I do not yet have an answer: as life increasingly returns to normal, how much longer will I continue to update these charts?

I started these graphics as a way for myself to track the spread of the virus in my home state and the state where I still have a large number of friends. At the time, there were few if any visualisations out there doing this. Now most media outlets have them and my work at home led to a similar project at work. The reason I continued to make these was you, my readers here and in other places where I post this work. Your comments, messages, texts, and emails made it clear you valued the work. First, I know there are still many people left to be fully vaccinated, nearly half the population, and due to bias, some of the people most likely to follow these posts are those most likely to get vaccinated as early as possible. But please let me know, readers, if you’re still getting value out of these graphics.

But back to the data, in two of the remaining three states, Virginia and Illinois, we saw numbers continue to decline. New Jersey, however, shows a tail with a slight uptick in the seven-day average of new cases. This will be something I follow closely this coming week.

Deaths finally appear to be dropping.

Death curves for PA, NJ, DE, VA, & IL.

Not by large numbers, no, but in Virginia and Illinois we saw declines of 5 deaths per day. Pennsylvania was even greater with a decline of 7. We are still above rates we saw last summer, but it does appear that finally we have hit the inflection point we have been waiting for the last several weeks.

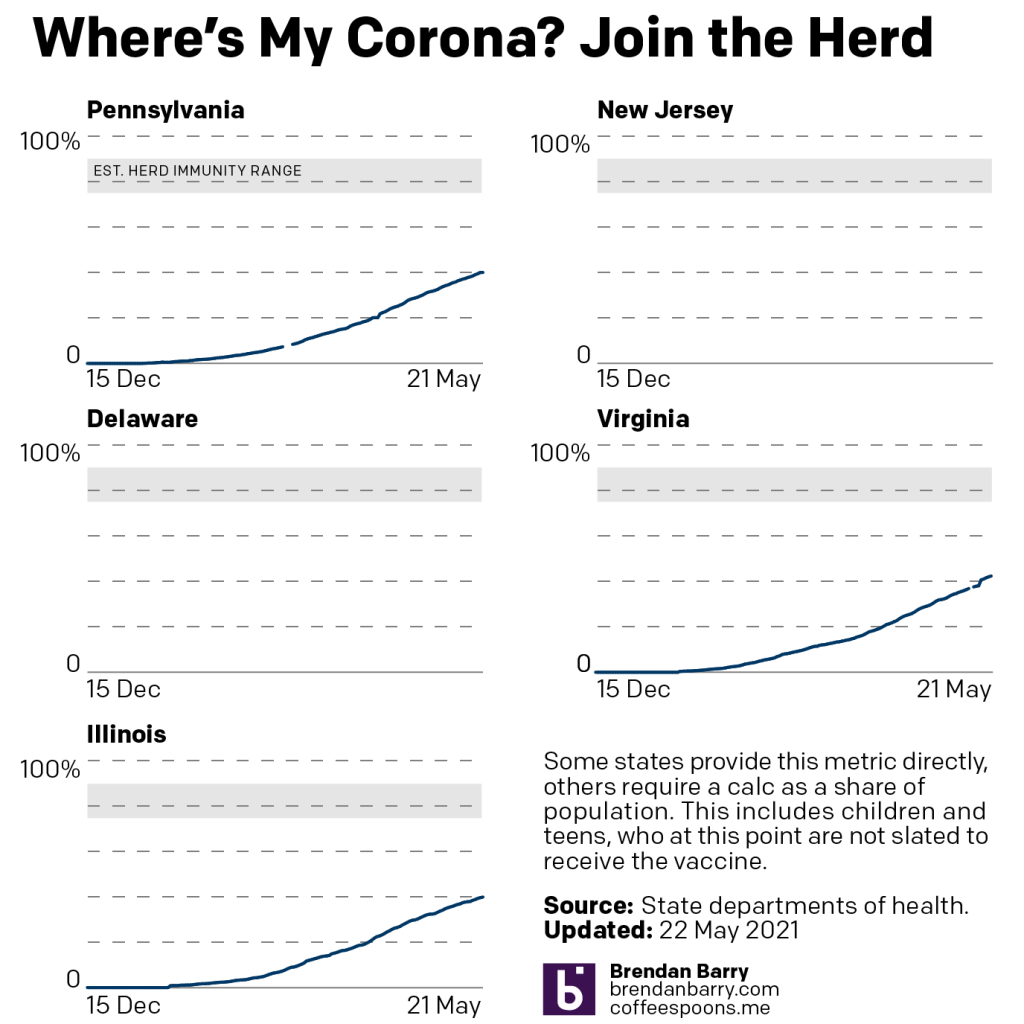
Finally we have vaccinations. These charts look at the cumulative number of people fully vaccinated.

Fully vaccinated curves for PA, VA, & IL.

And in that the number keeps going up, and that’s good. But they can also only keep going up. But if you look closely at the right tail of the curve, you begin to see it flattening out as the rate of daily vaccinations begins to drop. Unfortunately we’re well below levels we think we’d need for herd immunity. But, to try and look at the positive, we’re almost halfway there and that is certainly playing a role as we can see with the rapid decline in numbers of new cases. But we need to keep trying to get more people vaccinated.

Credit for the piece is mine.

The Month That Lasted a Year

Two Fridays ago I received my second dose of the vaccine. In other words, I’m fully vaccinated and can resume doing…things. Anything. And so this piece from xkcd seemed an appropriate way to wrap up what has been a horrible, no good, terrible year.

The longest month of our lives.

Credit for the piece goes to Randall Munroe.

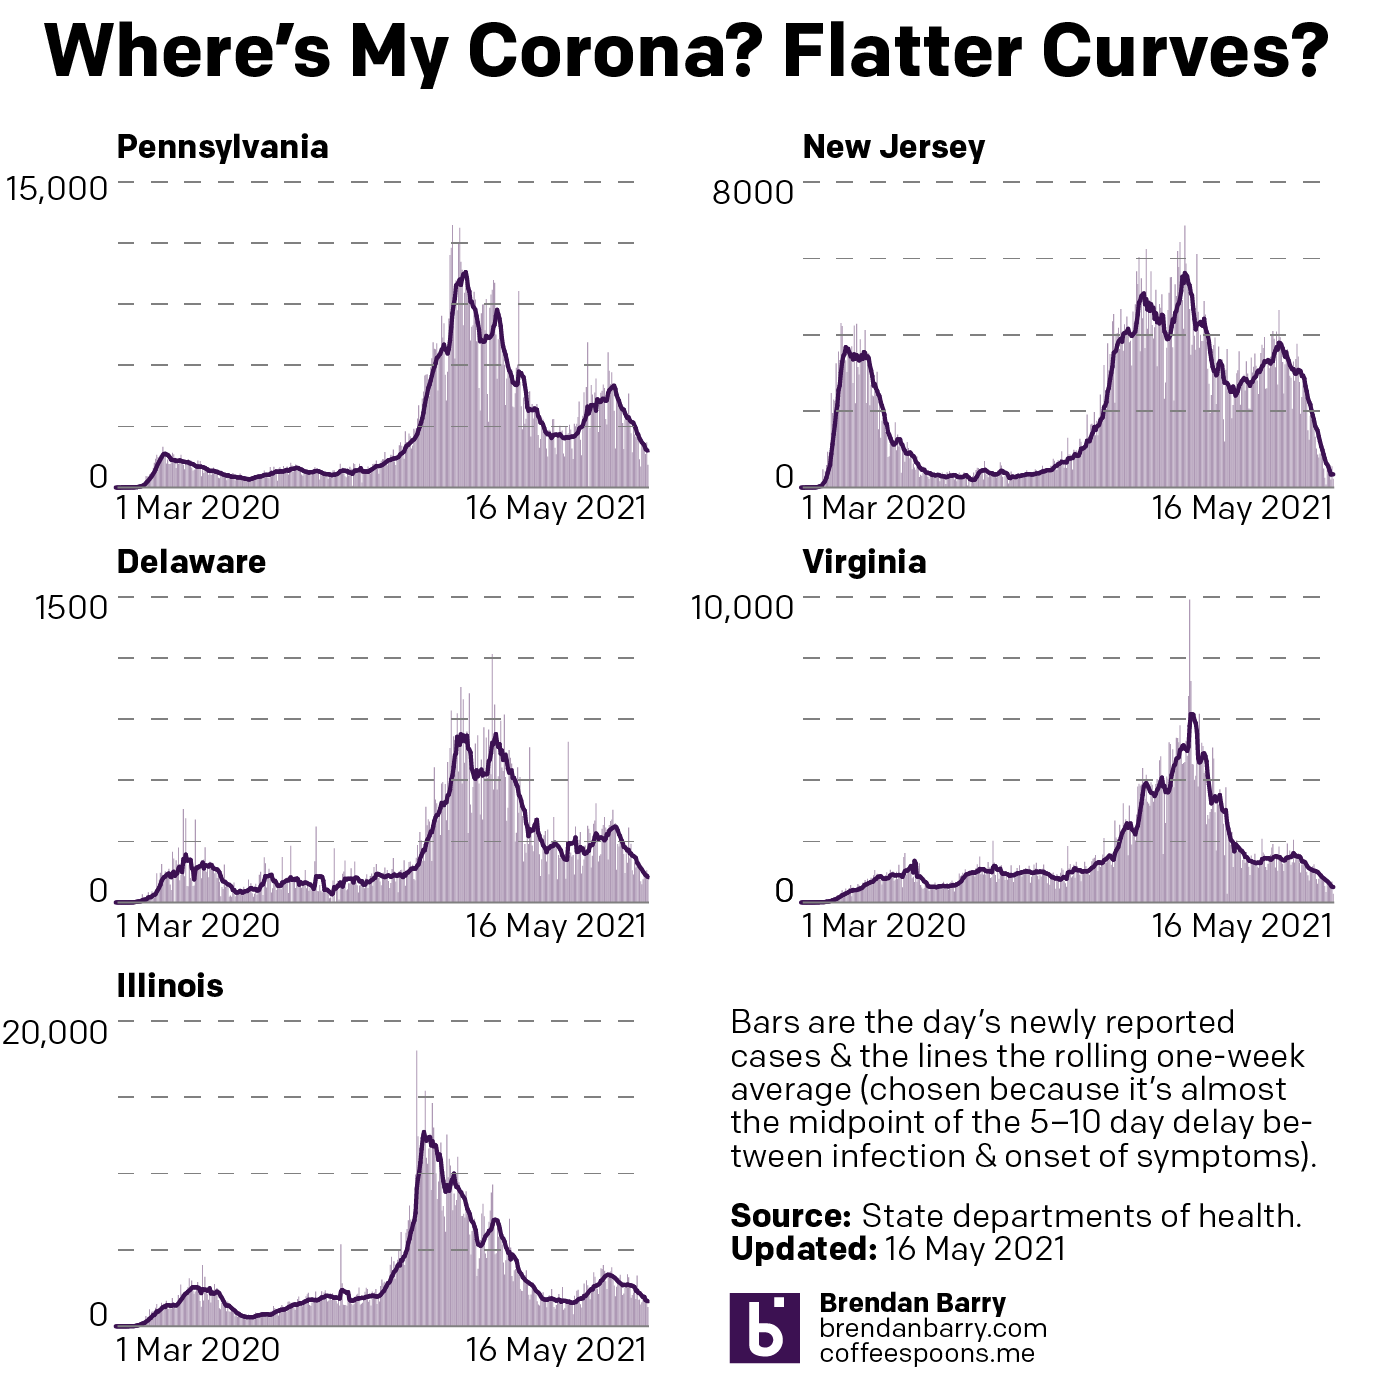
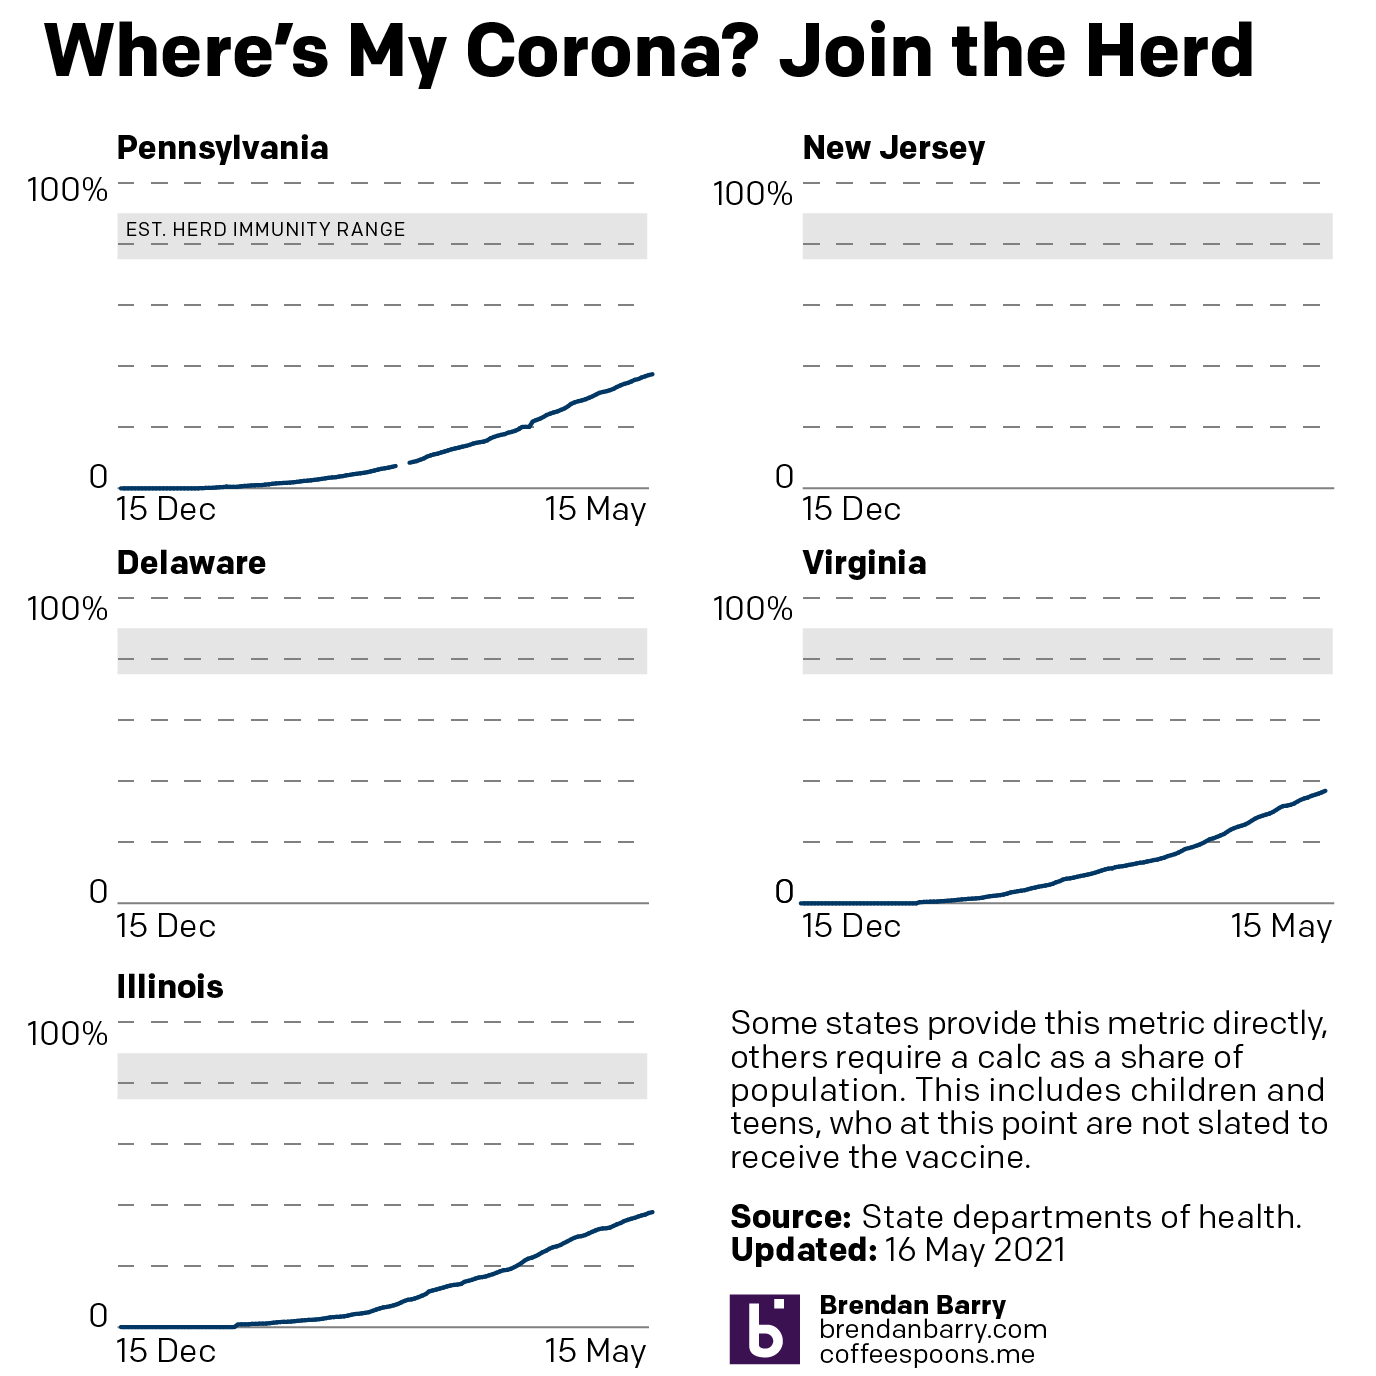
Covid Update: 16 May

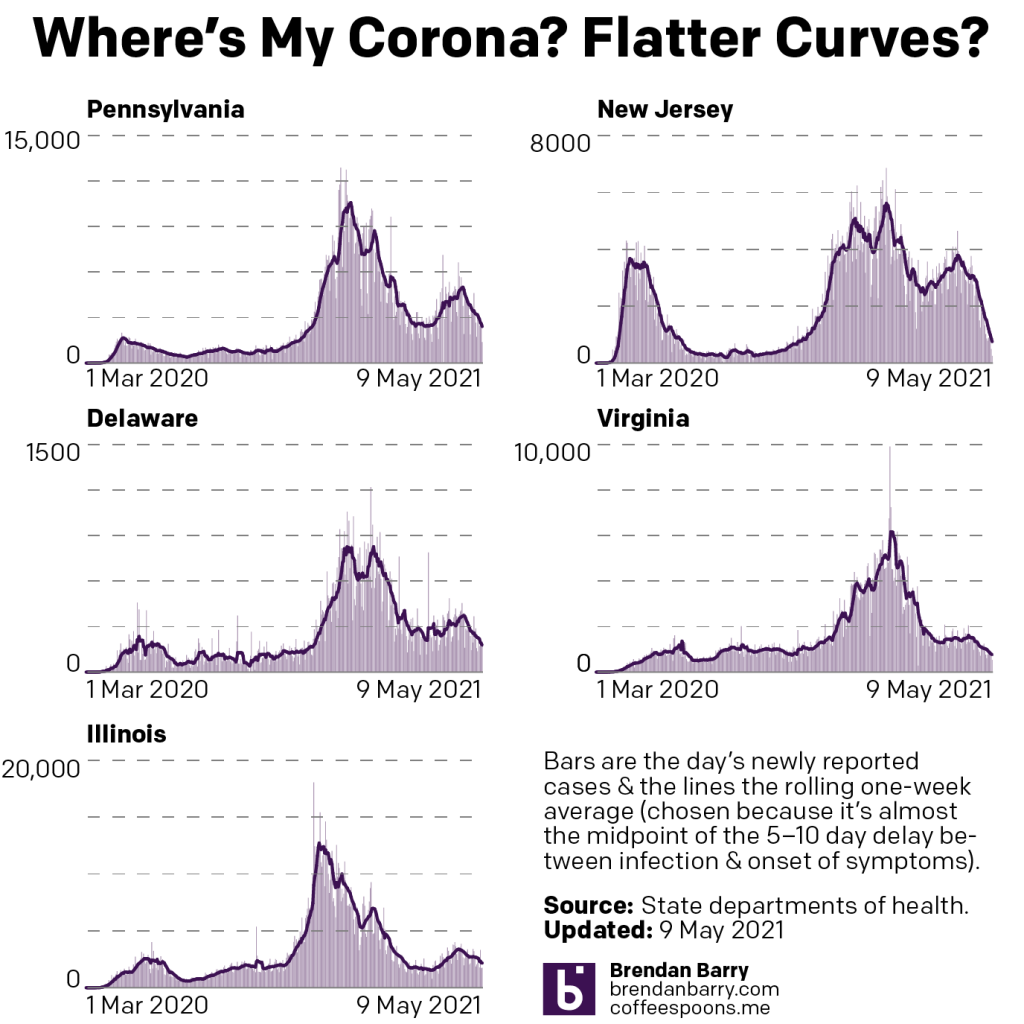
Last week I wrote about how new cases in the five states we cover (Pennsylvania, New Jersey, Delaware, Virginia, and Illinois) were falling and falling rapidly. And this week that pattern continues to hold.

New case curves for PA, NJ, DE, VA, & IL.

If we look at the Sunday-to-Sunday numbers, daily new cases were down in all five states. If we look at the seven-day averages, cases are down in all states. Pennsylvania and Illinois are now down below 2000 new cases per day, Virginia is just over 500 per day, New Jersey is below 400, and Delaware is over 100. These are all levels we last saw last autumn. In other words, we’re not quite back to summer levels of low transmission, but this time next month, I wouldn’t be surprised if we were.

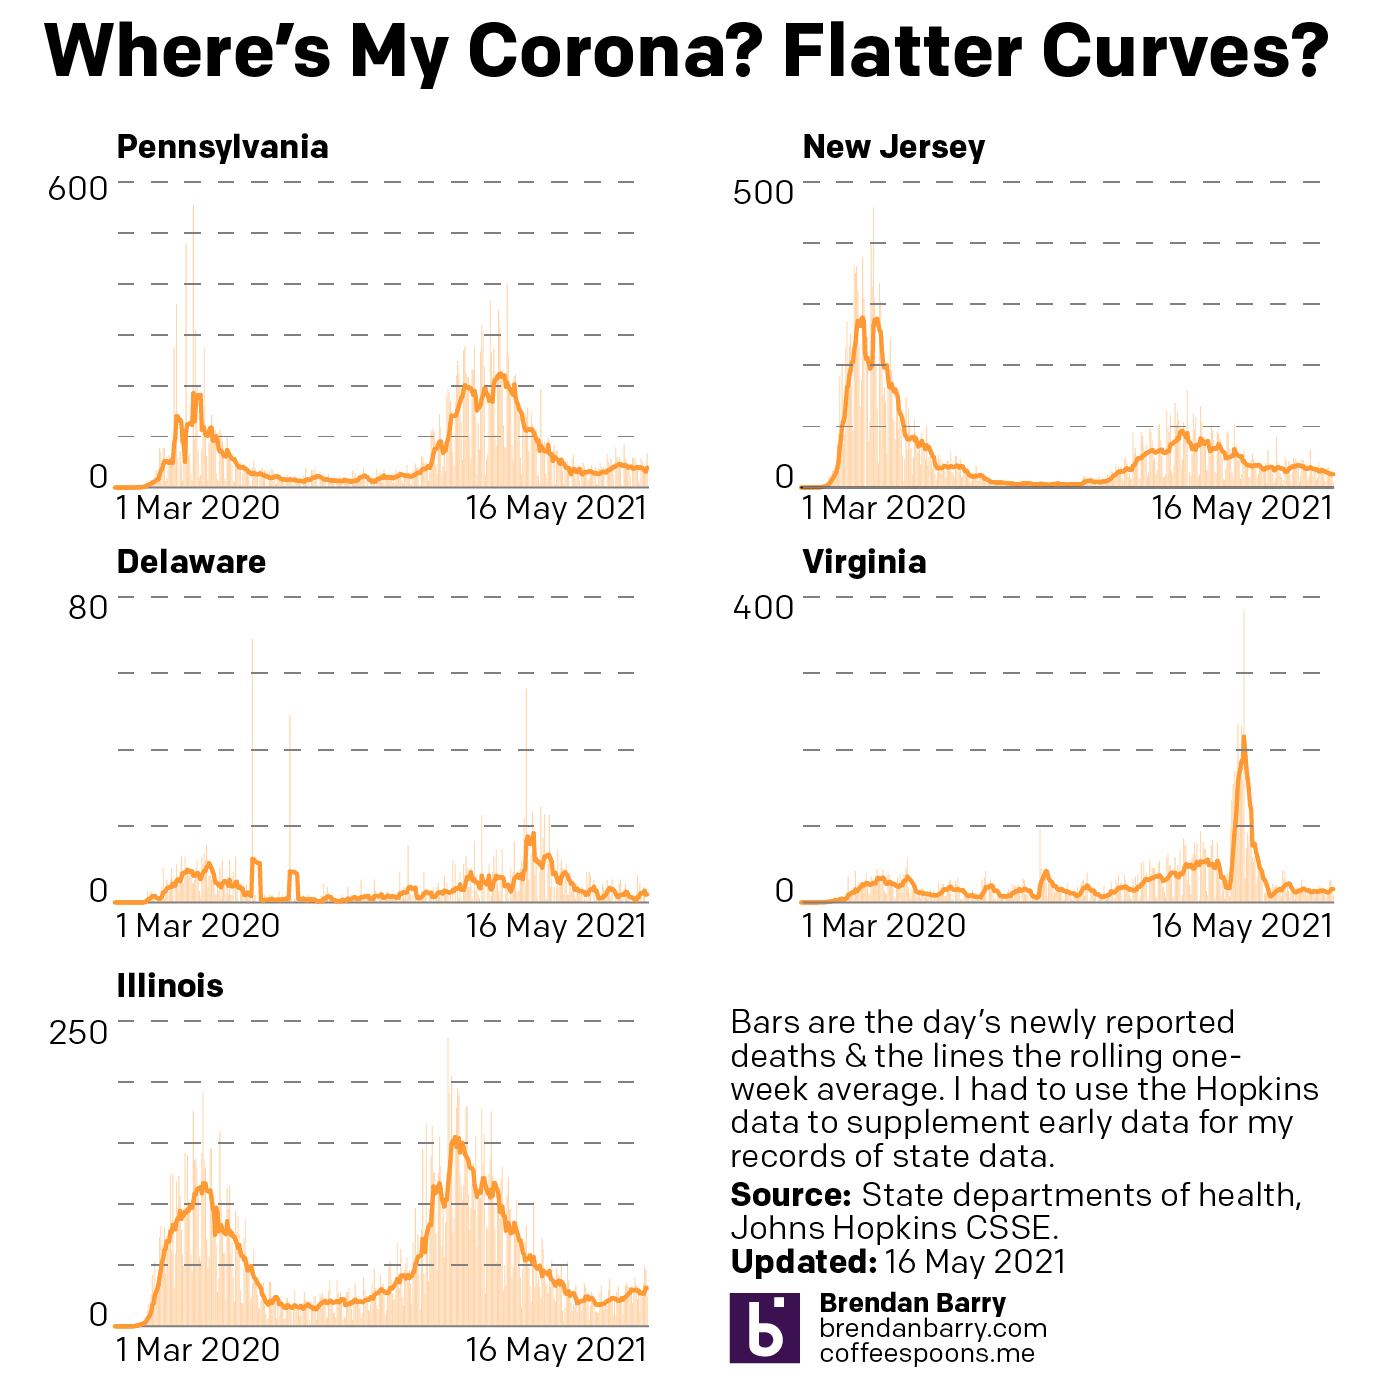
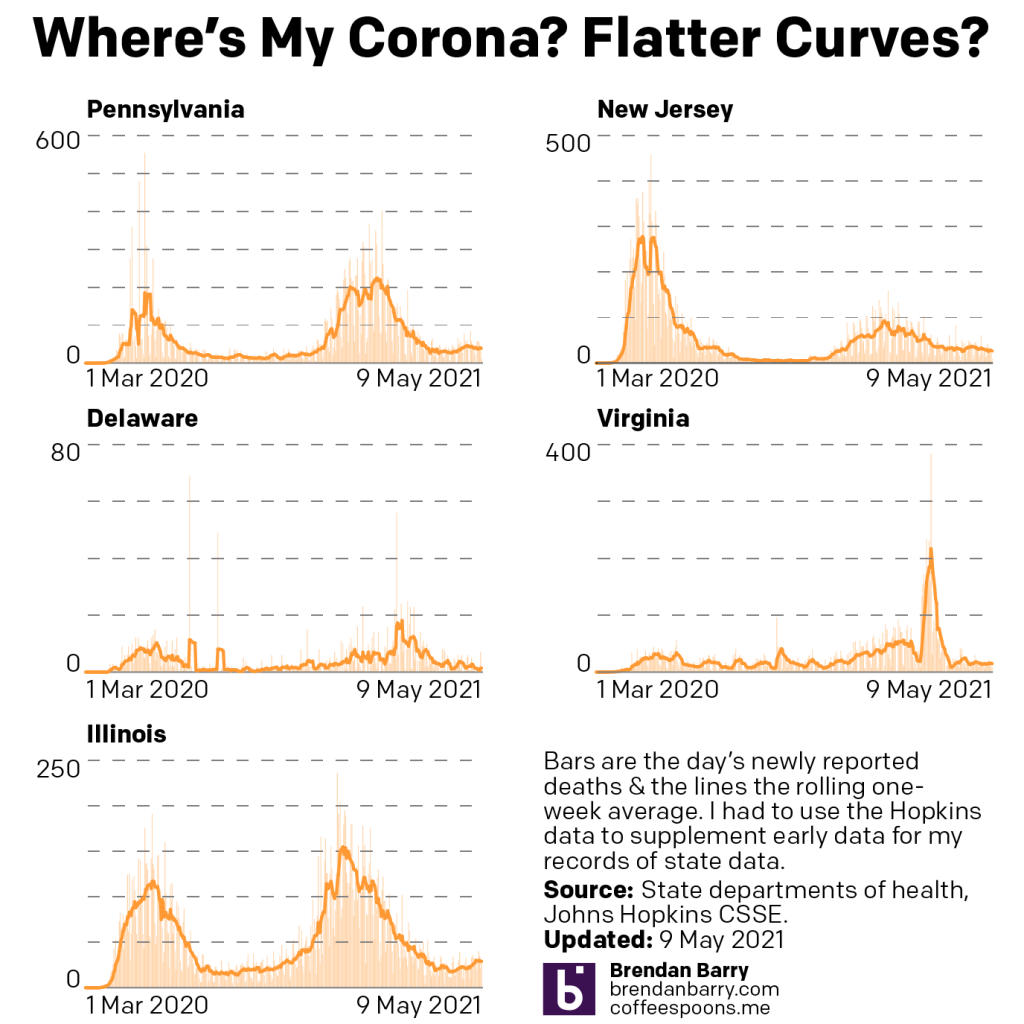
Deaths remain stubbornly resistant to falling.

Death curves for PA, NJ, DE, VA, & IL.

In fact, if we compare the Sunday-to-Sunday numbers we see that the numbers yesterday were largely the same as last Sunday, except in Pennsylvania where they were up significantly. The seven-day average?

Here’s where it gets interesting, because deaths are up slightly. Not by much, for example, Illinois was at 29.1 deaths per day last Sunday, this Sunday? 30.9. Illinois isn’t alone. Pennsylvania, Delaware, and Virginia all have reported slight upticks in their death rates.

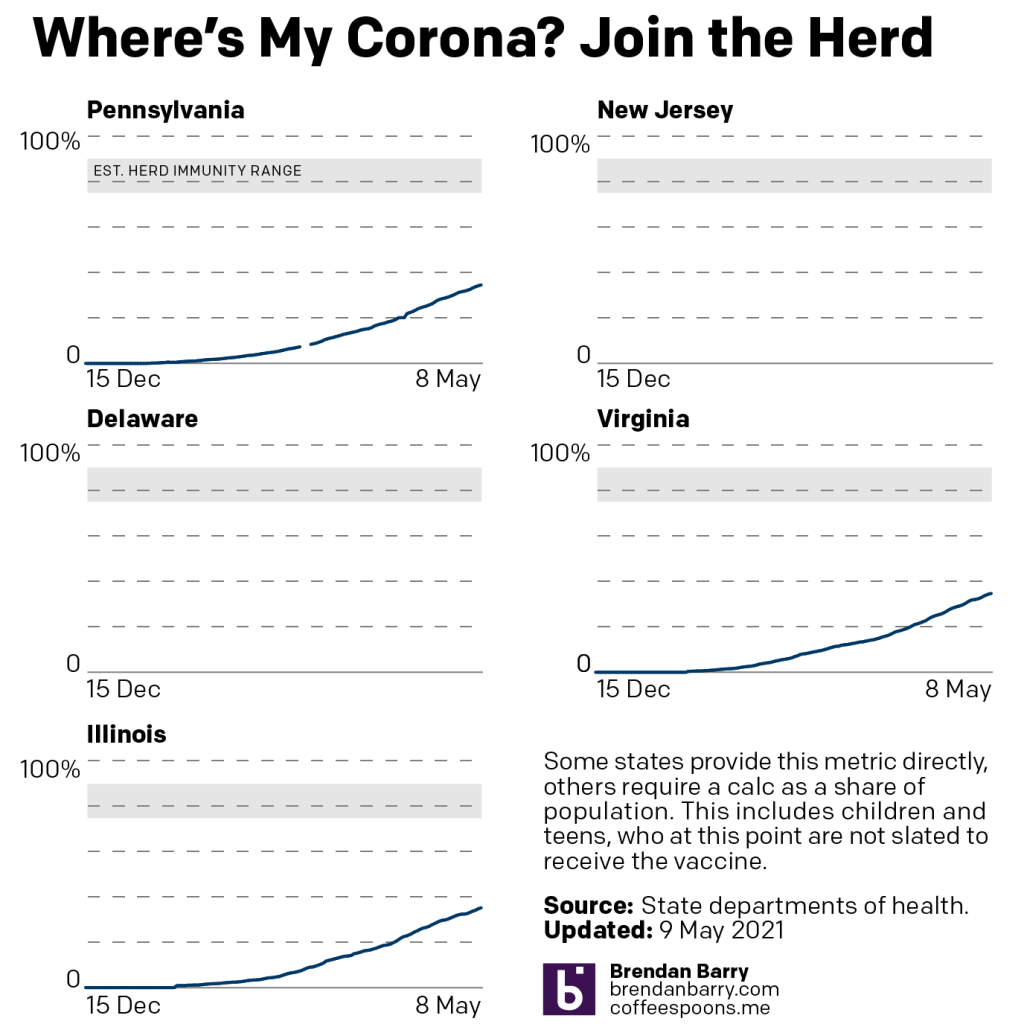
But the biggest concern is the continuing slowdown in vaccinations. We’re perhaps halfway to the point of herd immunity in the three states we track. All three are between 37% and 38%. The thing to track this coming week will be if the rate continues to slow.

Total full vaccination curves for PA, VA, & IL.

Credit for the piece is mine.

Covid Update: 9 May

Last week I wrote about how, for new cases, we had seen a few consecutive days of increasing cases. Were we witnessing an aberration, a one-off “well, that was weird”? Or was this the beginning of a trend towards increasing new cases?

A week later and we have our answer. Just a one-off.

New cases curves for PA, NJ, DE, VA, & IL.

If we focus on just the seven-day average, in just one week the numbers in New Jersey have fallen by half. In Pennsylvania, Virginia, it’s by one quarter. Illinois is a little less than that, as is Delaware. Across the board, numbers are falling and falling quickly.

Deaths curves for PA, NJ, DE, VA, & IL.

When we move to deaths, we’re beginning to see an improvement. As the lagging indicator, we would expect these to begin to drop a few weeks after new cases begin to drop. We have begun to see what might be the peaks of deaths in a few states.

Full vaccination curves for PA, NJ, DE, VA, & IL.

Over this coming week, I’ll be closely watching these numbers to see if we can finally begin to say authoritatively that deaths are in decline.

Vaccinations drive all of this. And we continue to see the total number of fully vaccinated people climbing in Pennsylvania, Virginia, and Illinois. But, that rate is slowing down. Most likely we are entering a phase where those eager for their shots have largely received them. Now begins the challenge of vaccinating those who might lack easy access or have reservations.

But to be clear, we need those people to become fully vaccinated before we can truly begin to return to normal. Whatever normal is. It’s hard to remember anymore.

Credit for the piece is mine.