Technical difficulties yesterday. But I wanted to run the latest Covid numbers to start this week of posting, so we’re just going to use the Monday data, which is the lowest of the week since it captures the data reported by authorities on Sunday. That said, where are we?
Last week we began to see a slowdown in the rate of declining cases, though, crucially, cases were still in decline. The good news is that cases continue to decline. The seven-day averages for all five states are now well below 1,000 new cases per day, with Illinois dipping below 500. Only Pennsylvania remains above that level at 544 new cases per day.
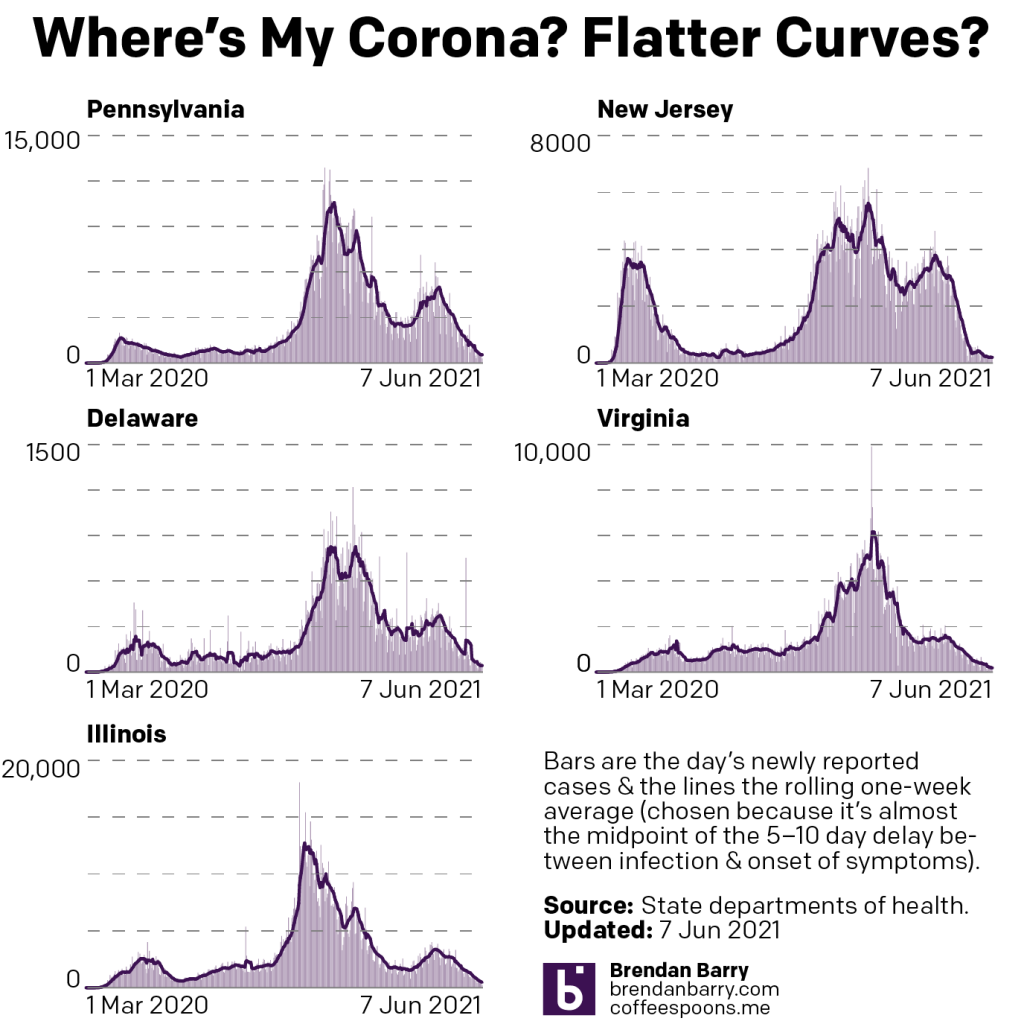
We are no longer seeing the numbers fall by hundreds per day, most notably in New Jersey, but we remain in a race to the bottom. Unfortunately, with significant numbers of the population refusing vaccination and the near certainty of this coronavirus becoming endemic, i.e. a persistent, circulating virus, we will never reach zero. The numbers at some point will bottom out and a slowing rate of decline could indicate nearing that point.
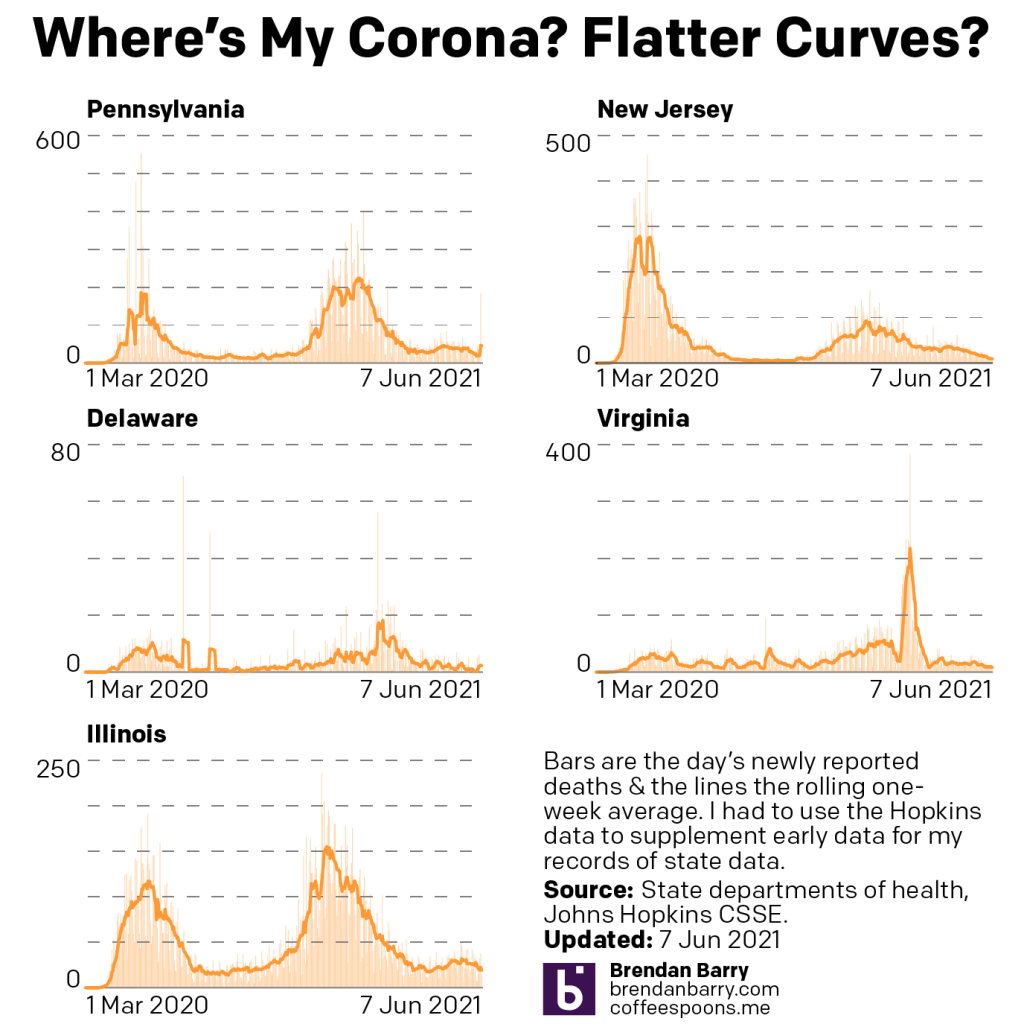
Deaths have continued their even slower decline over the last week. New Jersey’s seven-day average fell into the high single digits for the first time since November. Virginia, which had flirted with single-digit days, has now reported a week-long run of about nine deaths per day. Delaware, due to its low population only reached double digits for most of February, but has seen a slight uptick to over two deaths per day.
The two most interesting states with regards to deaths are Illinois and Pennsylvania, for different reasons. Starting with Illinois, we are beginning to see a pattern of bottoming out. For most of the last week the seven-day average has hovered about 20 with day-to-day changes of one or two additional/fewer deaths per day. We will have to watch over the coming week whether the numbers can resume pushing downwards or if we continue to see this bottoming out.
Then we have Pennsylvania. Through the beginning of the weekend, we saw progress as the Commonwealth’s seven-day average dropped below 20 deaths per day for the first time since October. Two days ago the Department of Health reported an additional 185 deaths, but then yesterday the total number of deaths dropped by 174. I haven’t yet been able to piece together what happened, but it does make the sudden spike in the seven-day average—to 46 deaths per day—a wee bit suspect.
Finally we have vaccinations. And the news is there is no news. Over the last week we have seen almost zero growth in the number of fully vaccinated individuals in Pennsylvania (1.8 percentage points), Virginia (1.53 pts), and Illinois (2.41 pts).
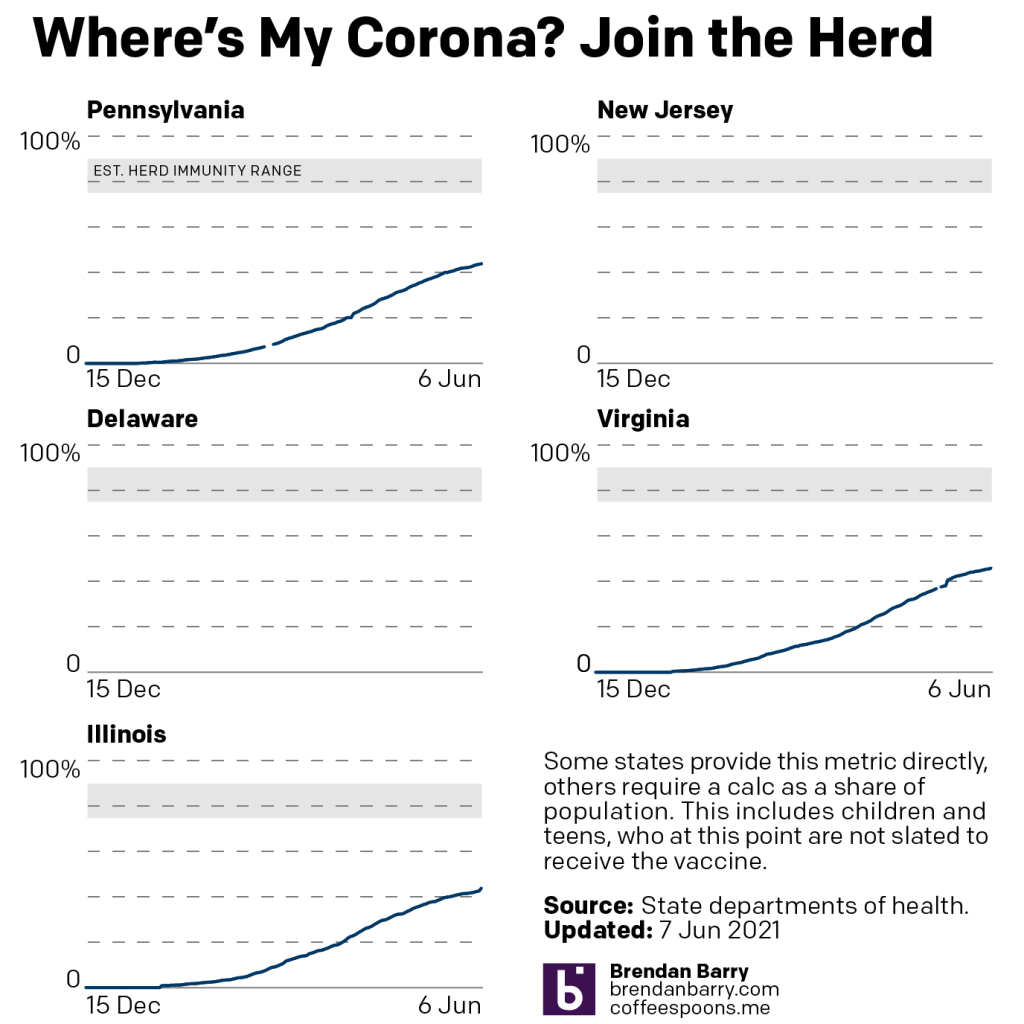
If we look at where the cumulative rates remain stuck, however, we see numbers in the mid-40s, short of 2/3 the estimated herd immunity range. The flattening of the curve, indicating slowing rates of vaccination, have become increasingly pronounced. This is not the curve we want to see flattened. Ideally this slowdown would have occurred nearer the 70% range and we could have eased into the estimated herd immunity range.
That said, we are approaching 50% in these three states and numerous communities, though not all, within these states are now over 50% fully vaccinated. But the longer we have largely unvaccinated reservoirs available, the more likely it is we will see new variants emerge that could potentially evolve to be more transmissible or even more deadly.
And so for any of my readers who haven’t received their shots yet, I encourage you to please do so. They’re free, they’re effective, and they’re necessary for us to get back to some sense of normal.
Credit for the piece is mine.
Leave a Reply
You must be logged in to post a comment.