In trying to limit my Covid-19 updates to Monday, bank holidays definitely affect the schedule. For my international audience, that meant Monday was a day of no posting. It also meant that some states—Illinois—were not reporting data. Add to that Illinois had already stopped reporting data on Saturday and Sunday, I wanted to wait until we had Tuesday’s data before putting it all together. And so here we are.
Last week I discussed “divergent patterns at the margins”. We saw some states continue their progress in decreasing the numbers of new cases with falls in their seven-day averages. You could group the tri-state area in this category. Then in the other group we had Virginia and Illinois where the seven-day average had begun to rise.
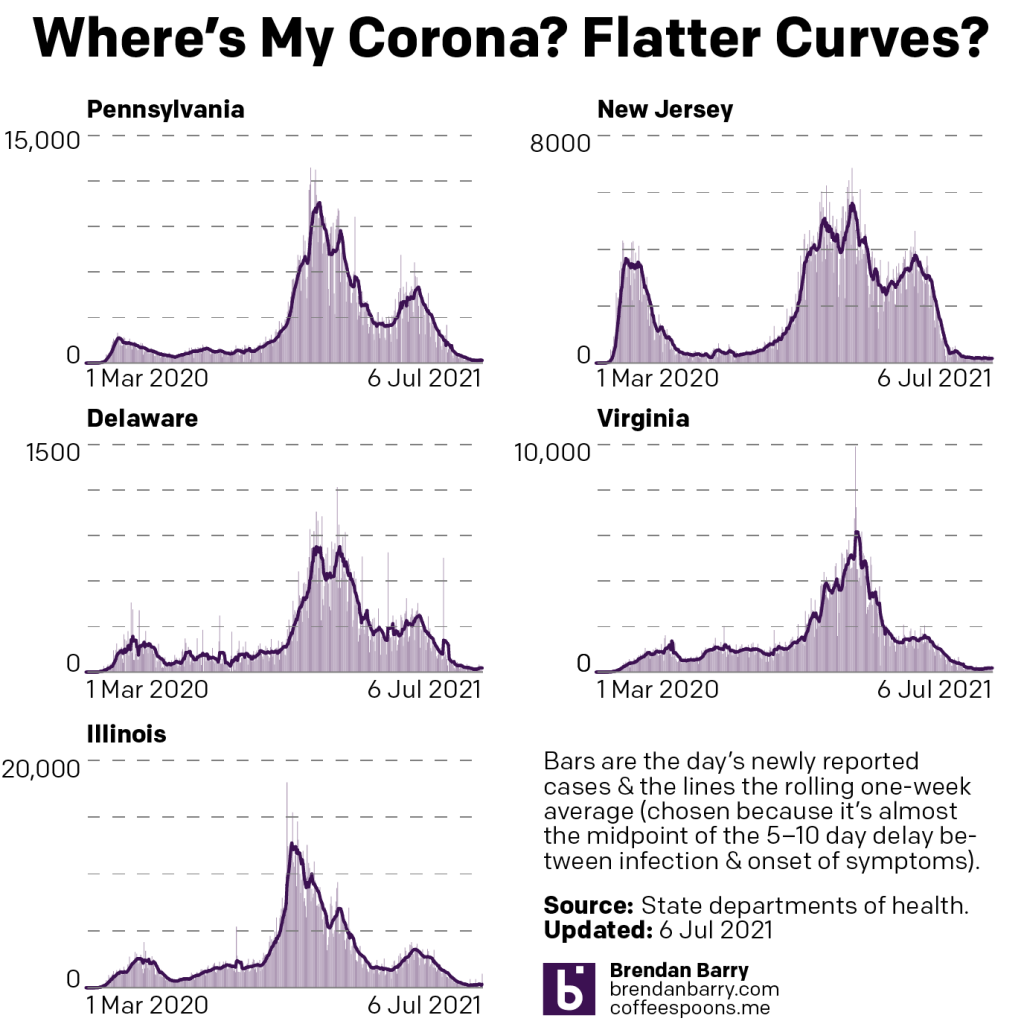
In the week since, this pattern largely held the same. Both Virginia and Illinois continued to see rising numbers of new cases. Compared to 20 June, before this pattern emerged, Virginia’s seven-day average sat at 129 new cases per day and Illinois was just slightly worse at 156. Yesterday those numbers were 180 and 328, respectively. A far cry from an emergency, yes, but also not ideal.
What about the tri-state area? Well we can now lump Pennsylvania and Delaware in with Virginia and Illinois since both states saw a rise in their seven-day averages. Back on 28 June Pennsylvania sat on an average of 177 new cases per day and Delaware was at 19. Yesterday those numbers were 181 and 27, respectively.
The difference here is that in both Pennsylvania and Delaware this recent rise is still below the numbers from 20 June. On that date Pennsylvania’s seven-day average was 261 new cases per day and Delaware’s was 28. So it’s not great, but it’s still not bad either.
How about New Jersey? The Garden State continues to see declining numbers of new cases. From the 20th to the 28th to yesterday the average has fallen from 179 to 176 to 162. Certainly not dramatic, but it’s progress nonetheless.
With deaths we saw broad and general progress, however, so that’s good.
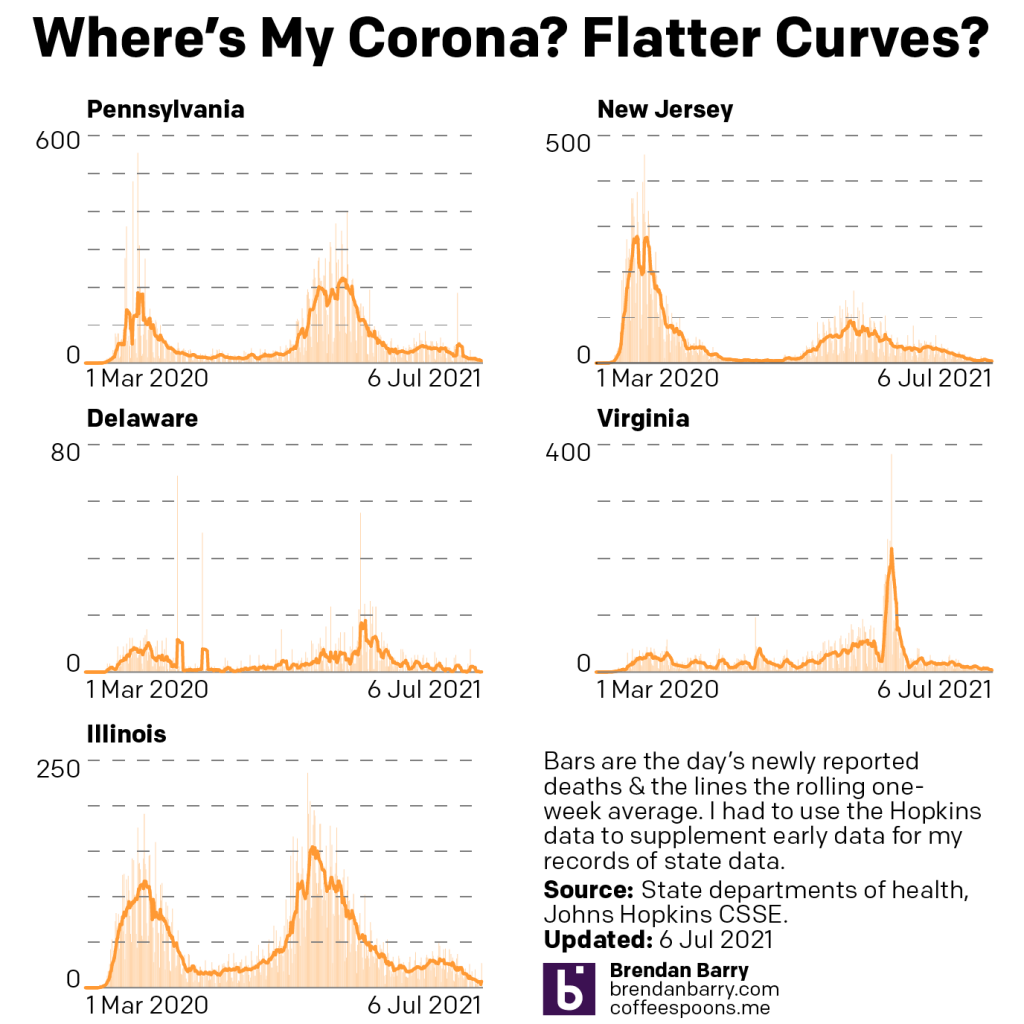
Last week I mentioned how I had hoped we would see Pennsylvania’s seven-day average of deaths slip into the single digits. Instead it had climbed higher. Well, Pennsylvania finally fell into the single digits and rests at 5 deaths per day.
When we look at the remaining states we see good news across the board. In Illinois the seven-day average fell from 9 to 7 deaths per day. In two states the numbers fell by half. New Jersey fell from 8 to 4 and Virginia went from 6 to 3. Finally, Delaware now averages just 0.1 deaths per day.
I don’t have the data on vaccination, because there are some holes and I want to see if I can fill that data out. But in the three states we track, we are talking about less than a percentage point increase in fully vaccinated people over the course of over a week. That continues to be not ideal.
Credit for the piece is mine.
Leave a Reply
You must be logged in to post a comment.