Technical difficulties prevented me from posting yesterday morning. But we’re back today and even though it’s a Tuesday, I wanted to begin the week with a post about the current status of Covid-19 in Pennsylvania, New Jersey, Delaware, Virginia, and Illinois.
Broadly speaking, things continue to improve. I don’t have all the vaccination data plugged in yet as I have to admit that as life begins returning to normal the time considerations of keeping track of Covid is not always insignificant. But I do at least have the new cases and deaths to look at and compare to last week.
When we look at new cases, we can see some divergent patterns at the margins.
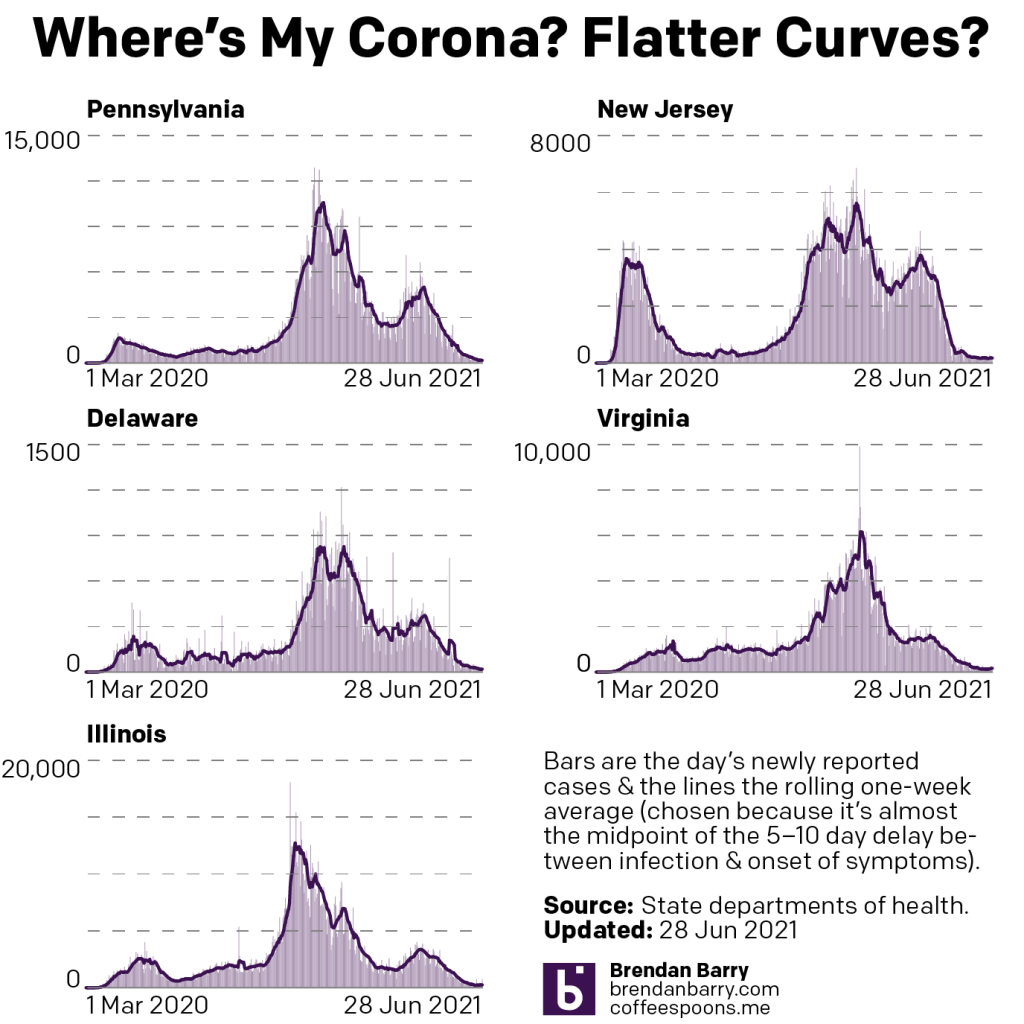
In the tri-state area, new cases continue to fall. Pennsylvania reported just 104 new cases yesterday and its seven-day average fell to 177. That’s great news. And in New Jersey, the daily new cases fell to 104 and the average to 176. And in Delaware the daily number was just 18 and the average 19.
On the other hand we have Virginia and Illinois. First, I should note that for the second straight weekend, Illinois did not report data. I think we can begin to assume this will be the new reporting schedule moving forward. Last week that impacted the seven-day average, but now that it is a periodic event we can see it accounted for in the average of 248 new cases per day.
The issue is that 248 is greater than last week’s average of 233 of the averages. In other words, there is some indications the virus is spreading once again. Though, the week-to-week numbers offer a slight hope. Last Monday we had 755 new cases—keeping in mind that no new cases were reported Saturday and Sunday—and yesterday 747. That is down, though not a lot. We will need to keep an eye on Illinois’ data and how it progresses through Friday.
In Virginia we see a similar pattern as that of Illinois. Week-to-week, yesterday’s number was just 88 new cases and last week’s 116. That’s good. However, a look at the seven-day average shows some reasons for concern. Last week we were discussing Virginia’s fall to 129 new cases per day. But as of yesterday the average has climbed back up to 165. And that’s not a one-day jump. Instead since that nadir of 129, the seven-day average steadily climbed each day last week. That suggests new cases may be spreading in Old Dominion once more. But let’s wait one more week before we begin to become overly concerned as 165 is still lower than the month’s current average of 169.
Deaths present us with the opposite pattern, however.
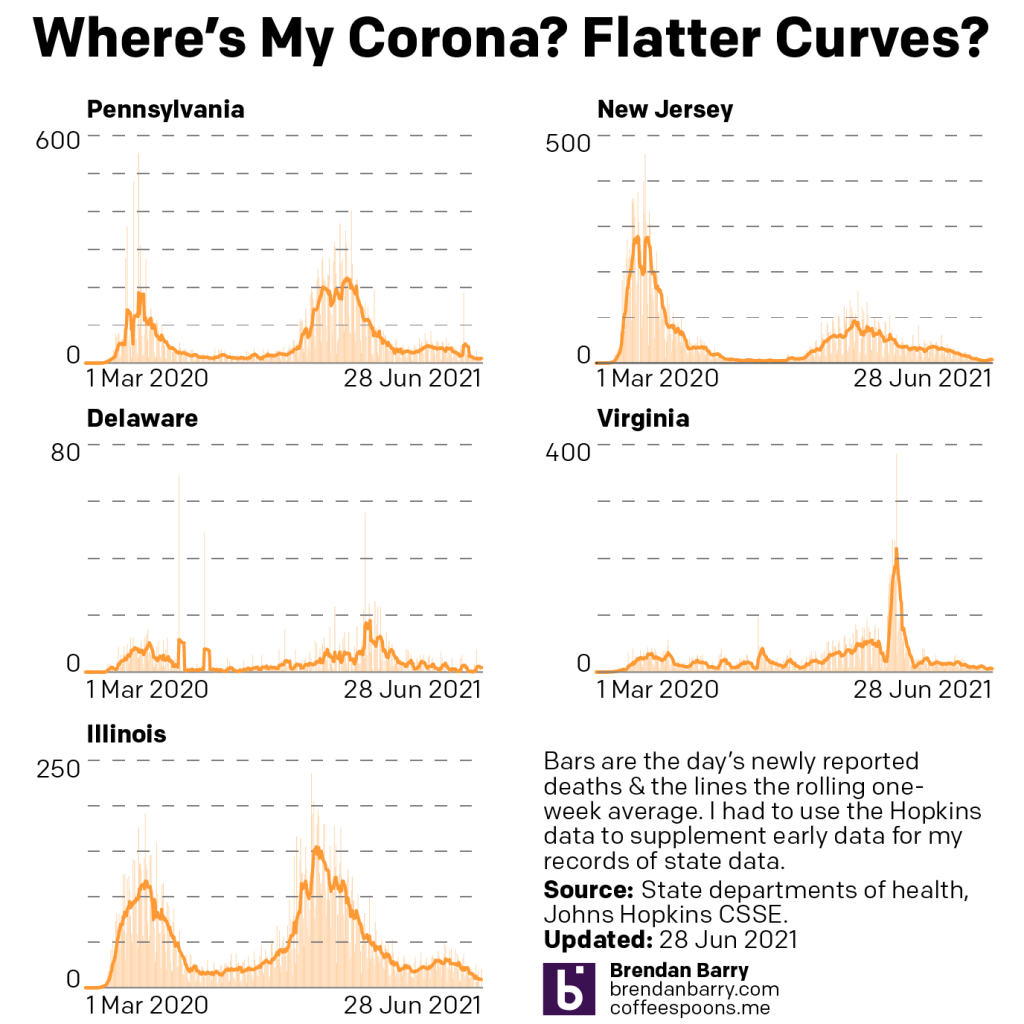
Last week we looked at new lows for the tri-state area whilst Virginia and Illinois saw slight increases. I even suggested that we could see death rates in Pennsylvania slip into the single digits.
Well instead we saw slight increases in the death rate in Pennsylvania, New Jersey, and Delaware. Again, nothing massive. But on 20 June we had an average of 11.6 deaths per day in Pennsylvania and yesterday the average sat at 12.4. Not huge, and within a rounding of being the same number, but still an increase. Delaware had been at 0.6 deaths per day, so an increase to 1.6 is an increase, but there’s very little room left to improve when your average falls below 1 per day.
In New Jersey we saw perhaps the most concerning rise, though again still slight by comparison to the entirety of the pandemic. The average last week sat at 5.6 deaths per day and we enter Tuesday at 7.6. That is still lower than the numbers three weeks ago, but it’s a rise nonetheless. Like with the new cases, we will want to watch this week to see how the numbers progress.
I don’t have any graphics or tables to present for vaccinations, but the numbers we do have show little to no progress in full vaccinations over the last week. Week-to-week, Pennsylvania, for example, saw an increase of 0.77 percentage points, or only 0.11 percentage points per day.
Now Pennsylvania’s fully vaccinated population rate sits at just a tick under 48%. Not bad. But Virginia is at 50.5%. And when last reported Illinois was 47.3%. We know that herd immunity, which we need to really starve out the virus, is probably above 75%—though likely higher with more transmissible variants of the virus—and we have currently failed to achieve that number.
That’s sad.
To bring my genealogical interest into this conversation, you only need to look to about 100 years ago when our ancestors did not, generally speaking, have access to vaccines. There was a reason people feared becoming ill, you were far more likely to die. But vaccinations eliminated the worst of the worst diseases and at the time people flocked to become vaccinated, recognising that they did not want to live in a world of mumps, measles, smallpox, or polio. If many of our ancestors were alive today, I believe they would be shocked at our society’s broad refusal to be vaccinated.
Leave a Reply
You must be logged in to post a comment.