In a first, the Gulf of Mexico basin has two active hurricanes simultaneously. Unfortunately, they are both likely to strikes somewhere along the Louisiana coastline within approximately 36 hours of each other. Fortunately, neither is strong as a storm named Katrina that caused a mess of things several years ago now.
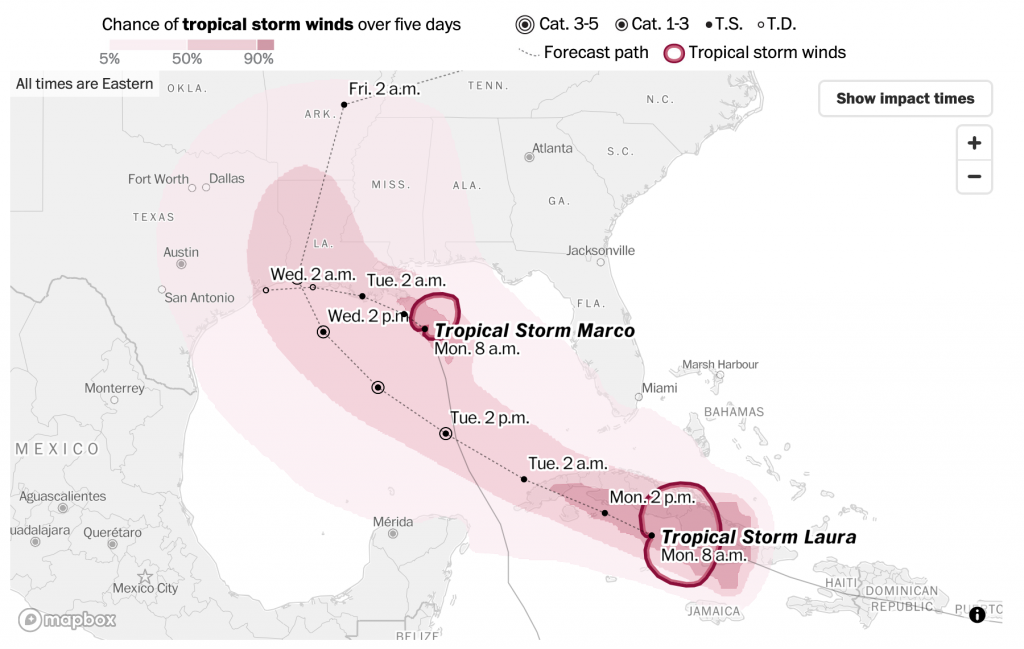
Over the last few weeks I have been trying to start the week with my Covid datagraphics, but I figured we could skip those today and instead run with this piece from the Washington Post. It tracks the forecast path and forecast impact of tropical storm force winds for both storms.

The forecast path above is straight forward. The dotted line represents the forecast path. The coloured area represents the probability of that area receiving tropical storm force winds. Unsurprisingly the present locations of both storms have the greatest possibilities.
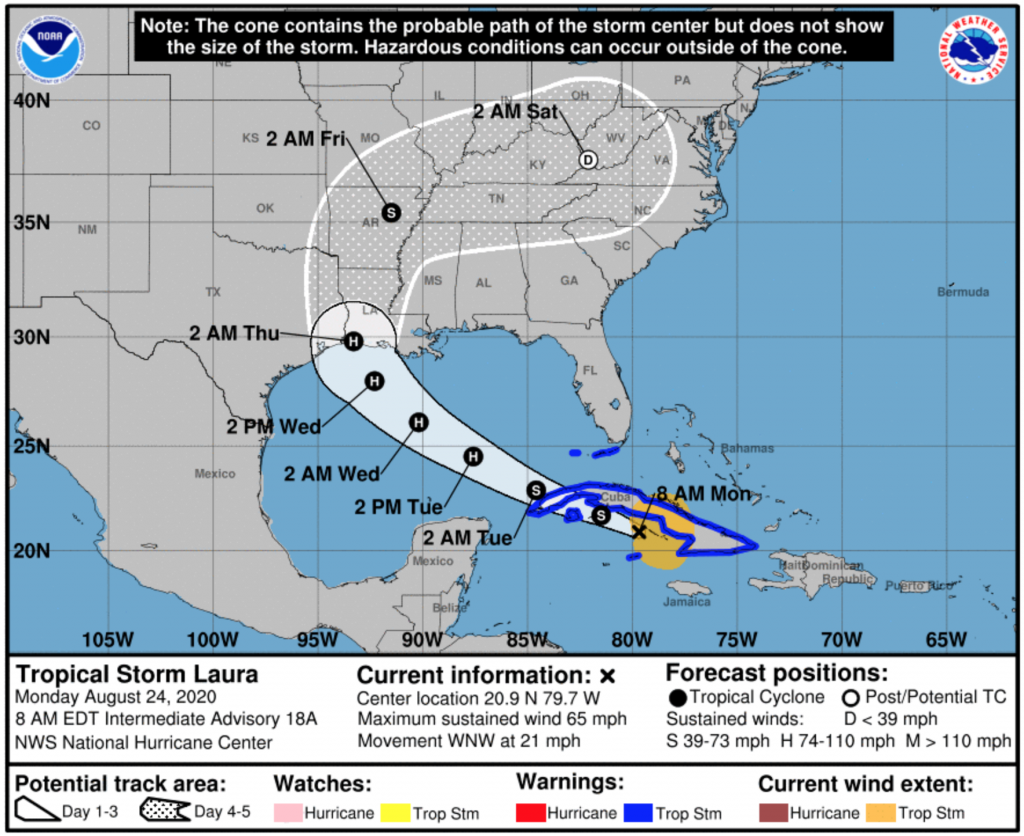
Now compare that to the standard National Weather Service graphic, below. They produce one per storm and I cannot find one of the combined threat. So I chose Laura, the one likely to strike mid-week and not the one likely to strike later today.

The first and most notable difference here is the use of colour. The ocean here is represented in blue compared to the colourless water of the Post version. The colour draws attention to the bodies of water, when the attention should be more focused on the forecast path of the storm. But, since there needs to be a clear delineation between land and water, the Post uses a light grey to ground the user in the map (pun intended).
The biggest difference is what the coloured forecast areas mean. In the Post’s versions, it is the probability of tropical force winds. But, in the National Weather Service version, the white area actually is the “cone”, or the envelope or range of potential forecast paths. The Post shows one forecast path, but the NWS shows the full range and so for Laura that means really anywhere from central Louisiana to eastern Texas. A storm that impacts eastern Texas, for example, could have tropical storm force winds far from the centre and into the Galveston area.
Of course every year the discussion is about how people misinterpret the NWS version as the cone of impact, when that is so clearly not the case. But then we see the Post version and it might reinforce that misconception. Though, it’s also not the Post’s responsibility to make the NWS graphic clearer. The Post clearly prioritised displaying a single forecast track instead of a range along with the areas of probabilities for tropical storm force winds.
I would personally prefer a hybrid sort of approach.
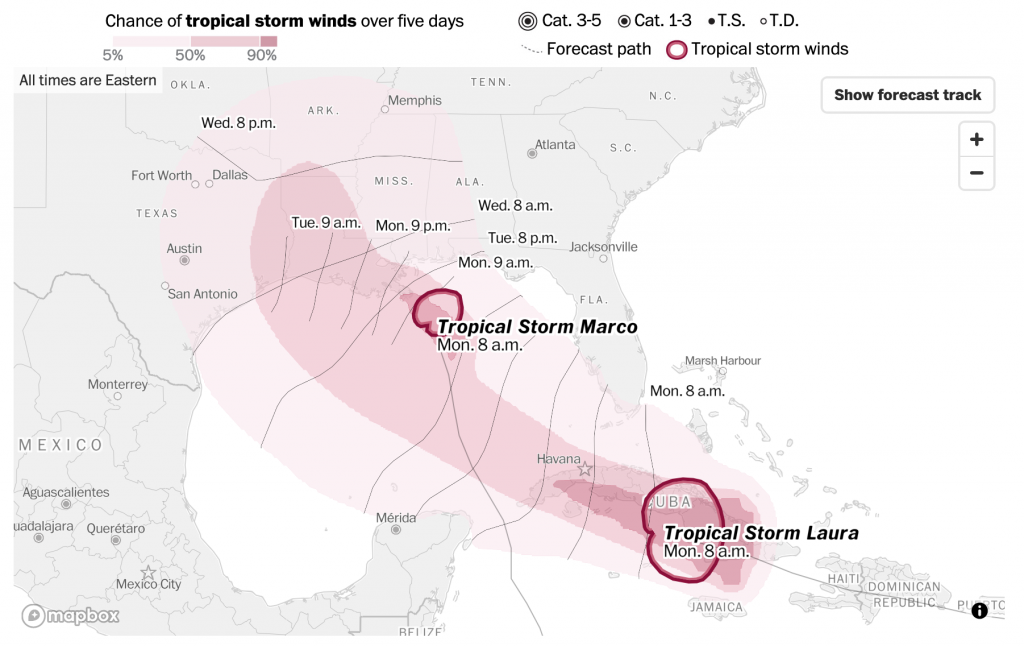
But I also wanted to touch briefly on a separate graphic in the Post version, the forecast arrival times.

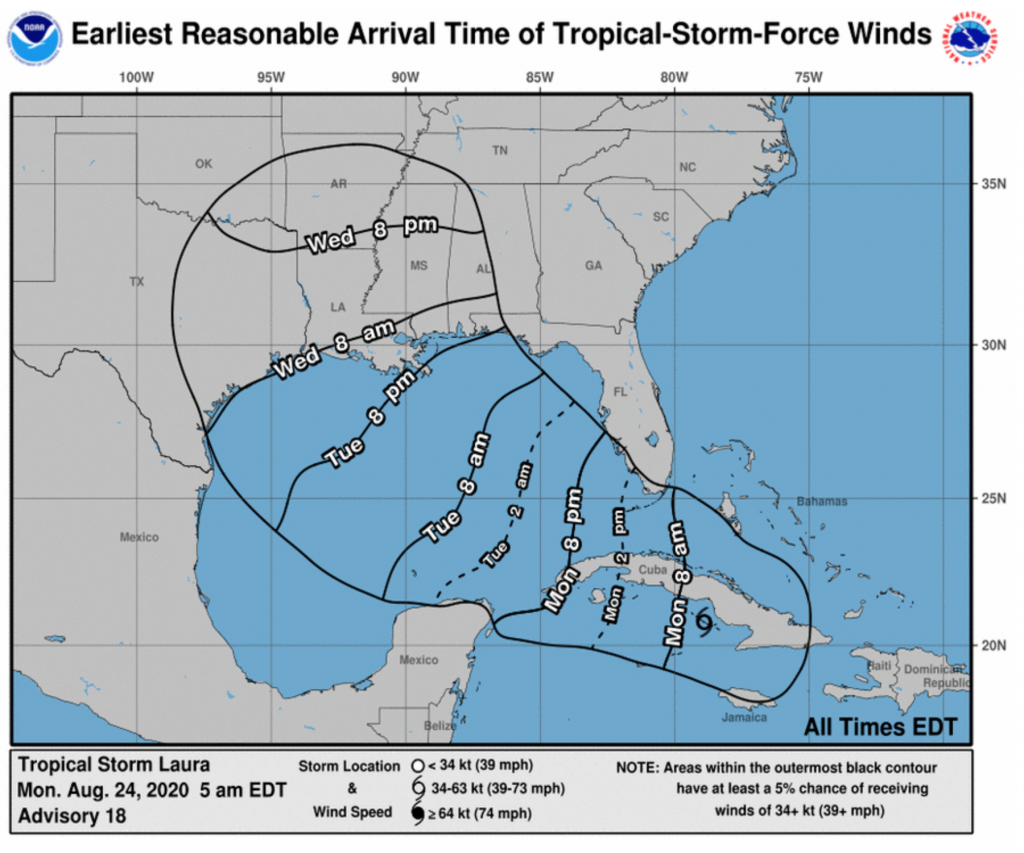
This projects when tropical storm force winds will begin to impact particular areas. Notably, the areas of probability of tropical storm force winds does not change. Instead the dotted line projections for the paths of the storms are replaced by lines relatively perpendicular to those paths. These lines show when the tropical storm winds are forecast to begin. It’s also another updated design of the National Weather Service offering below.

Again, we only see one storm per graphic here and this is only for Laura, not Marco. But this also probably most analogous to what we see in the Post version. Here, the black outline represents the light pink area on the Post map, the area with at least a 5% forecast to receive tropical storm force winds. The NWS version, however, does not provide any further forecast probabilities.
The Post’s version is also design improved, as the blue, while not as dark the heavy black lines, still draws unnecessary attention to itself. Would even a very pale blue be an improvement? Almost certainly.
In one sense, I prefer the Post’s version. It’s more direct, and the information presented is more clearly presented. But, I find it severely lack in one key detail: the forecast cone. Even yesterday, the forecast cone had Laura moving in a range both north and south of the island of Cuba from its position west of Puerto Rico. 24 hours later, we now know it’s on the southern track and that has massive impact on future forecast tracks.
Being east of west of landfall can mean dramatically different impacts in terms of winds, storm surge, and rainfall. And the Post’s version, while clear about one forecast track, obscures the very real possibilities the range of impacts can shift dramatically in just the course of one day.
I think the Post does a better job of the tropical storm force wind forecast probabilities. In an ideal world, they would take that approach to the forecast paths. Maybe not showing the full spaghetti-like approach of all the storm models, but a percentage likelihood of the storm taking one particular track over another.
Credit for the Post pieces goes to the Washington Post graphics department.
Credit for the National Weather Service graphics goes to the National Weather Service.
