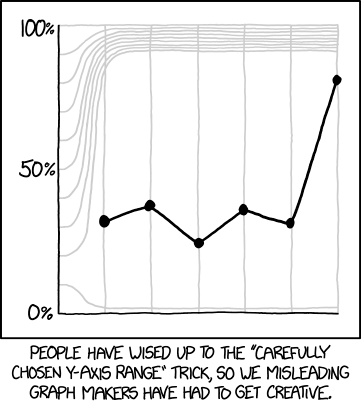
Huzzah. It’s another Friday and we made it. So today, courtesy of xkcd, we can look at some insider tricks for charting best practices.
Credit for the piece goes to Randall Munroe.
Huzzah. It’s another Friday and we made it. So today, courtesy of xkcd, we can look at some insider tricks for charting best practices.

Credit for the piece goes to Randall Munroe.
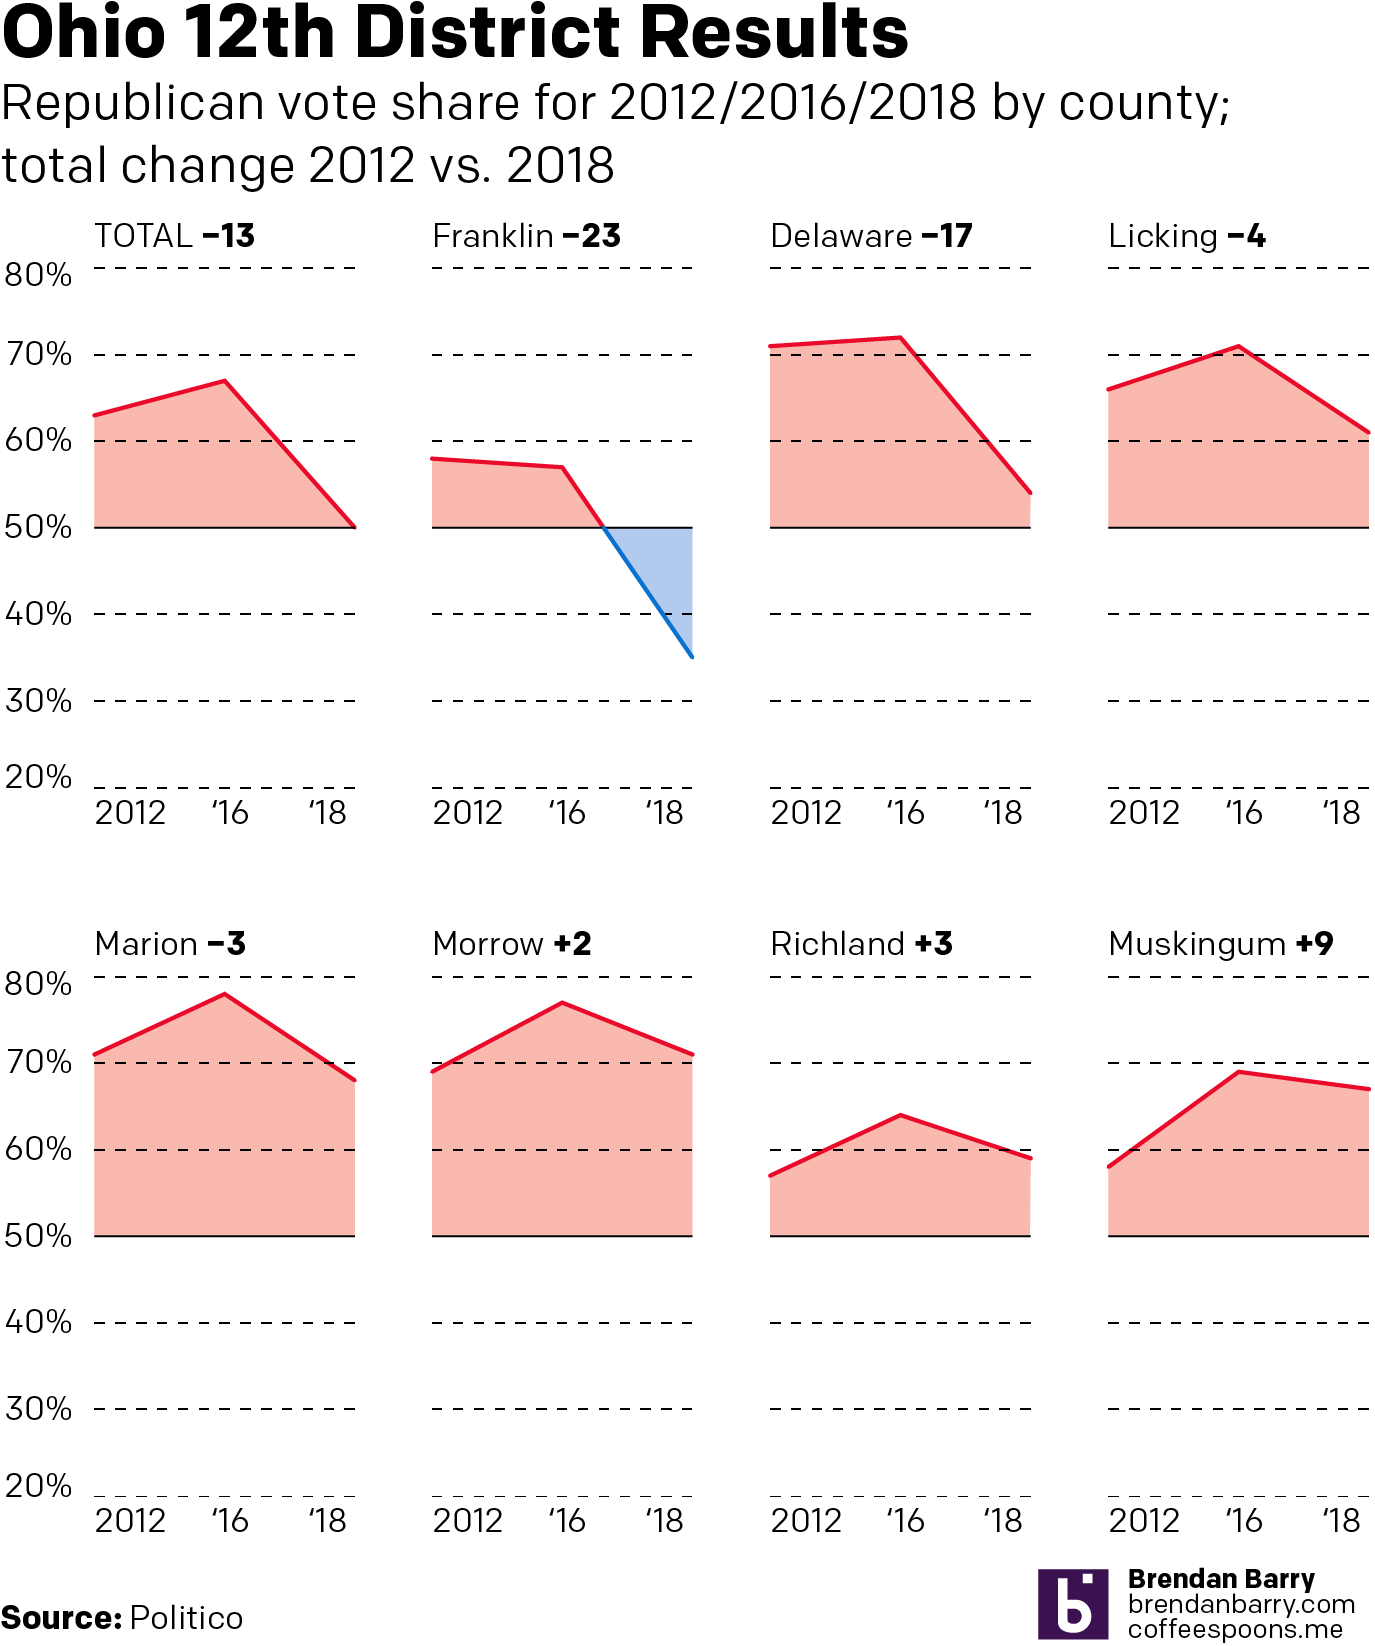
Last week parts of Ohio voted for a special election in the 12th Congressional District. Historically it has been a solidly Republican district by margins in the double digits. However, last week Republicans barely managed to hold the seat by, at the latest count I saw, less than one percentage point. Why? Well, it turns out that Republican support is bleeding away from one of the traditional strongholds: suburban counties.
I saw this data set late last week on Politico and I knew instinctively that it needed to be presented in another form than a table. Consequently I sketched out how it could work as small multiples of area charts to highlight just how Republican the district is. This is the digitisation of that take. Unfortunately my original sketch also featured a map of the district to show how this falls to the north and east of the city of Columbus. But I did not have time for that. Instead, I sketched up something else, but I need time to work on that. So for now, this concept will have to suffice.
Credit for the piece is mine.
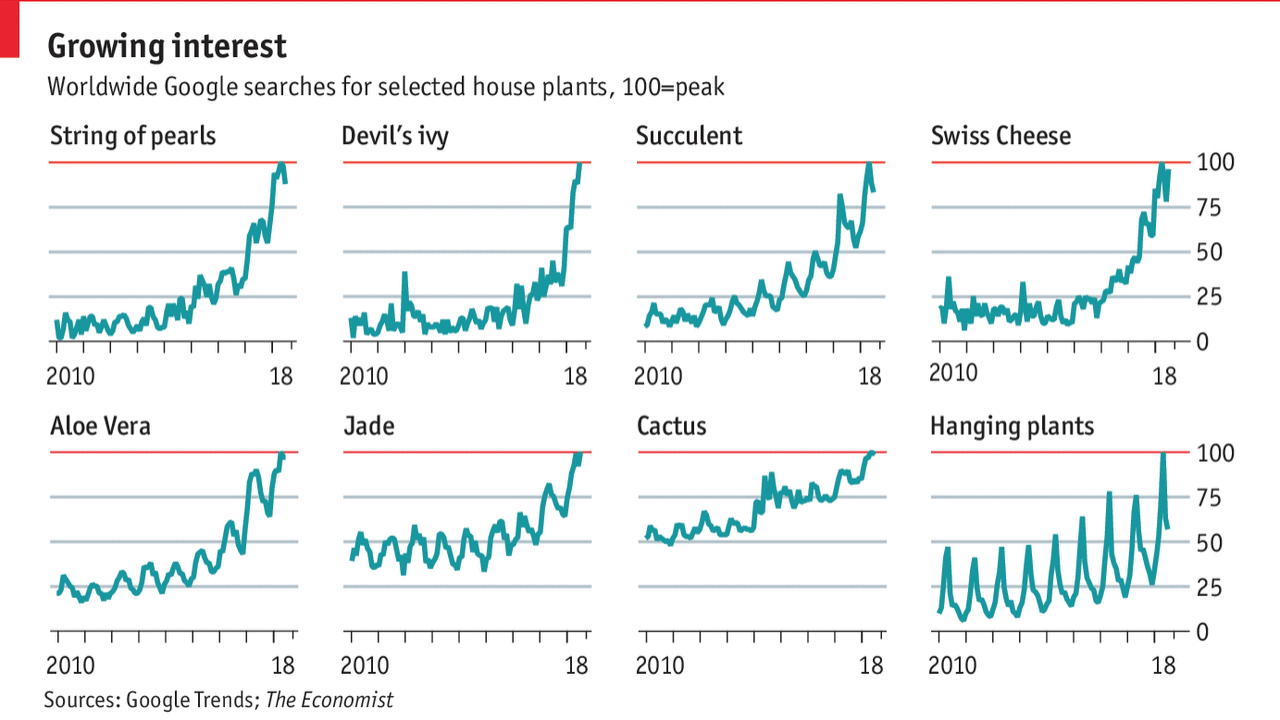
I am a millennial. That broadly means I am destroying and/or ruining everything. It also means I am obsessed with things like avocado toast. It also means I am not buying a house. Thankfully the Economist is on top of my next fad: indoor houseplants.
Your author will admit to having a few: a hanging plant, an Easter lily, an aloe plant and its children, and a dwarf conifer. Just don’t ask me how they’re doing. (Hint: not well.) Turns out I am not a plant person.
In terms of the graphic, though, what we have is a straight up set of small multiples of line charts. The seasonality mentioned in the article text appears quite clearly in a number of plants.
But is Swiss Cheese really a plant?
Credit for the piece goes to the Economist Data Team.
Last week the Economist published an article sort of about my industry. Now I am a designer and more familiar with the front-end design and some HTML and CSS, but a lot of the things I have designed over the last few years have needed some serious developers with some serious skills. And those guys were the ones who would truly understand this graphic, which looks at the popularity of Python relative to other languages like C++, Java, Javascript, .NET, &c.
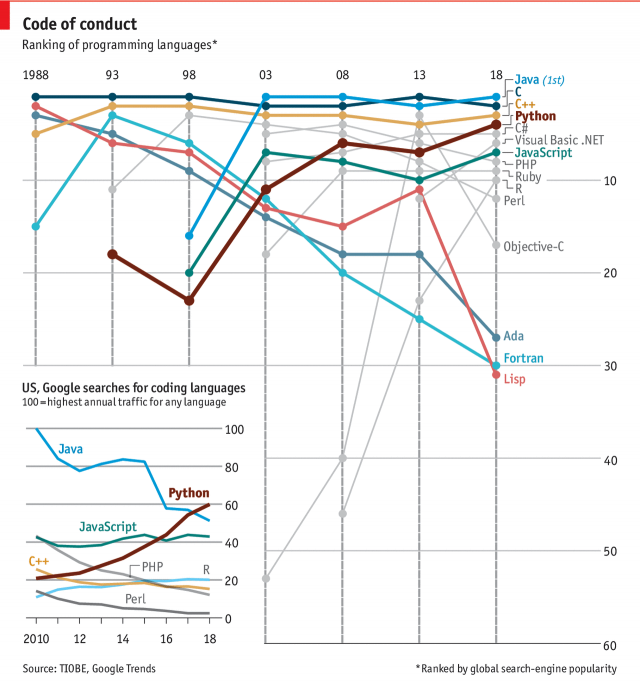
I really like what the designers did here. First and foremost the key chart is a ranking chart showing the popularity of languages since 1988—Java and C have consistently been at the top. But other languages no longer relevant are not even shown. (Where are you, Actionscript?) Those that are both relevant and also mentioned are colour coded within the set.
But the truly nice thing is being able to use the empty space of the lower-left area of the chart to add some context. It shows the growth in Google searches since 2010 in searches for Python.
Bonus note, look at that rise in R since 2008.
Credit for the piece goes to the Economist Data Team.
Last Thursday, Facebook’s share price plunged on the news of some not so great numbers from the company on its quarterly earnings report. The data and number itself is not terribly surprising—it is a line chart. But what I loved is how the New York Times handled this on the front of the Business section on Friday morning.
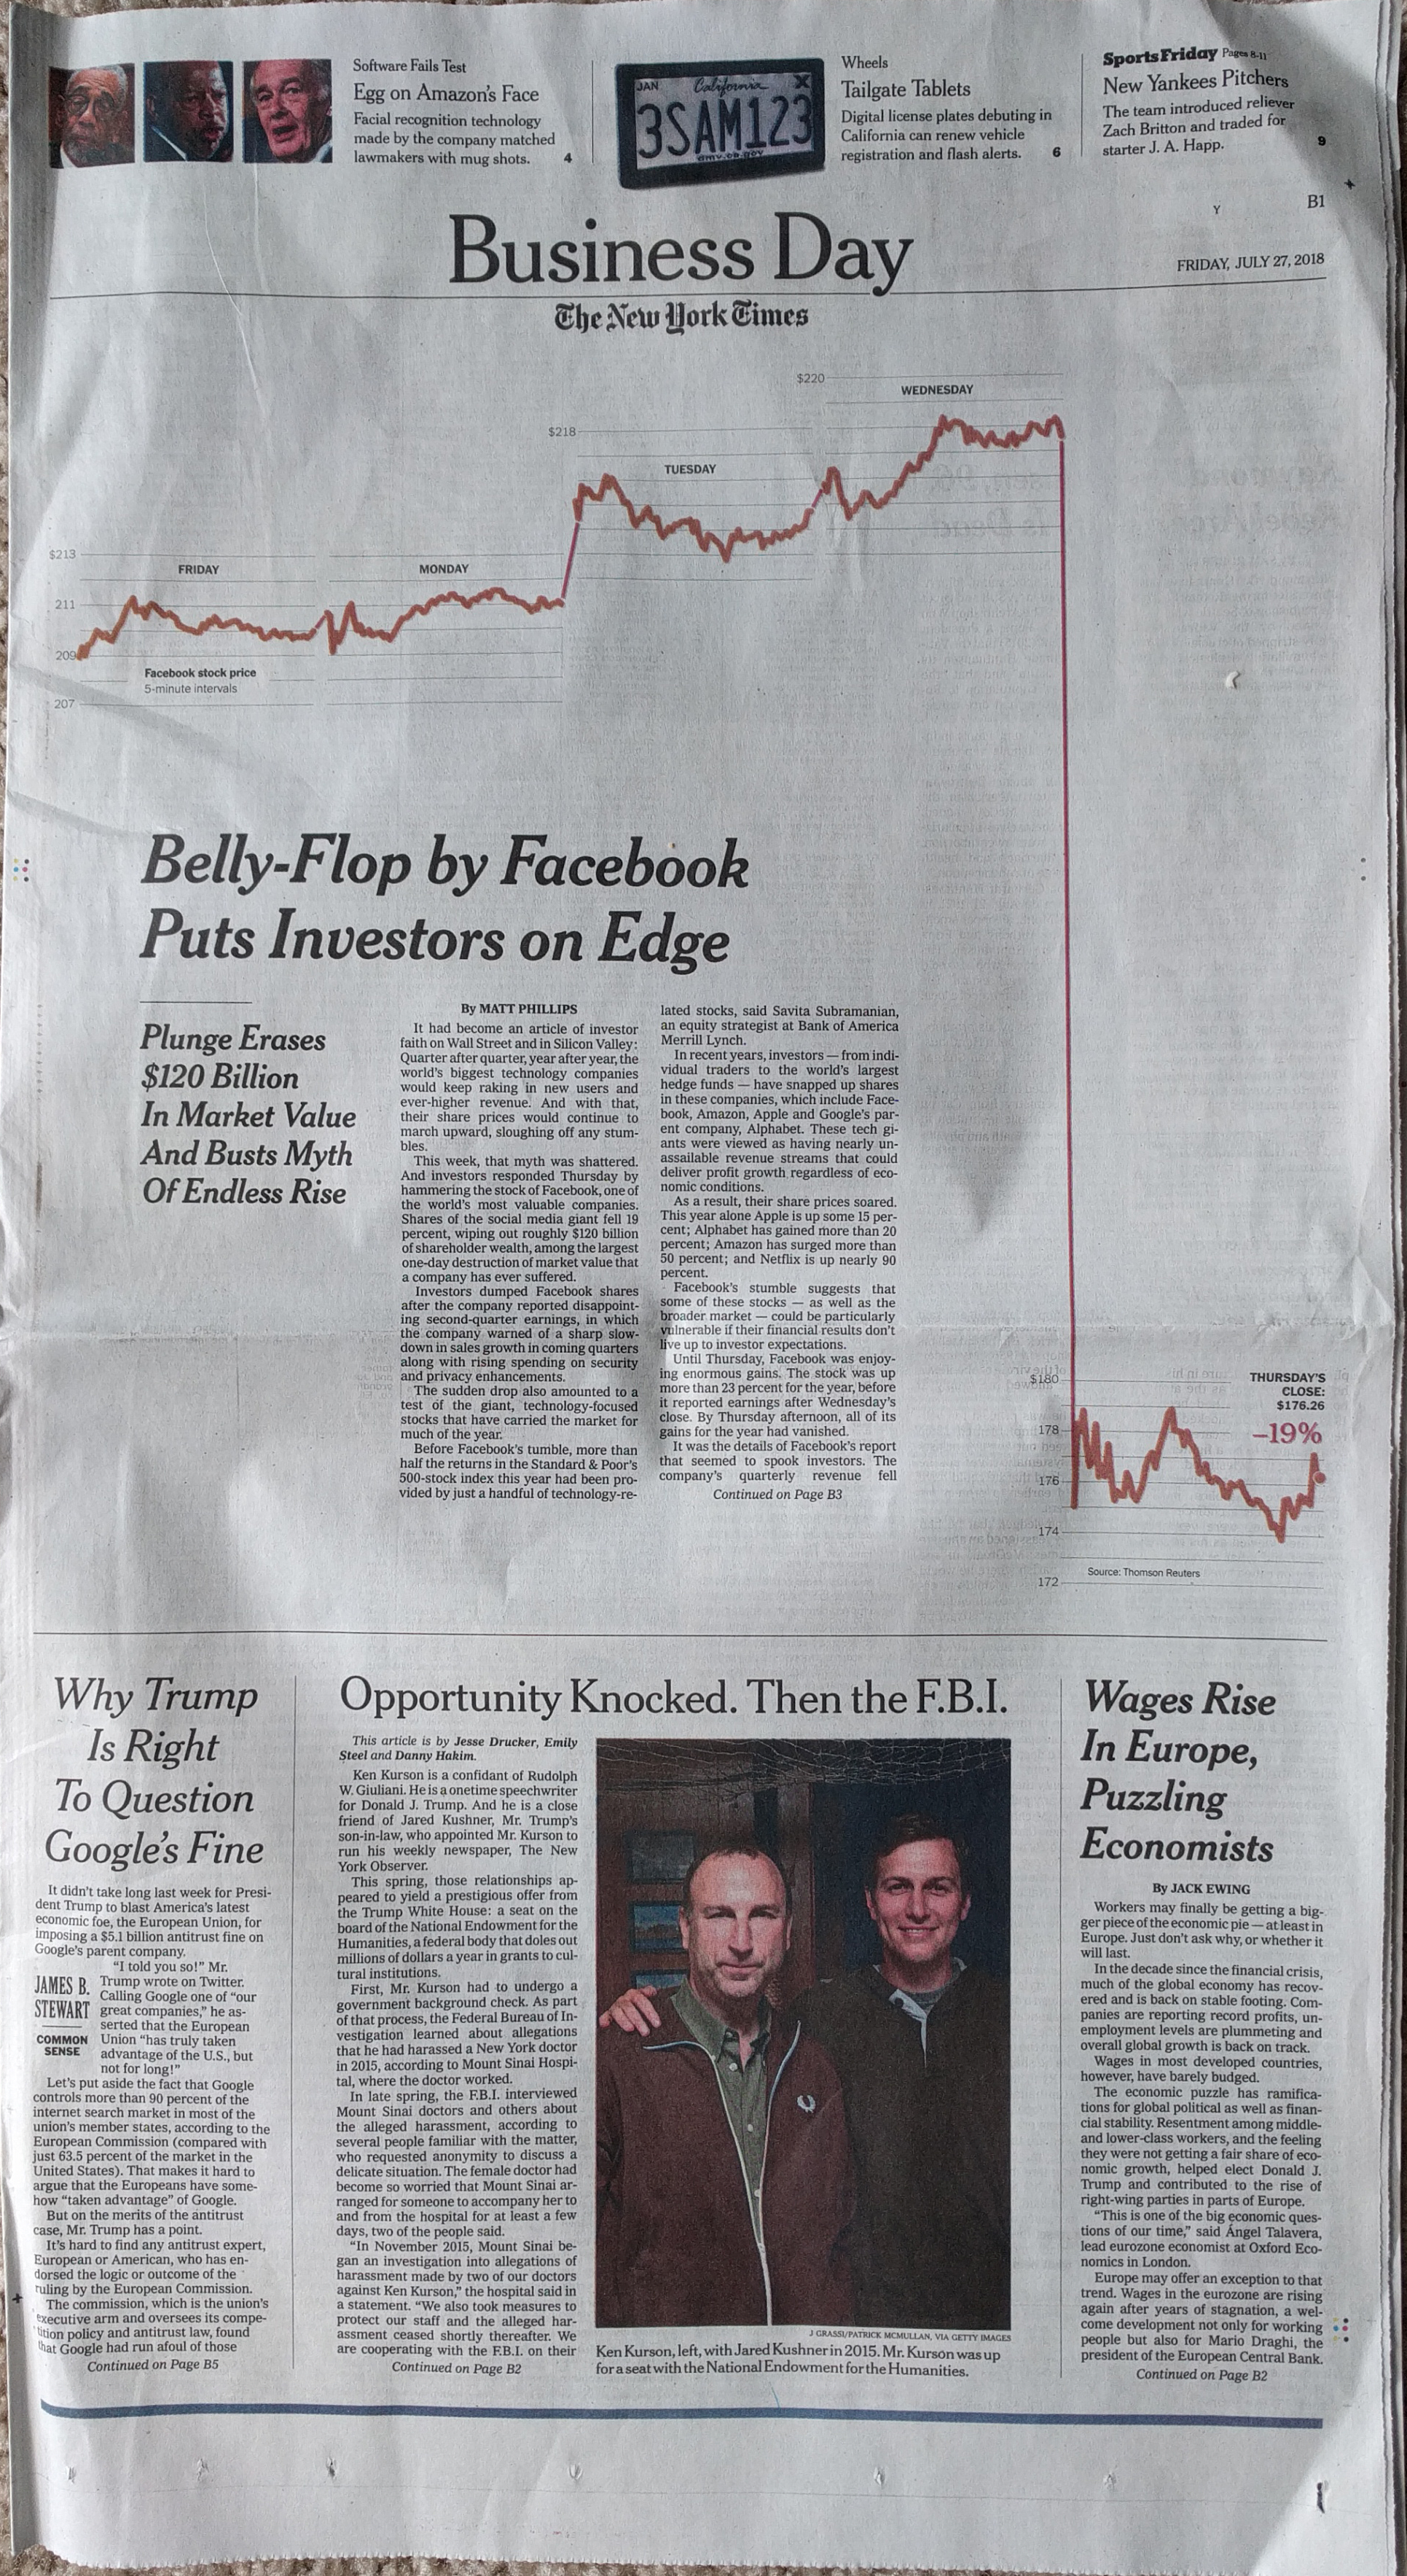
I found the layout of the page and that article striking. In particular, each day of the share price is almost self-contained in that the axis lines start and stop for each day. I question the thickness of the stroke as something a little thinner might have been a bit clearer on the data. However, it might also have not been strong enough to carry the attention at the top of the page. As it is, that attention is needed to draw the reader down the page and then down across the fold.
Additionally, the designers were sensitive to the need to draw that attention down the page. In order to do that they kept the white space around the graphic and kept the text to two small blocks before moving on to the interior of the section.
Credit for the story goes to Matthew Philips. Although I’m pretty sure the page layout goes to somebody else.
The weather in Philly the past week has been just gross. It reminds of Florida in that it has been hot, steamy, storms and downpours pop up out of nowhere then disappear, and just, generally, gross. I do not understand how people live in Florida year round. Anyway, that got me thinking about this piece from a month ago in the New York Times. It looked at the impact of climate change and living conditions in South Asia. Why is South Asia important? Well, it is home to nearly a billion people, a large number of whom are poor and demanding resources, and oh yeah, has a few countries that have fought several wars against each other and are armed with nuclear weapons. South Asia is important.
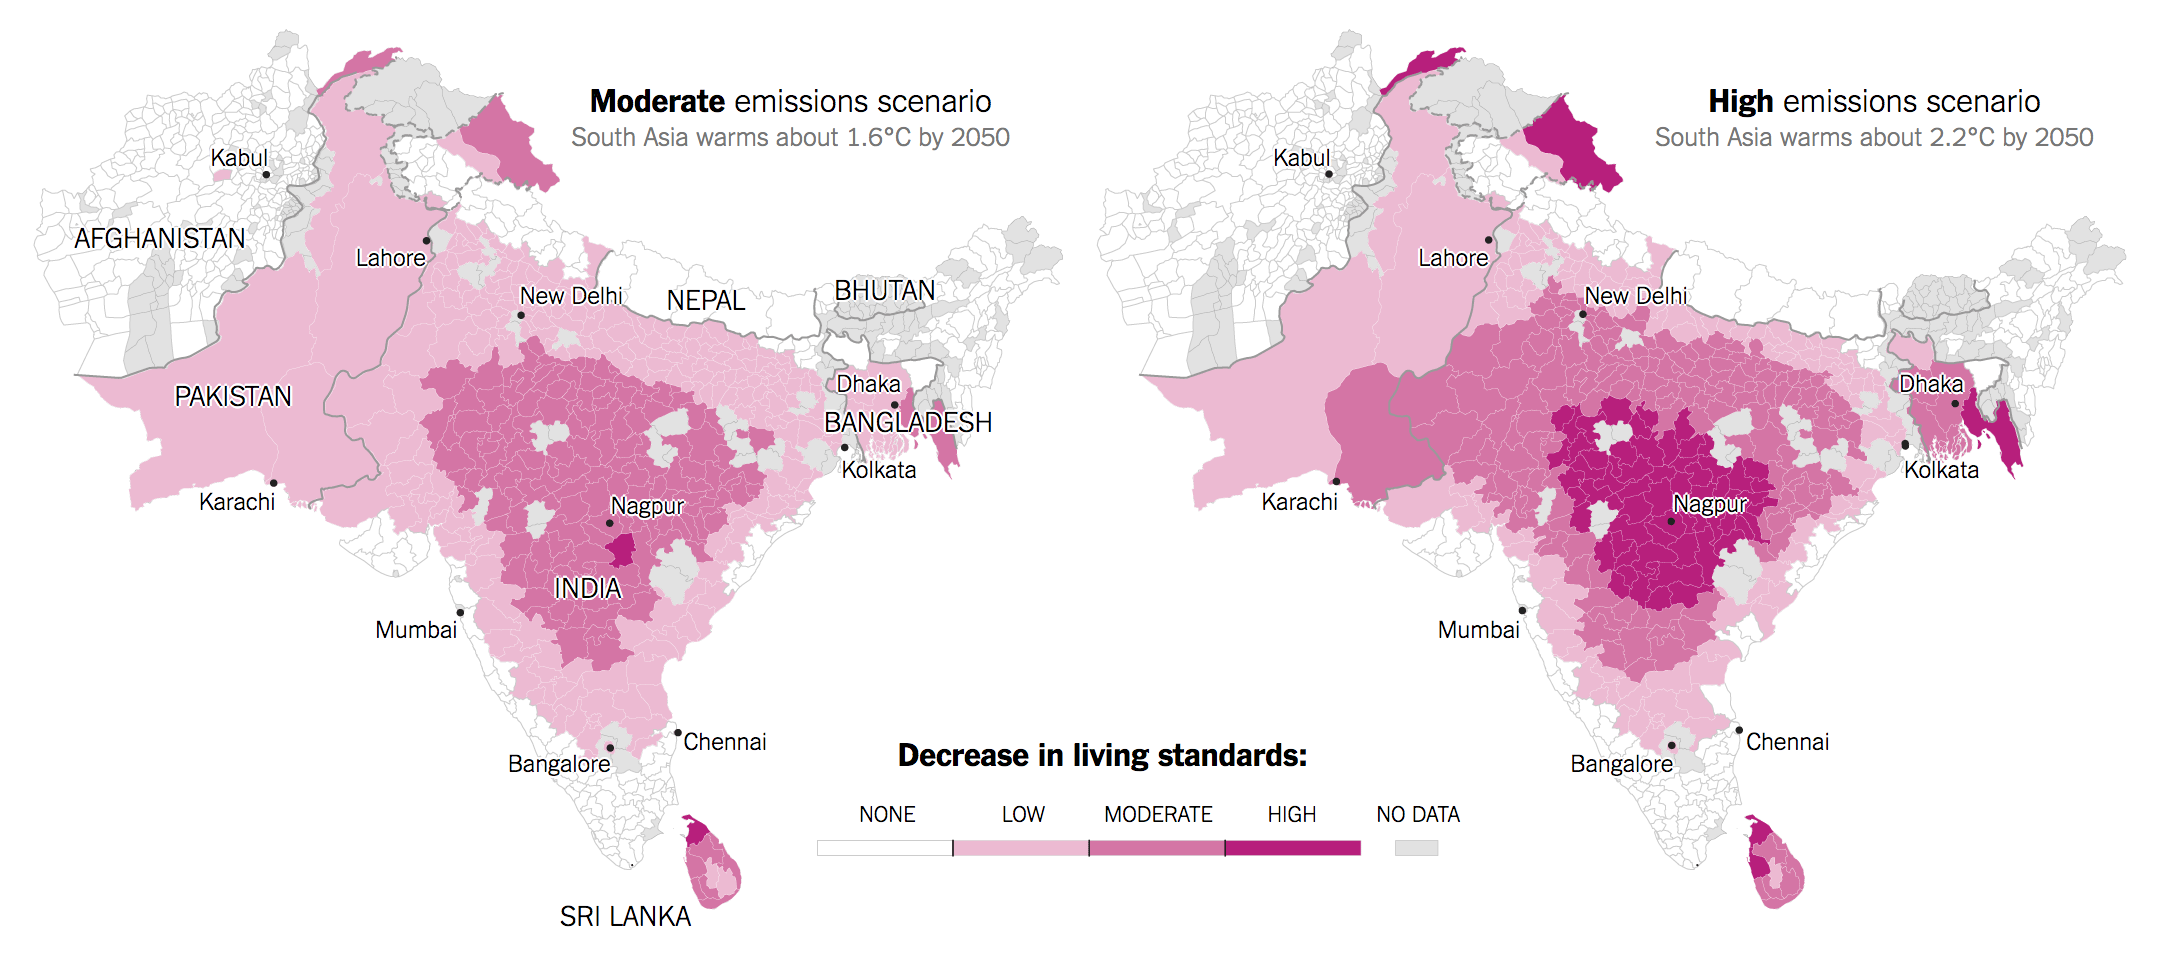
The map from the piece—it also features a nice set of small multiples of rising temperatures in six countries—shows starkly how moderate emissions and the high projection of emissions will impact the region. Spoiler: not well. It notes how cities like Karachi, for example, will be impacted as hotter temperatures mean lower labour productivity means worse public health means lower standard of living. And it doesn’t take a rocket scientist to see how things like demand for water in desert or arid areas could spark a conflict between Pakistan and India. Although, to be very clear, the article does not go there.
As to the design of the graphic, I wonder about the use of white for no impact and grey for no data. Should they have been reversed? As it is, the use of white for no impact makes the regions of impact, most notably central India, stand out all the more clearly. But it then also highlights the regions of no data.
Credit for the piece goes to Somini Sengupta and Nadja Popovich.
Everybody loves maps. Unfortunately this is not a map to love. The Economist looked at the global status of the free press and its decline around the world.
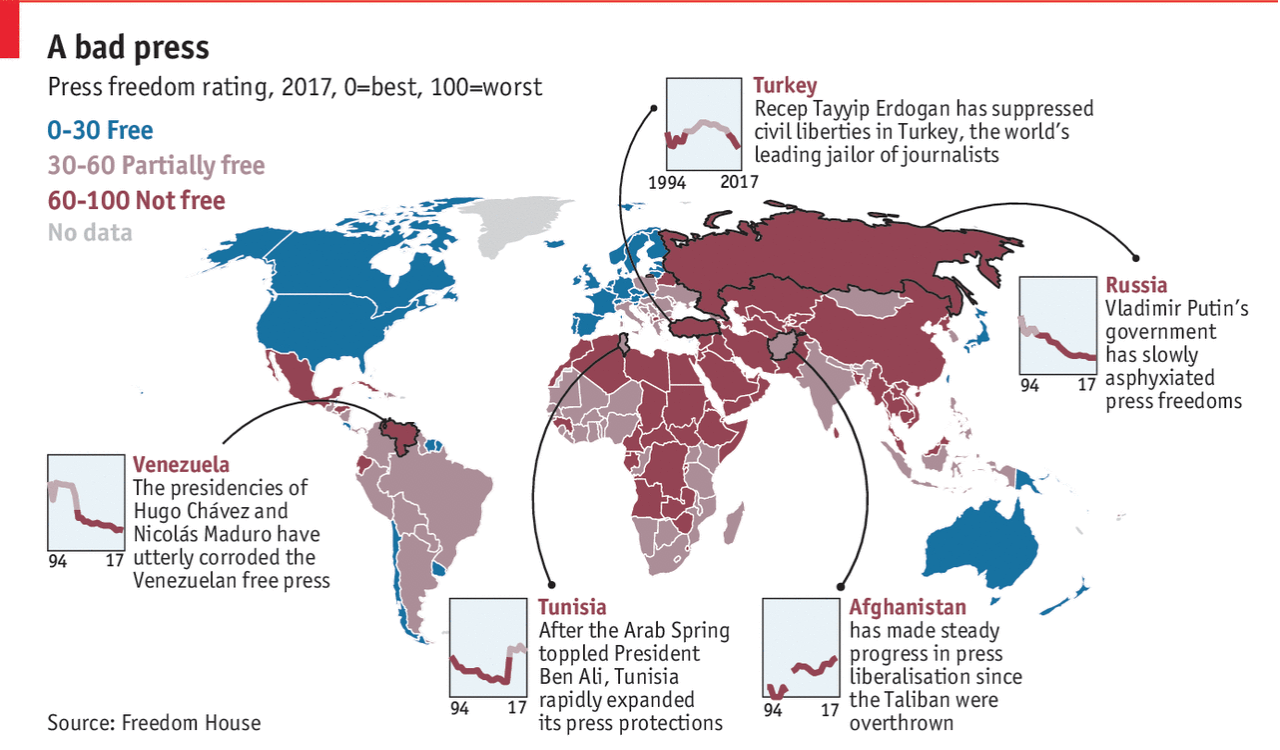
The graphic is a neat little package of a map to anchor the narrative and a few callout countries with their general declines—or in Tunisia’s case the reversal thereof—highlighted. But I do have a few issues with the piece.
Do the lines need to be curved? Some certainly make sense, e.g. how do you get from the Turkey box to the outline of Turkey? But then for Afghanistan, a straight line through Balochistan, Pakistan would mean the line would not have to cover Pakistan, India, curve around Sri Lanka, and then finally reach the box.
In the little boxes, I also wonder if the lines need to be as thick as they are. Could a lighter stroke weight improve the legibility of the charts?
And to be super picky, I wonder if the stroke outlines of the countries are complete. My trained eye fails to register an outline of both the European part of Turkey and of the Russian oblast of Kaliningrad.
Credit for the piece goes to the Economist’s Data Team.
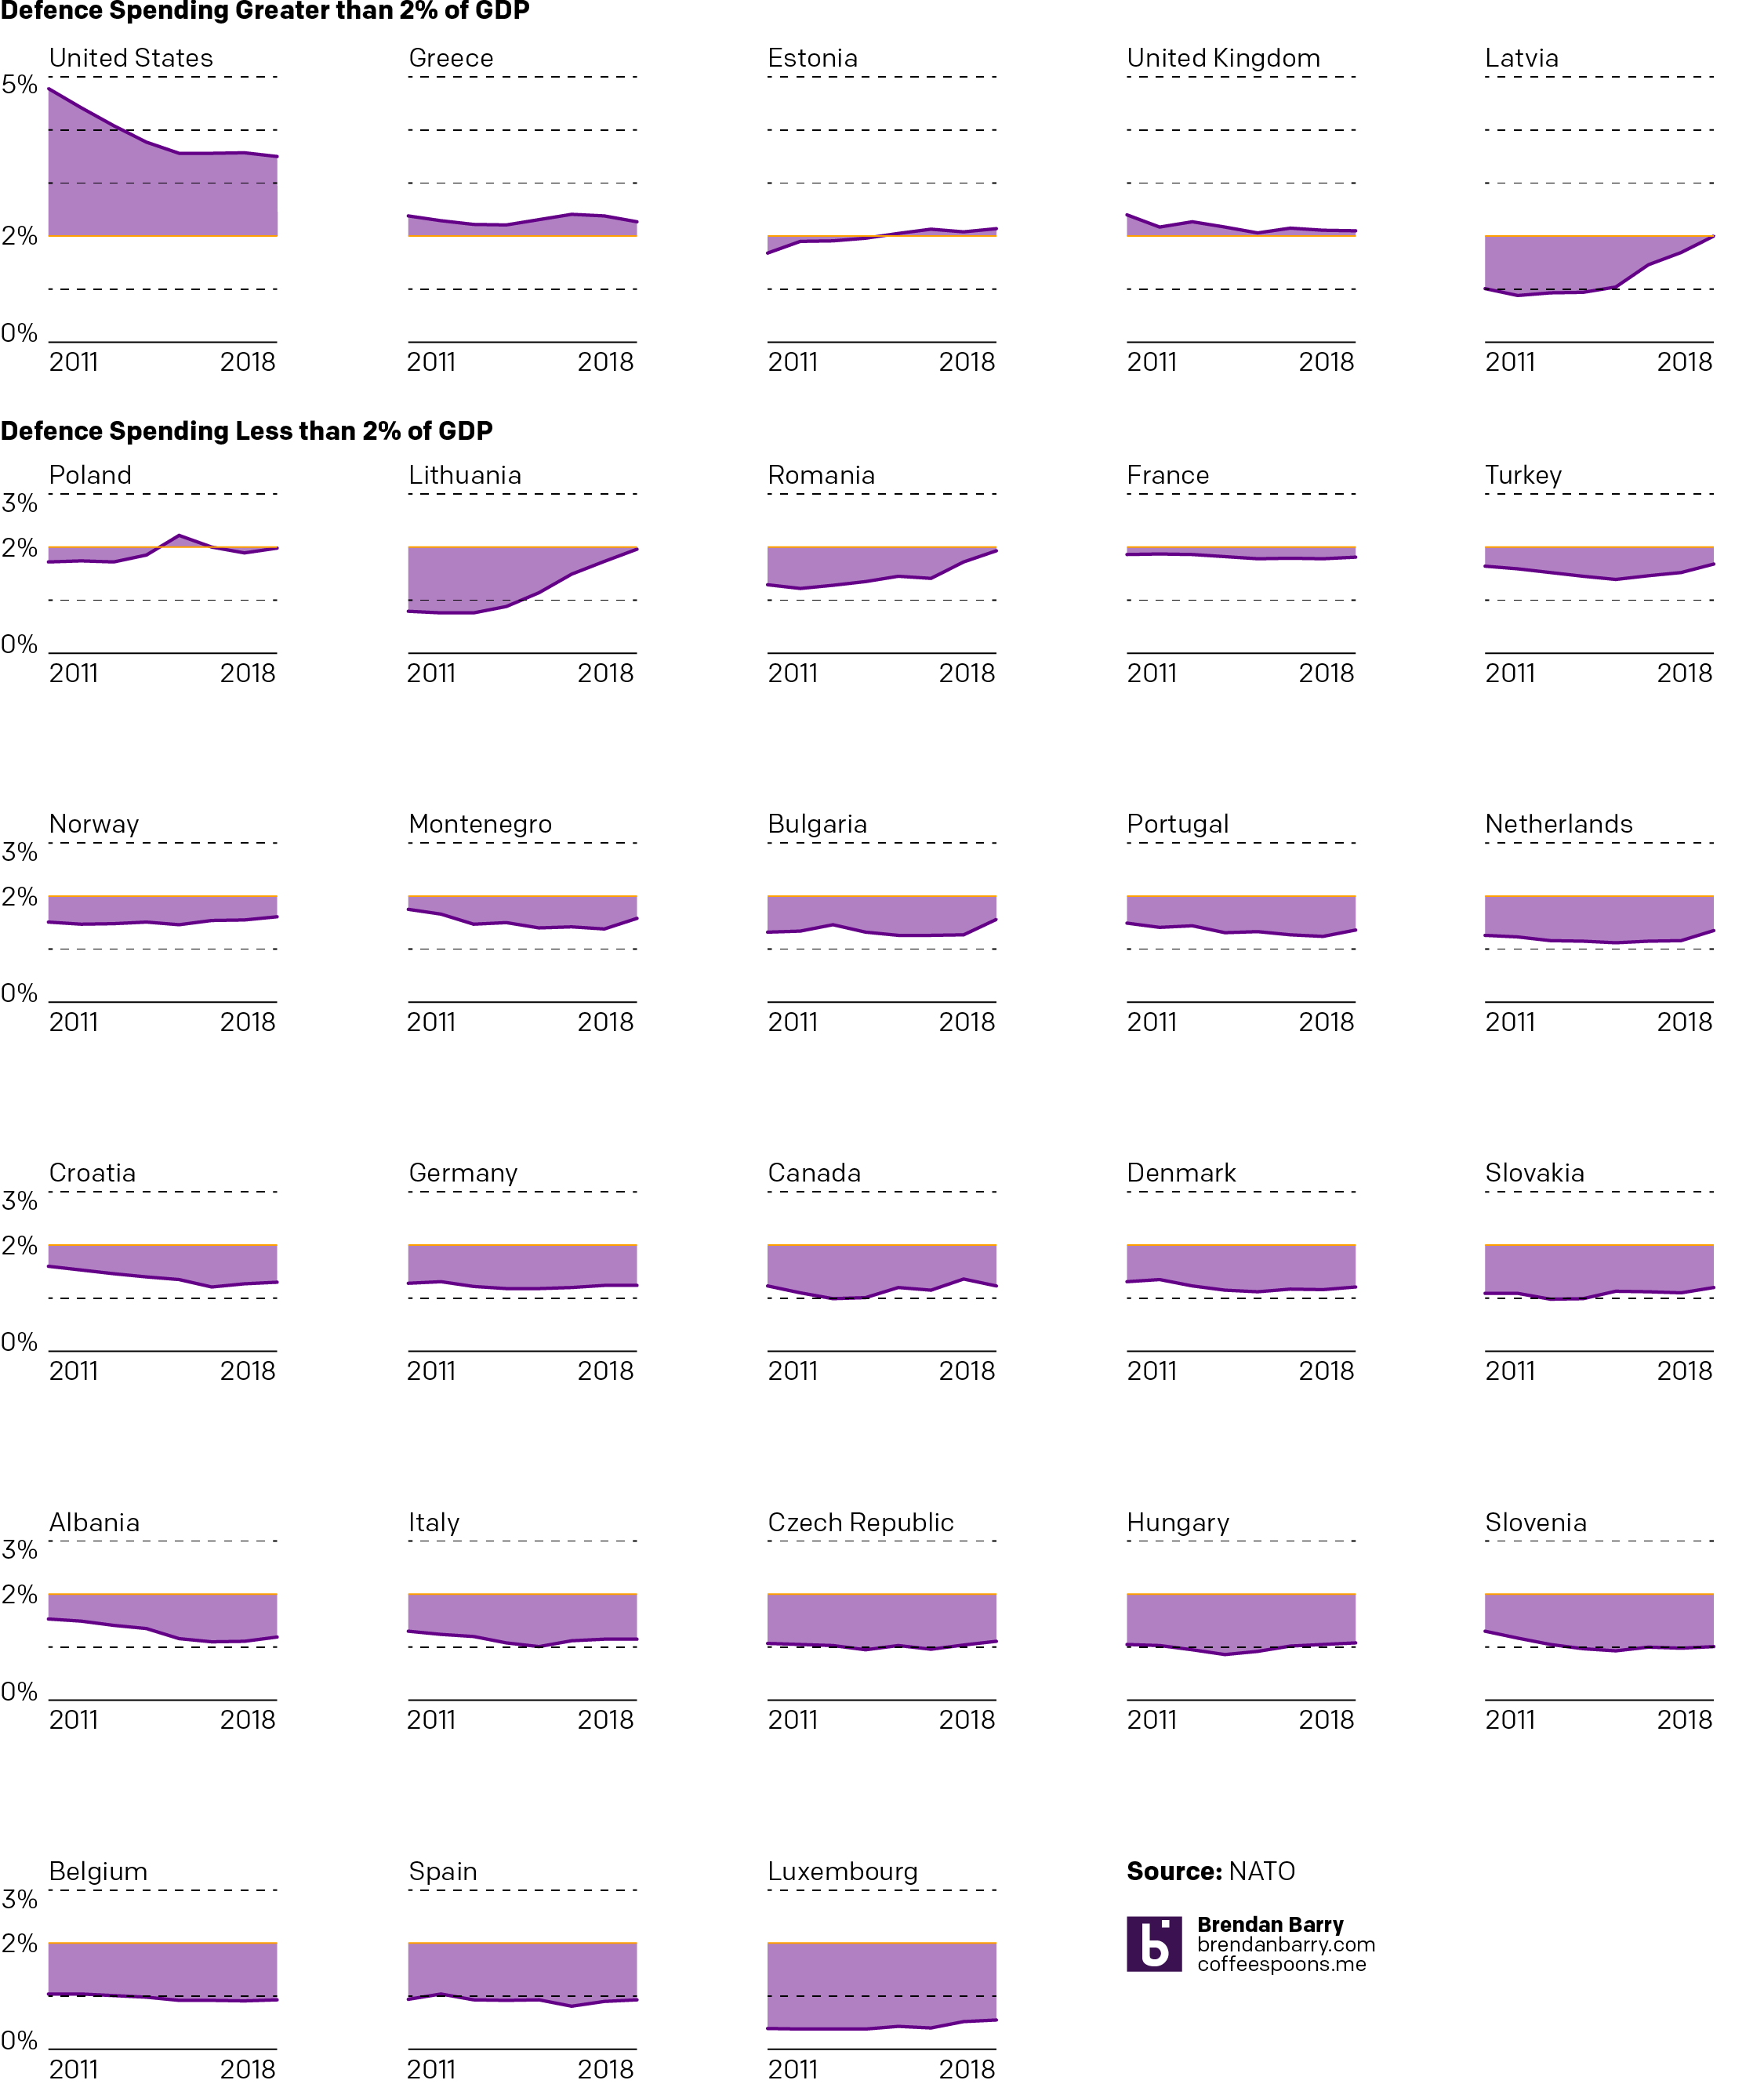
Late last week we heard a lot about contributions to NATO. Except, that was not true. Because the idea of spending 2% of GDP on NATO is actually about a NATO member spending 2% of its GDP on its military. And within that 2%, at least 20% must be spent on hardware or R&D. There is a separate operating budget to which countries actually contribute funds. But before we look at all of this as a whole, I wanted to explore the burden sharing, which is what NATO terms the 2% of GDP defence expenditures.
I did something similar a couple of years ago back in 2014 during the height of the Russia–Ukraine crisis. However, here I looked at a narrower data set from 2011 to 2018 and then across all the NATO members. In 2014, NATO met in Wales and agreed that over the next ten years all members would increase their defence spending to 2% of GDP. We are only four years into that ten year plan and so most of these countries still have time to reach that level.
Credit for the piece is mine.
The World Cup has had some impressive matches and some stunners. (And the two are not mutually exclusive.) But if you are like me and have to work during most of the broadcasts, how can you follow along? Well thankfully FiveThirtyEight put together a nice statistical model that provides the probability of a team winning—or drawing—in real time.
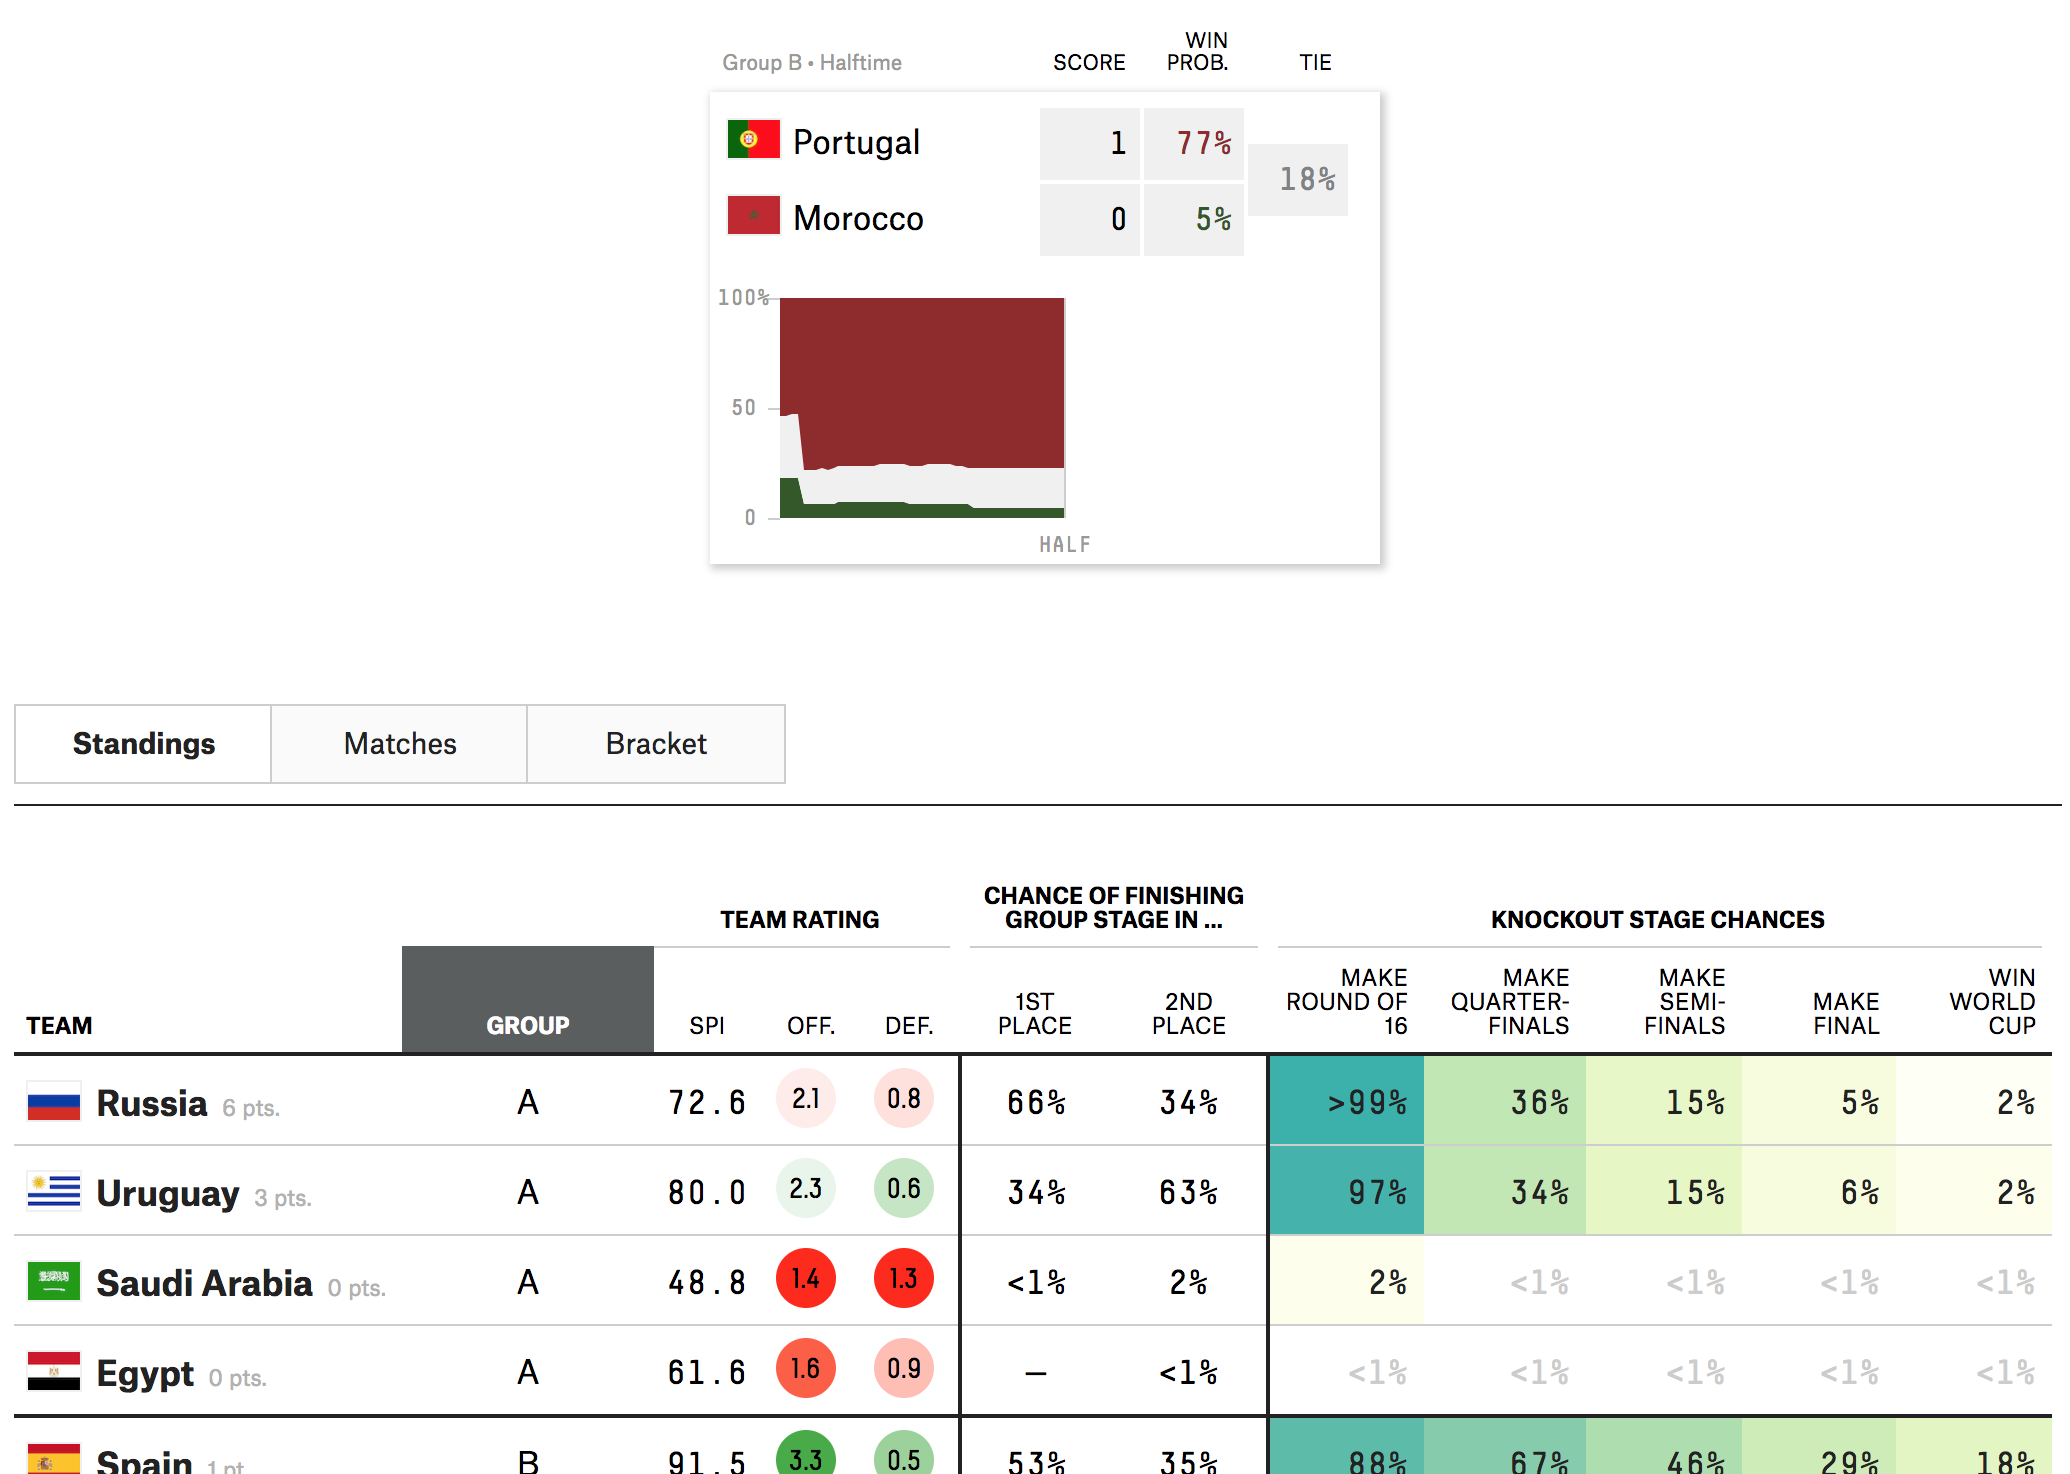
The design is fairly simple: a small table with the score and probability followed by a chart drawn as the match goes on. (Clearly I took this image at the half.)
I included a snippet of the table below to show the other work the FiveThirtyEight team put out there. You can explore the standings, the screenshot above, as well as the matches and then the brackets later in the competition.
The table makes nice use of the heat map approach to show is likely to make easy of the different stages of the competition. Like I said the other day, they are high on Brazil, because Brazil. But a little lower on Germany. But never count Germany out.
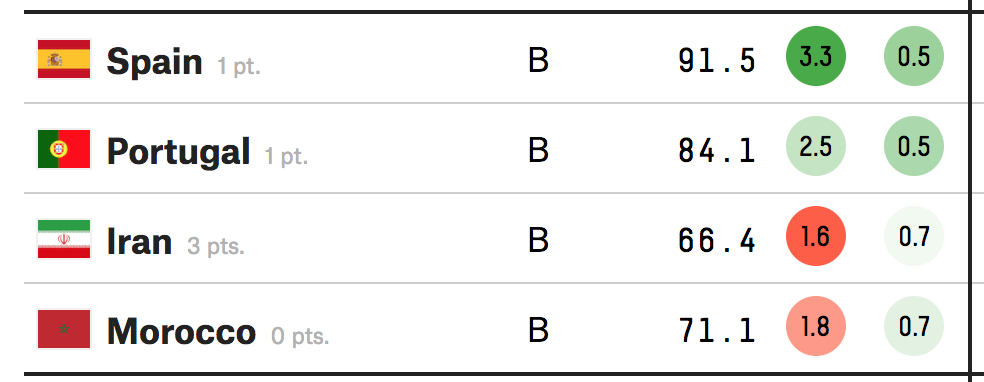
The only unclear thing to me in the table? The sorting mechanism. In Group B, at least whilst the Portugal match is ongoing, should probably have Iran at the top. After all, as of writing, it is the only team in the group to have won a match. The only thing I can guess is that it has to do with an overall likelihood to advance to the next round. I highly doubt that Iran will defeat either Spain or Portugal. But as with many knockout-style championships, anything can happen in a single match sample size.
Credit for the piece goes to Jay Boice, Rachael Dottle,Andrei Scheinkman, Gus Wezerek, and Julia Wolfe.
Following up on yesterday’s post about the facts on tariffs, today we look at an article from Politico that polled voters on their feelings about trade and trade policy. Now the poll dates from the beginning of June and unfortunately a lot of things have changed since then. But, the data overwhelmingly supports the conclusion that voters, at that time at least, do not support placing tariffs on goods coming into the US.
Let’s take a look at another component of the article, however, a chart exploring the infamous trade deficit. First of all, trade deficits do not work like how the president says they do—but we will come back to that in another post. In short, trade deficits are neither good nor bad. They are just one way of describing one facet of a trade relationship between two countries.
This piece looks at the trade balance between the United States and China.

Now, from the topical standpoint, it does a really nice job of showcasing how our imports have surged above our experts. From a topical standpoint, however, we do not know if this is a total trade deficit or just in goods, like the president prefers to talk about, or in goods and services, the latter of which accounts for way more than half of the US economy.
From a design perspective, I have a few thoughts and the first is labelling. The chart does label the endpoints of the data set, 1985 and 2017. But aside from a grey bar representing the Financial Crisis, there are few other markers to indicate the year. In smaller charts, I often do this myself, because space. But here there is enough space for at least a few intervening years to be labelled.
Secondly, the white outline of the red line. I have talked before of a trend to showcase a line over other lines with that thin stroke. But this is the first time I can recall the effect being used over an area filled with colour. Is it necessary? Because the area is light and the line dark and bright, probably not.
Then the outline appears on the text in the graphic, in particular the labels of imports, exports, and the trade deficit label. The labels for the imports and exports likely are necessary because of that light grey used for the text. But, as with the line for the trade deficit, its label likely provides sufficient contrast the thin white outline isn’t necessary.
Credit for the piece goes to Jeremy C.F. Lin.