Today isn’t a Friday, but I want to take a quick look at something that made me laugh aloud—literally LOL—whilst simultaneously cringe.
Not surprisingly it has to do with Trump and data/facts.
This all stems from an interview Axios’ Jonathan Swan conducted with President Trump on 28 July and that was released yesterday. I haven’t watched the interview in its entirety, but I’ve seen some excerpts. Including this gem.
It’s eerily reminiscent of a British show called The Thick of It written by Armando Iannucci or probably more accurately an interview out of one his earlier works with Chris Morris, On the Hour or The World Today. He later went on to create Veep for American audiences, based loosely or inspired by the Thick of It, but I found it a weak substitute for the original. But I digress.
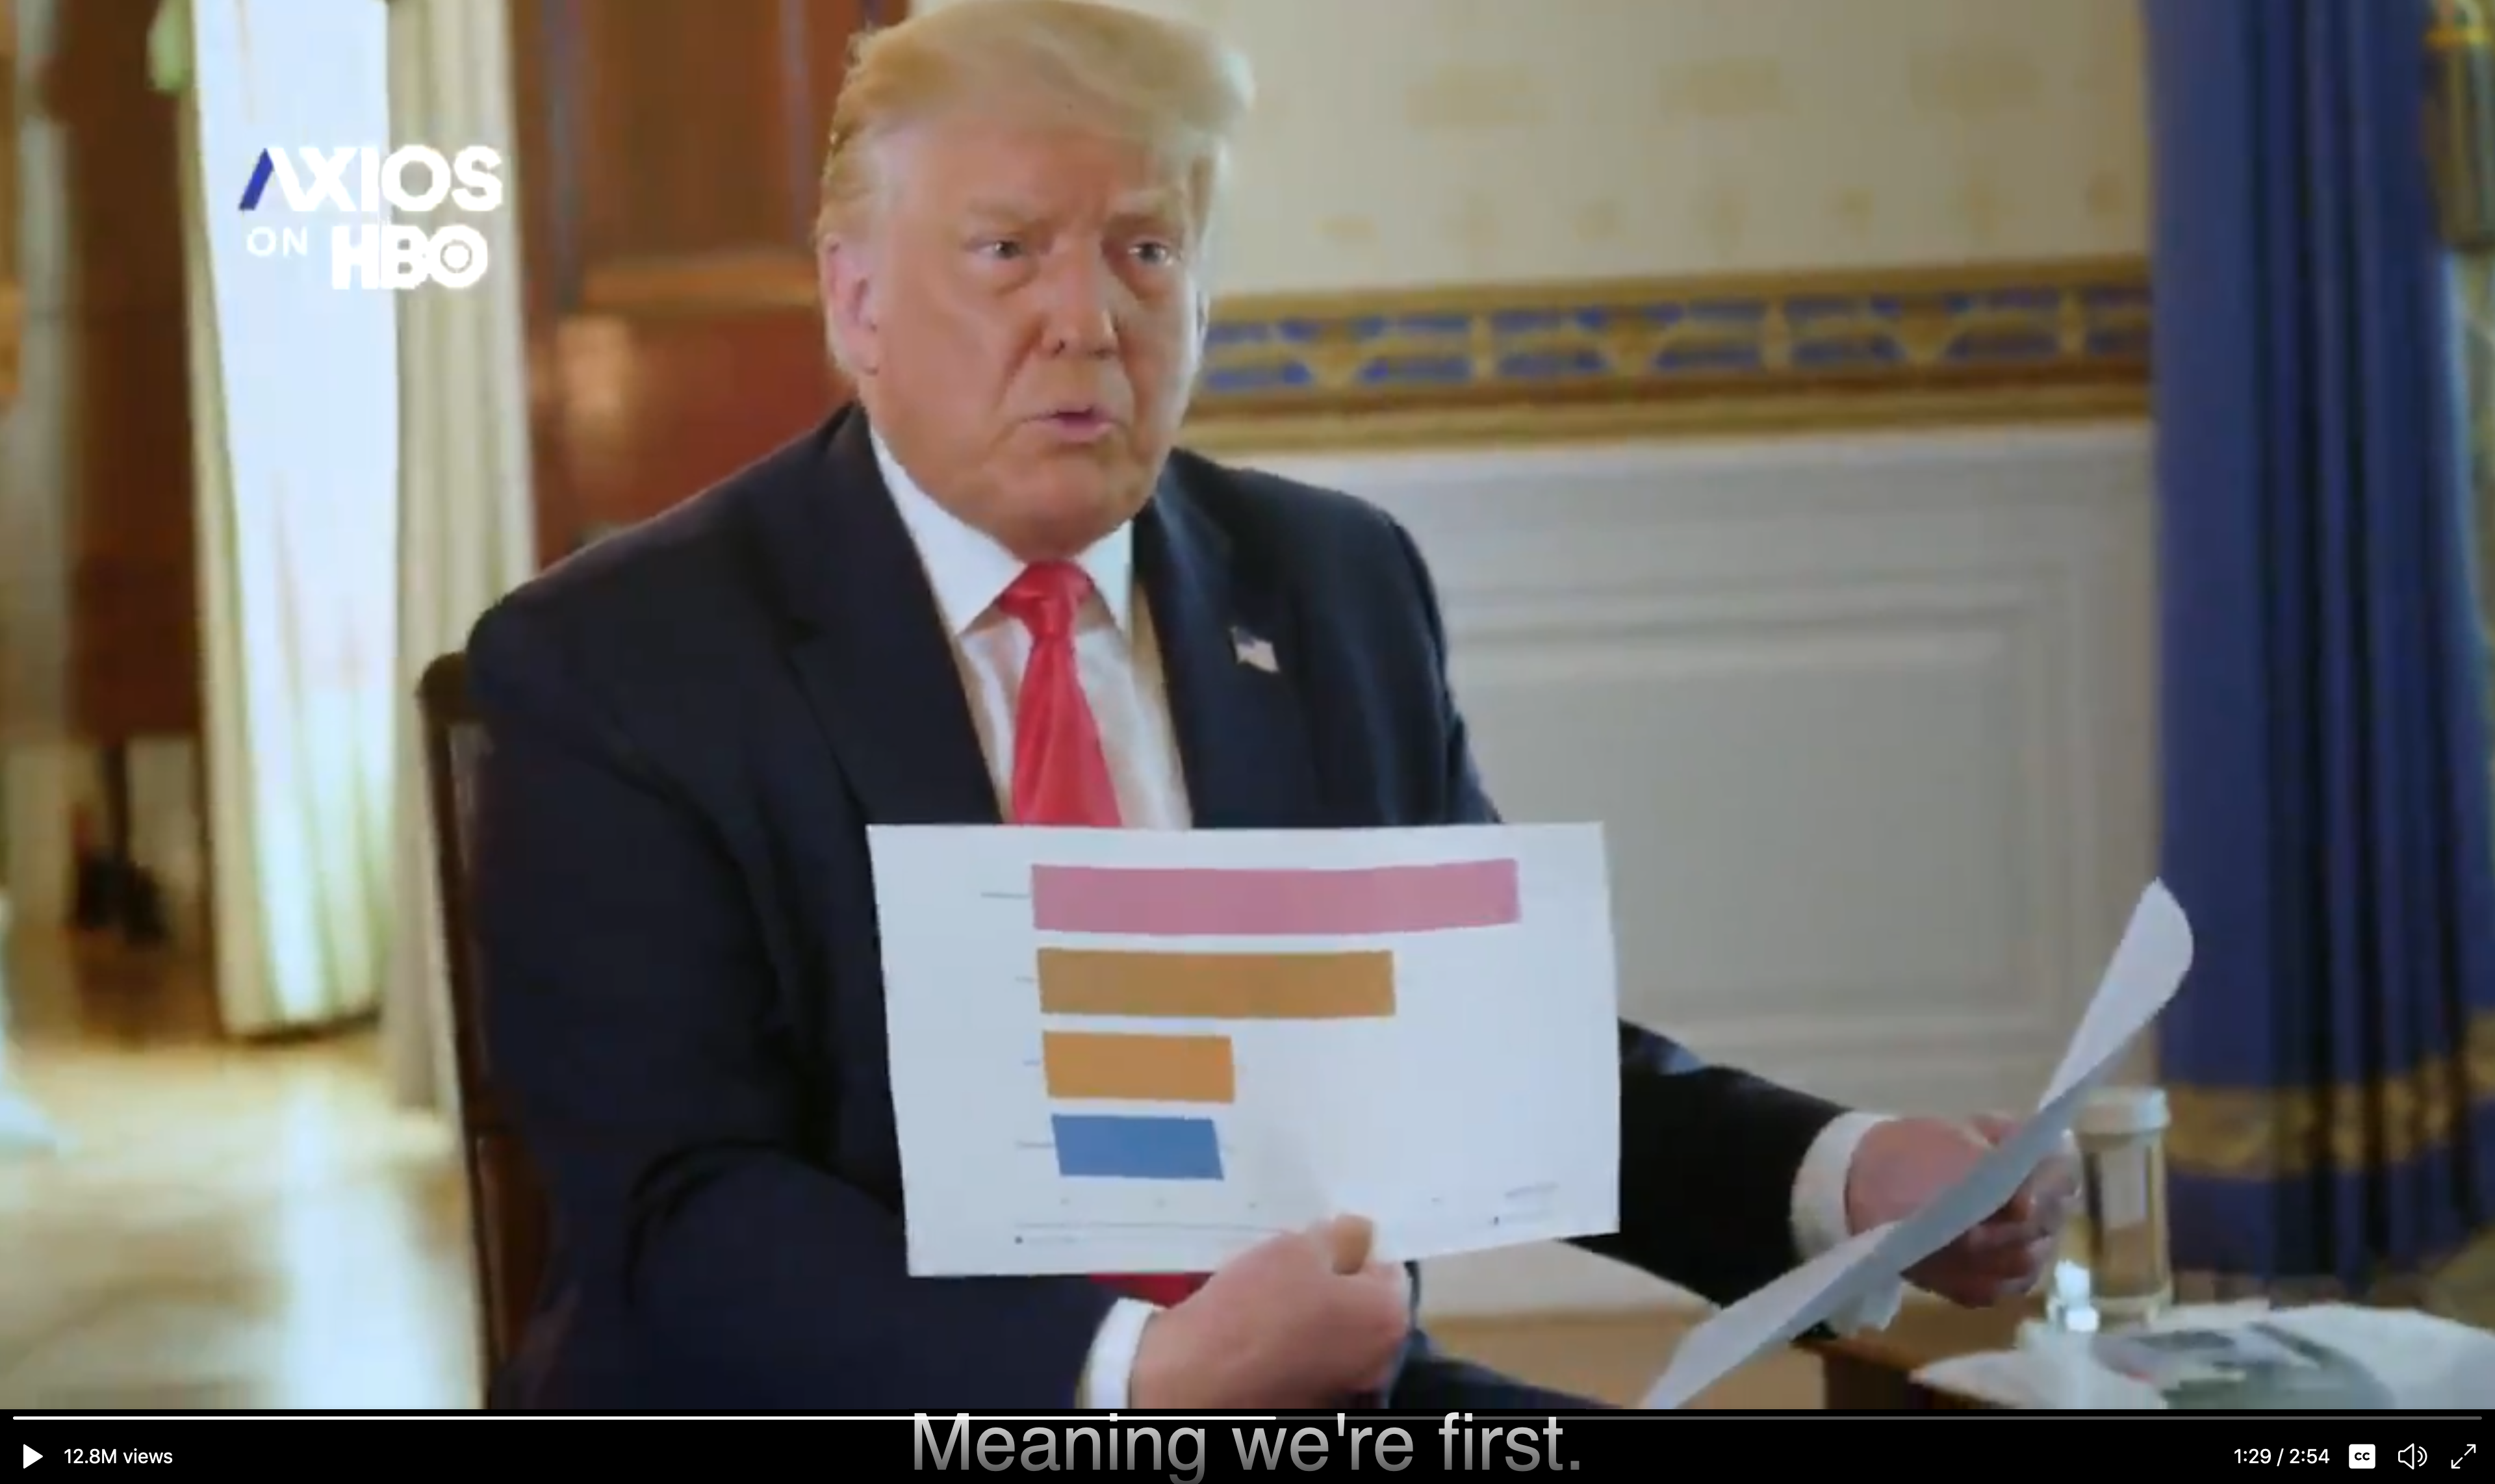
In that clip, the President talks about how he looks at the number of deaths as a share of cases, the case fatality rate, whilst Swan is discussing deaths as a share of total population, deaths per capita. Now the latter is not a great data point to use, especially in the middle of the pandemic, because we’re not certain what the actual denominator is. I’ve discussed this before in some of my “this is not the flu” posts where the case fatality rate, sometimes more commonly called simply the mortality rate, was in the 3–5% range.
Regardless of whether or not one should use the metric, here is how the President visualised that data.

Four big and beautiful bar charts. The best charts.
The President claims the United States “Look, we’re last. Meaning we’re first. We have the best. Take a look again, it’s cases [it’s actually still the case mortality rate]. And we have cases because of the testing.”
The problem is that one, it’s the wrong metric. Two, the idea that testing creates cases is…insane. Third, the United States is last in that big set of bar charts. Why is every country a different colour? In the same data series, they should all be the same, unless you’re encoding a variable such as, say, region via colour. But with four data points, a bar chart taking up the entirety of a US-letter sized paper is grossly inefficient.
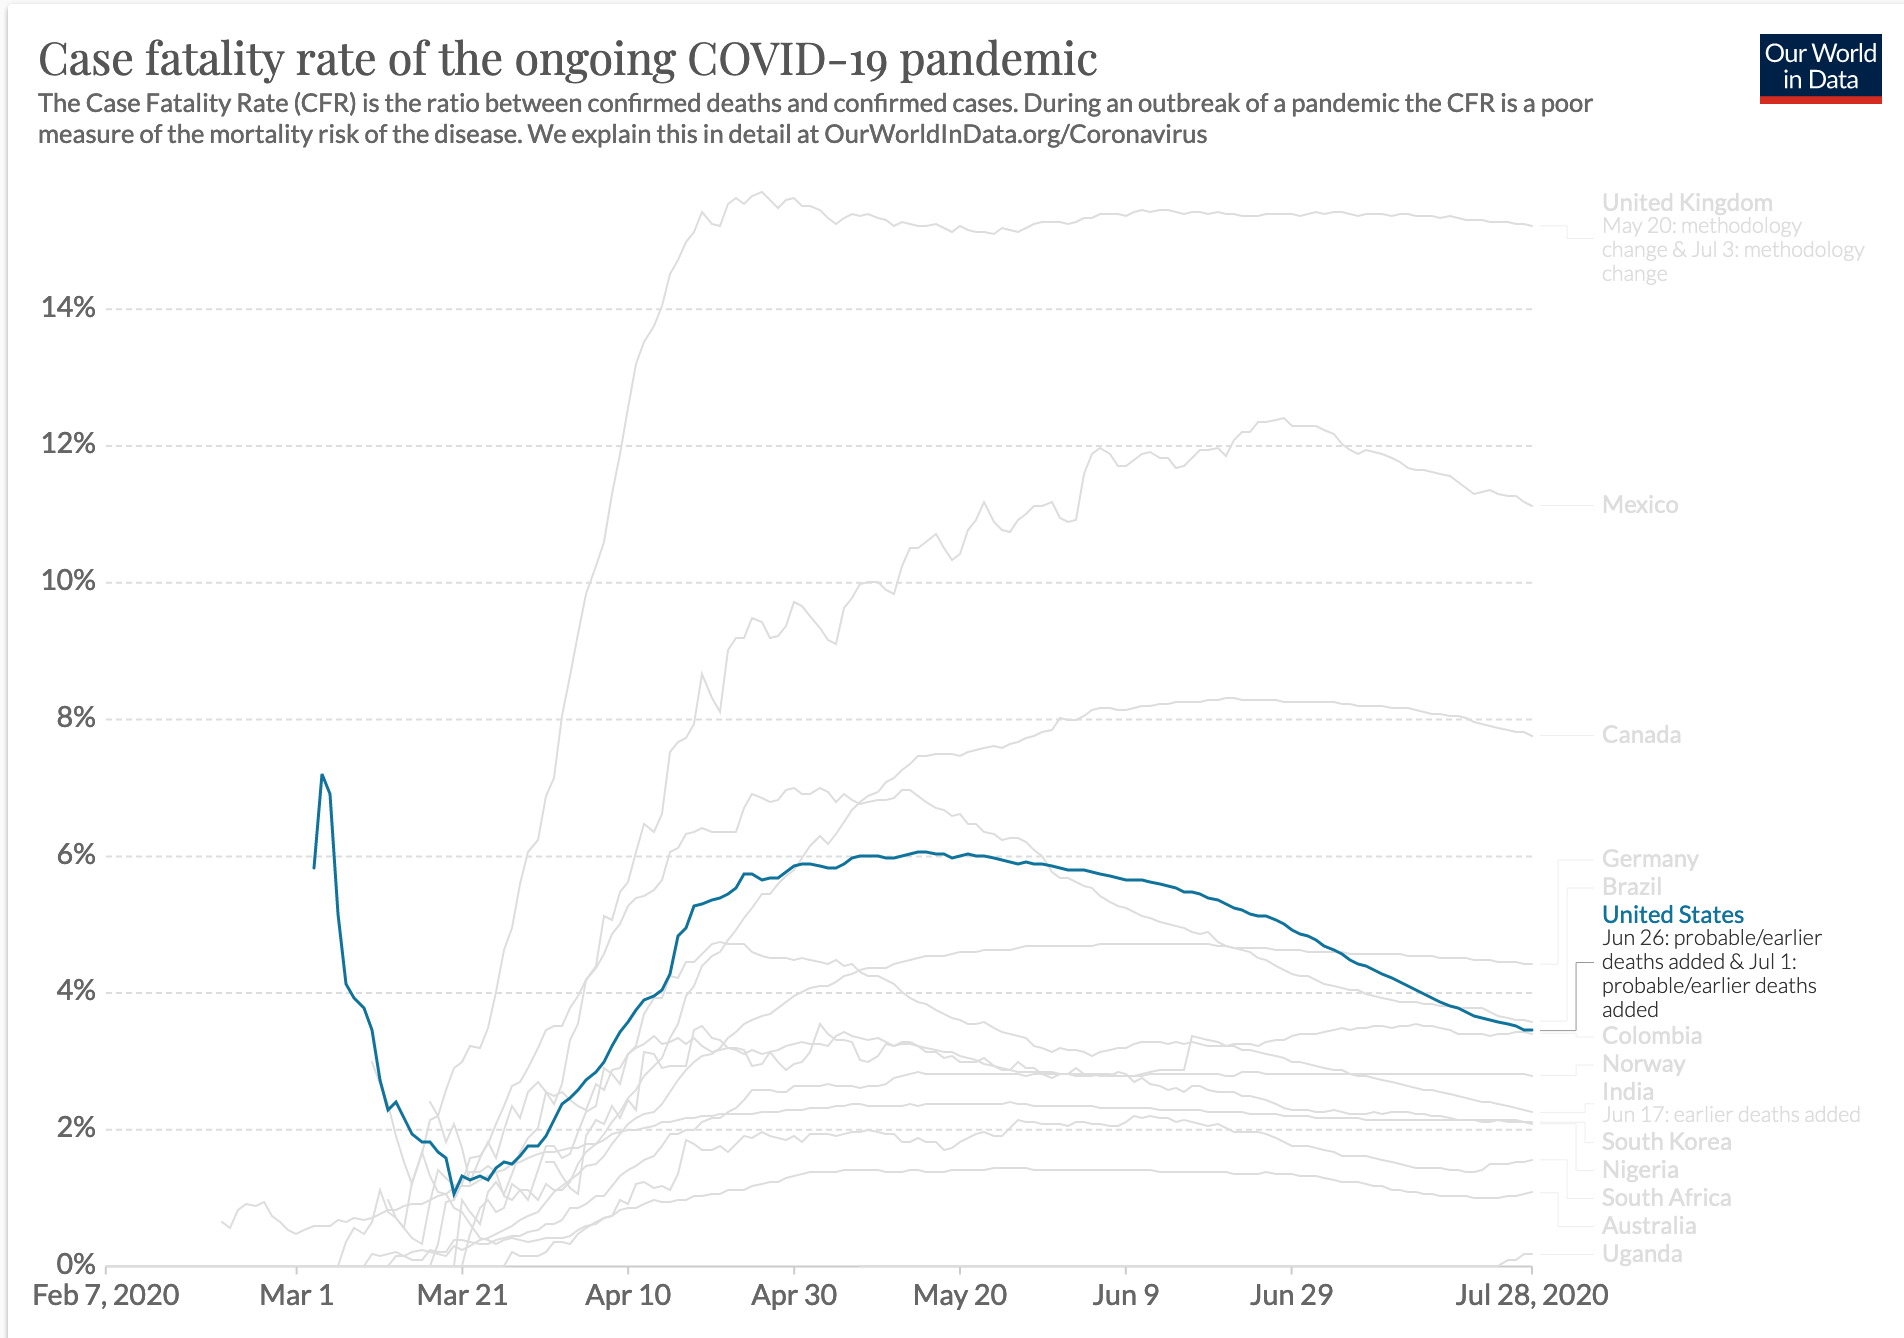
But that’s not even the full picture. Because if you look at a more robust data set, this one from Our World in Data, we get a better sense of where the United States sits.

Still not the highest on the chart, true. But even in this set; Norway (of not a shithole fame), India, South Korea, New Zealand, South Africa, and Congo all rank lower. The United States is far from last. And for those wondering, yes, I took the data from the same date as the interview.
There’s another clip within that clip I linked to earlier that deals with South Korea’s numbers and how the President says we “don’t know that”. And this is the bigger problem. We all know that data can be manipulated. But if we cannot agree that the data is real, we cannot have a framework for a real discourse on how to solve very real problems.
As someone who works with data to communicate information or stories on a near daily basis, this is just frightening. It’s as if you say to me, the sky is a beautiful shade of blue today without a cloud in the sky and I reply, no, I think it’s a foreboding sky with those heavy clouds of green with red polka dots. At that point we cannot even have a discussion about the weather.
And it’s only Tuesday.
Credit for the Trump graphic goes to somebody in the White House I assume.
Credit for the complete graphics goes to Our World in Data.
