Today’s piece isn’t strictly about data visualisation. Instead it’s a nice article from the BBC that explores the nascent industry of undersea mining. What caught my interest was the story of Soviet submarine K-129, which sank mysteriously in the middle of the Pacific. But that isn’t even half the story, so if you are interested go and read the article for that bit.
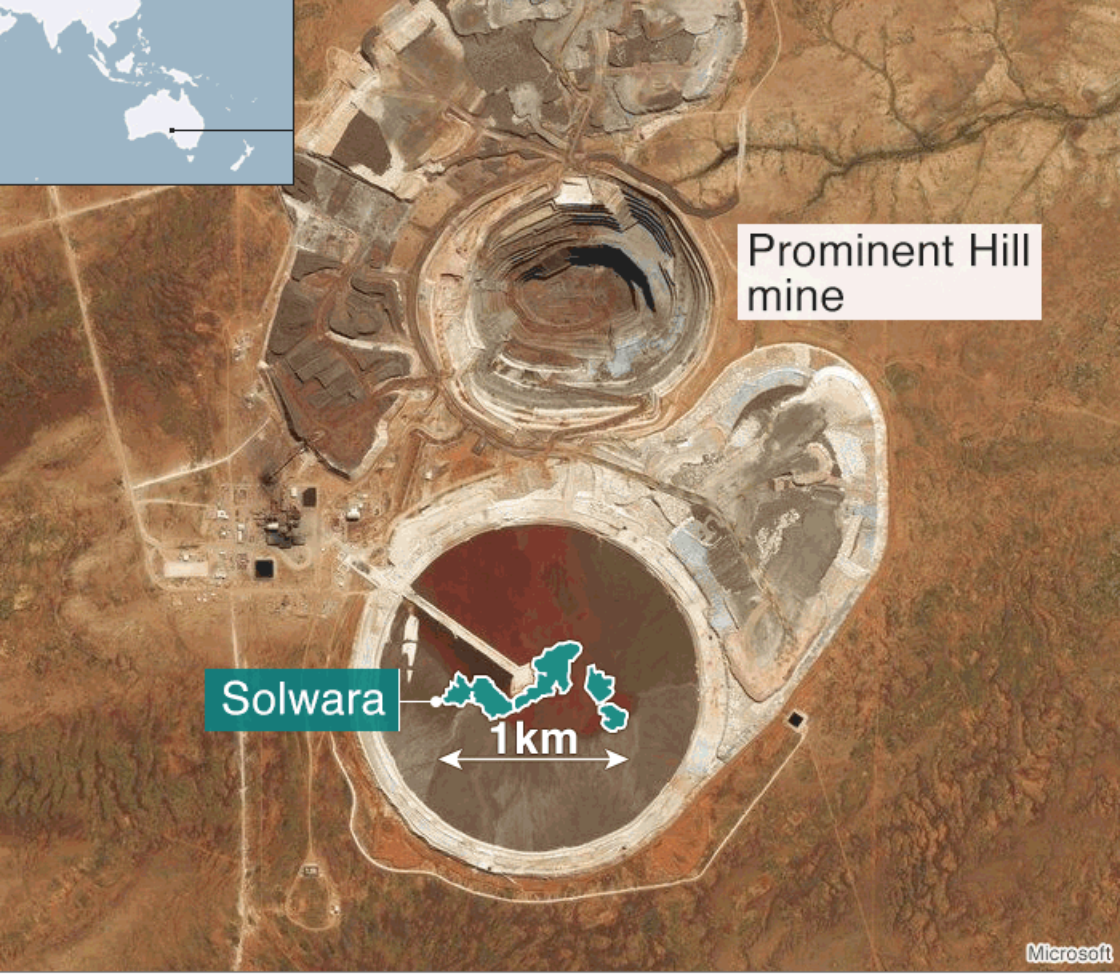
But that sinking may have created the beginning of the undersea mining industry. And so as I read on, I found a nice mixture of text, photography, and graphics explaining processes and such. This screenshot is a comparison of the size of an undersea mining zone compared to a land-based copper mine.

Some of the graphics could use some polish and finesse, but I do appreciate the effort that goes into creating pieces like this. You will note that four different people had to work together to get the piece online. But if this is perhaps the future of BBC content, this is a great start.
Credit for the piece goes to David Shukman, Ben Milne, Zoe Barthlomew, and Finlo Rohrer.
