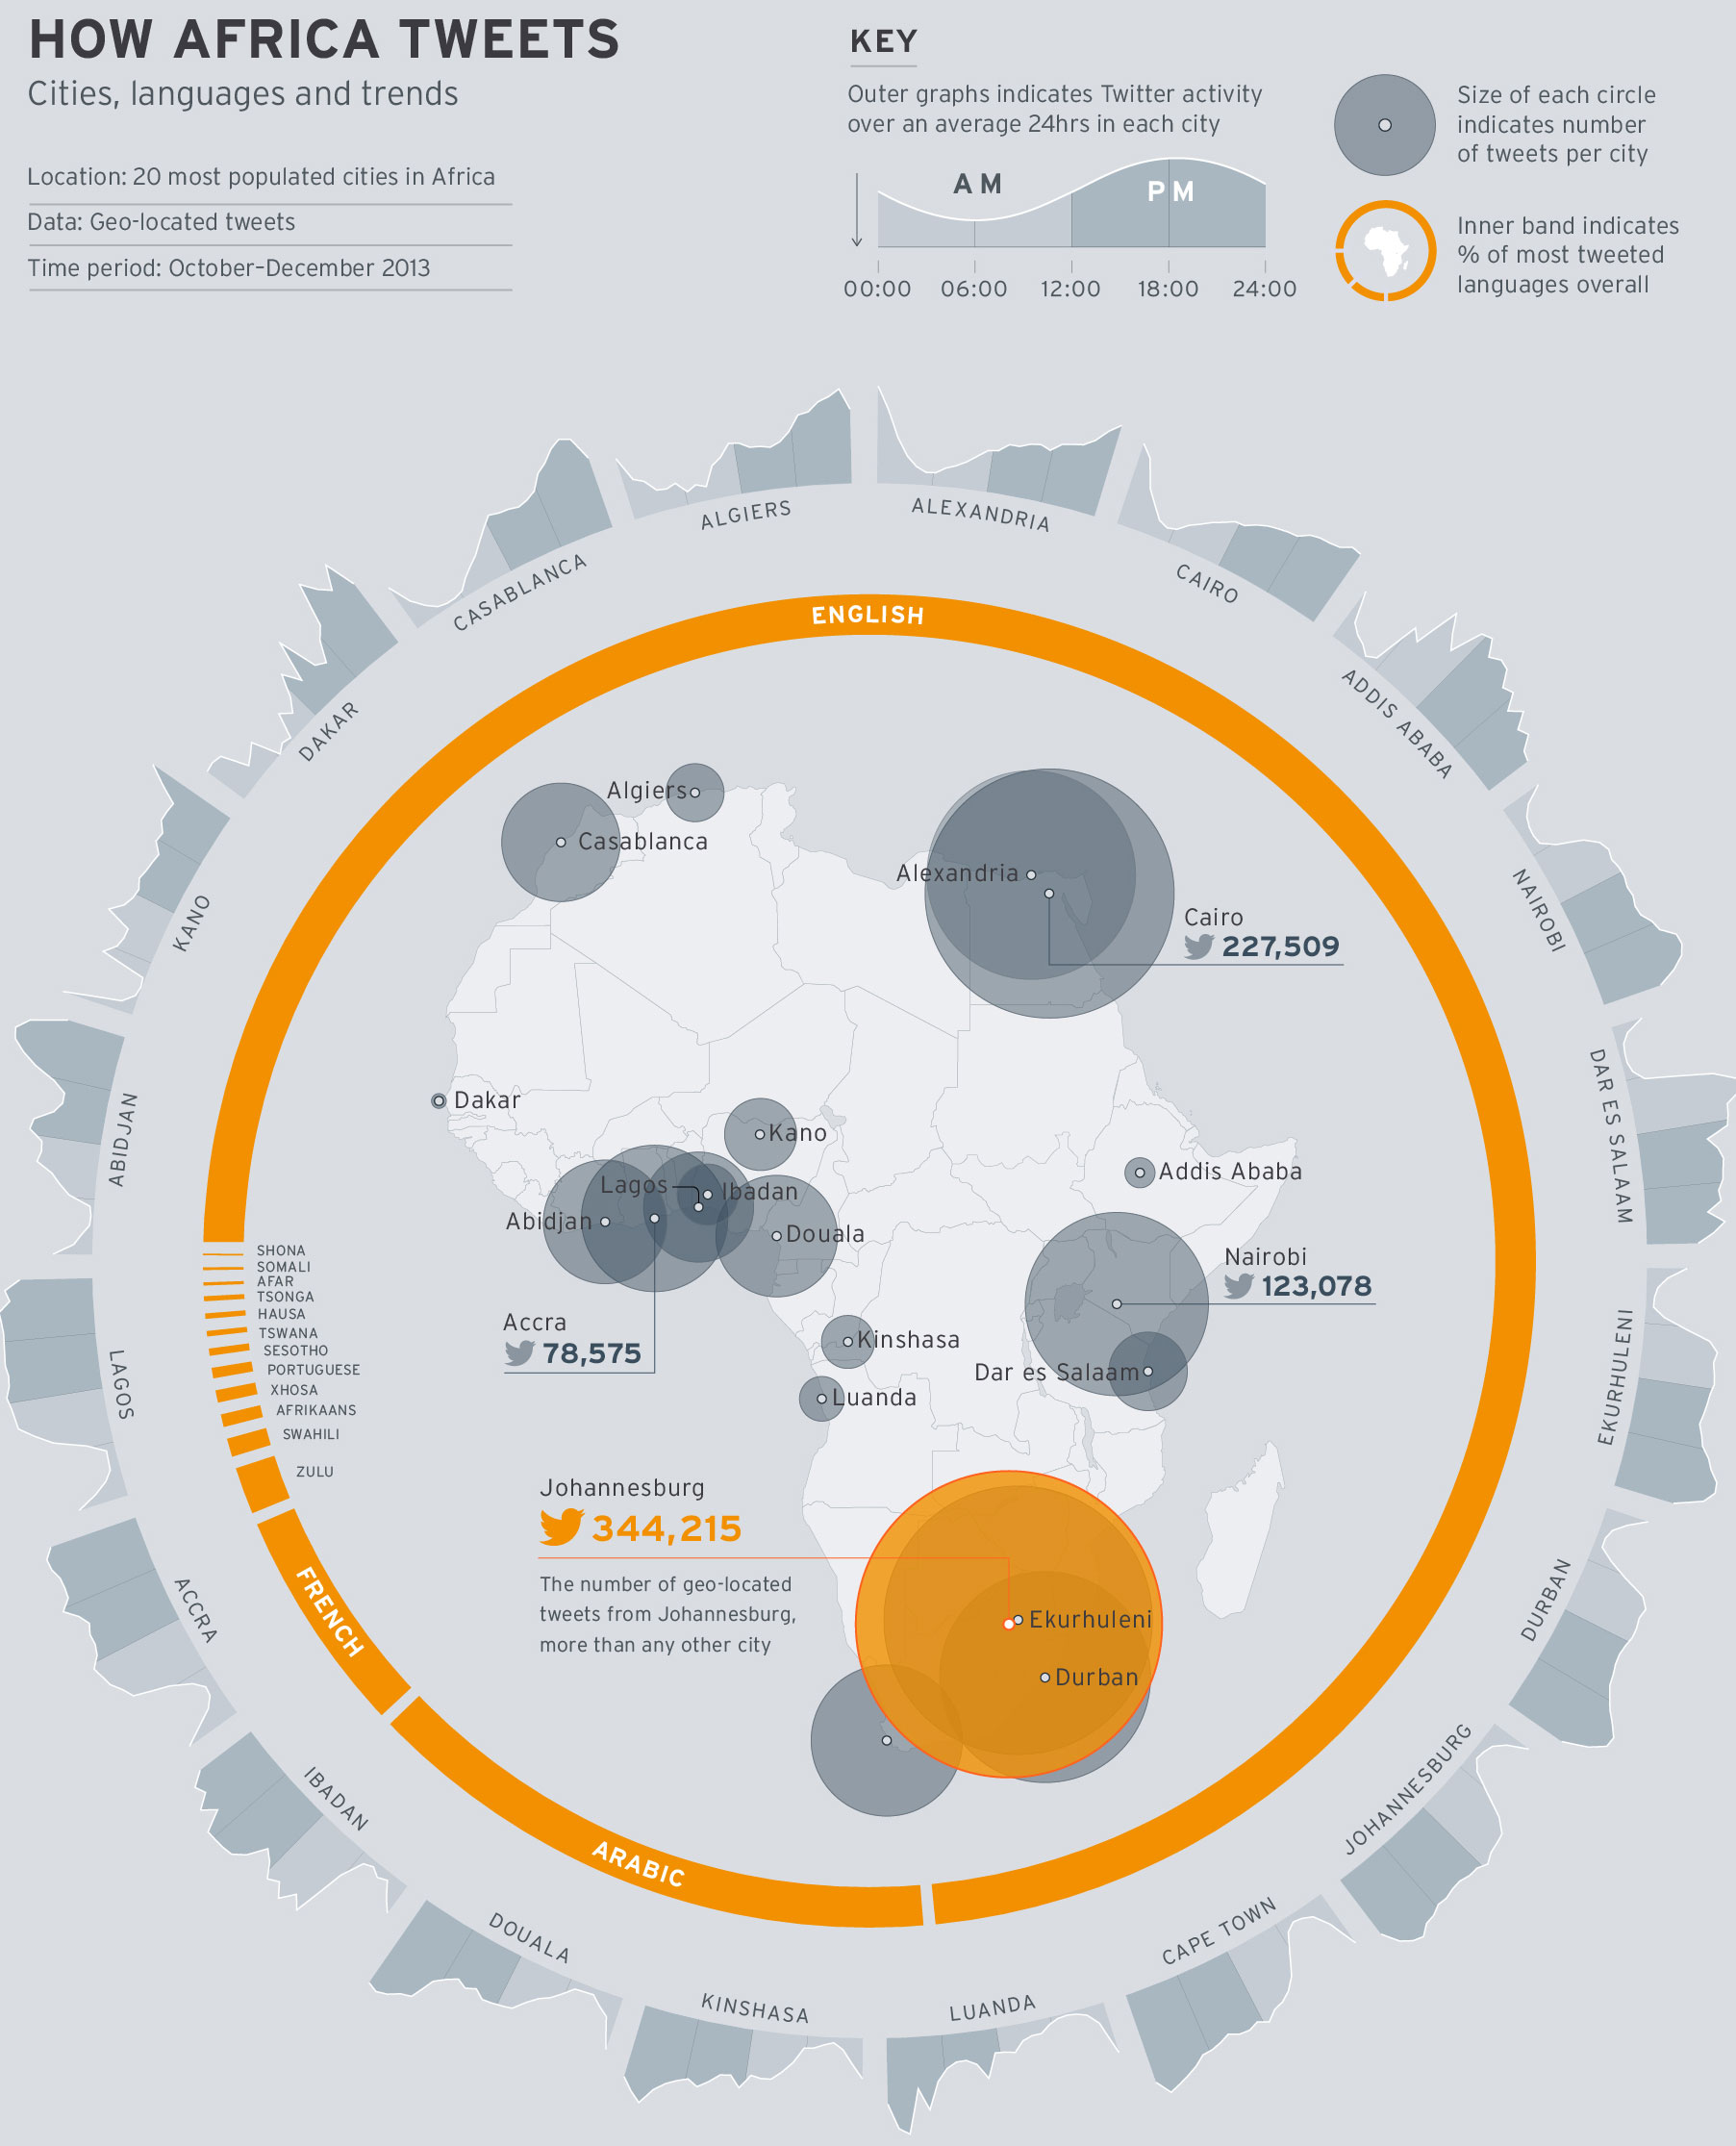
Today’s piece is hit and miss. It comes from the World Economic Forum and the subject matter is the use of Twitter across Africa. I think the subject matter is interesting; mobile communication technology is changing Africa drastically. The regional trends shown in the map at the core of the piece are also fascinating. Naturally I am left wondering about why certain countries. Does spending on infrastructure, GDP per capita, disposable income levels have any sort of correlation if even only on a national and not city level?

But what really irks me is the content that wraps around the map. First the donut chart, I think my objections to donuts—at least the non-edible kind—are well known. In this case, I would add—or sprinkle on—that the white gaps between the languages are unnecessary and potentially misleading.
Secondly, the cities are eventually displayed upside down. Thankfully the labels are reversed so that city names are legible. However, the continually changing angle of the chart makes it difficult to compare Douala to Luanda to Alexandria. A neatly organised matrix of small multiples would make the data far clearer to read.
In short, I feel this piece is a good step in the right direction. However, it could do with a few more drafts and revisions.
Credit for the piece goes to Allan Kamau.
