Redaction Action

Last week, the Department of Justice released the Mueller Report. It was—and still is—sort of a big deal. But this week I want to take a look at a few different approaches to covering the report in the media. We will start with a piece from Vox on the redactions in the report. After all, we only know what we know. And we know there is about 7% of the report we do not know. And we do not know what we do not know.

7% is still a fair amount of black when it's concentrated in one section.
7% is still a fair amount of black when it’s concentrated in one section.

The above graphic looks at overall redactions as images of each page show how much was withheld from the public. Then we have a small donut chart to show that 7.25% was redacted. Did it need to be a donut? No. A simple factette could have worked in its place. It could be worse, though, it could be a similarly sized pie chart.

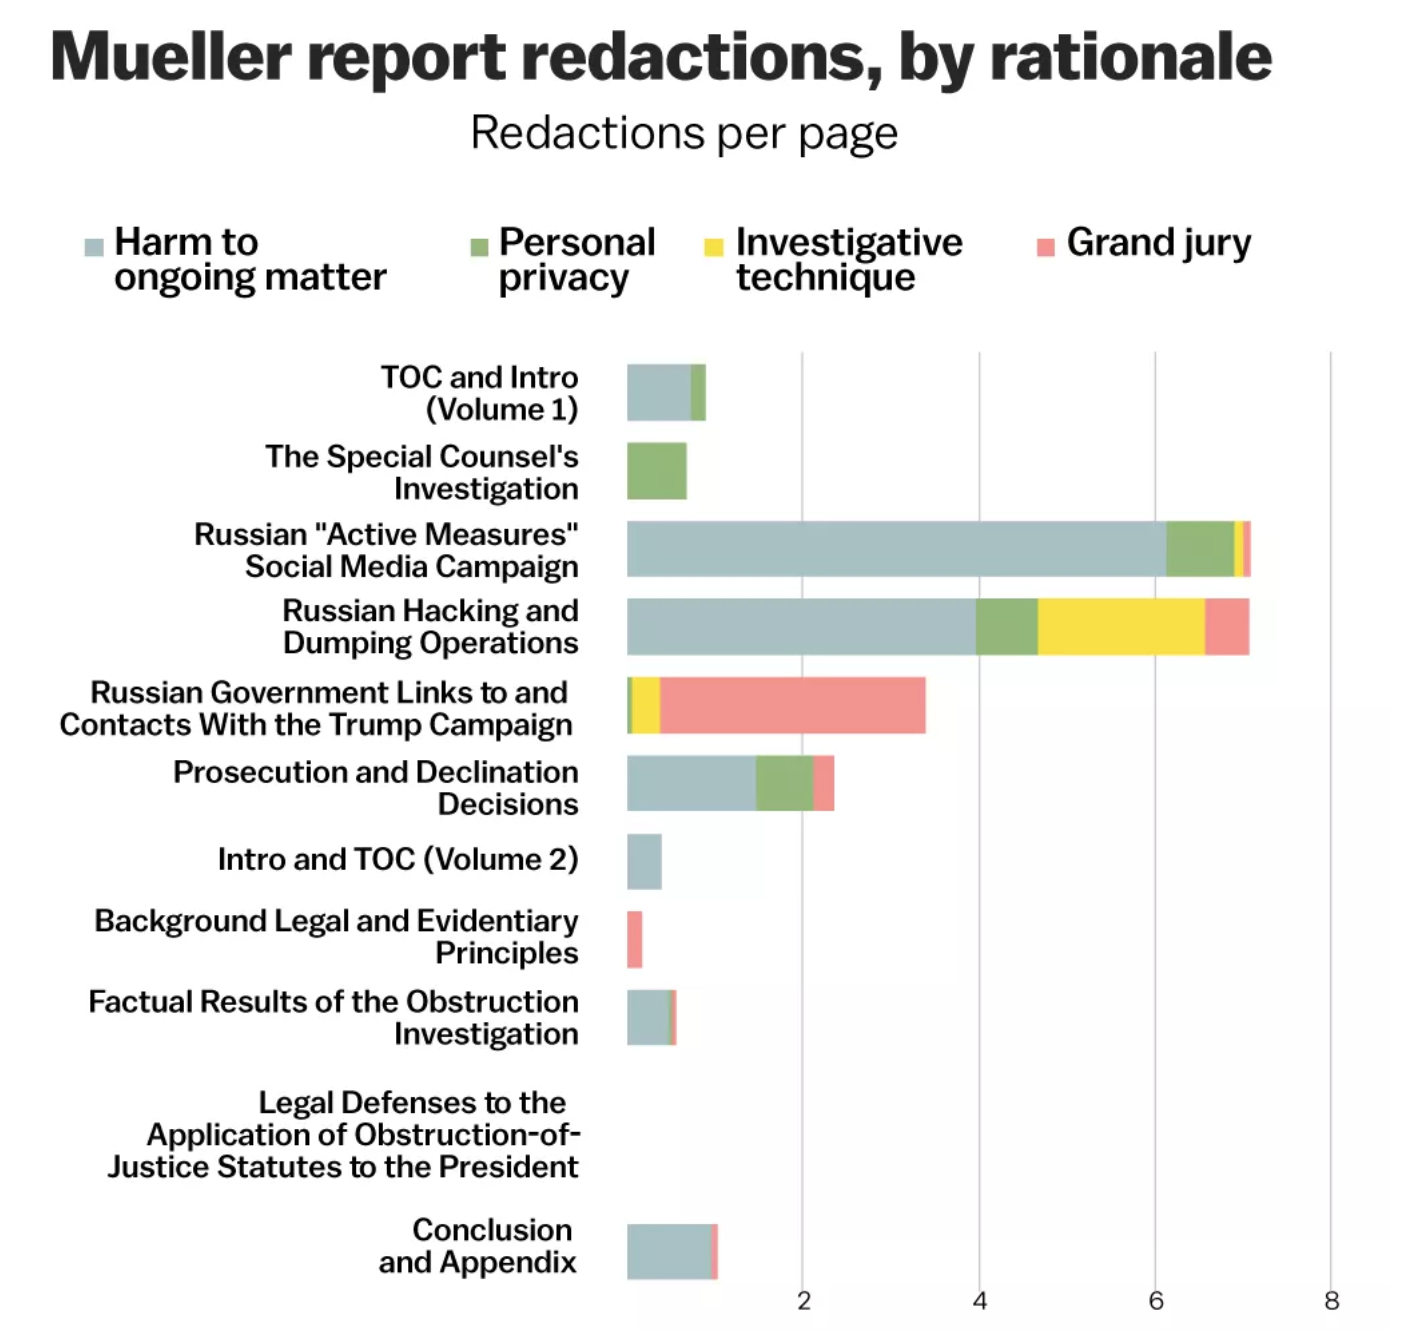
The rest of the article moves on to a more detailed analysis of the redactions, by section, type, &c. And this screenshot is one of the more interesting ones.
Different coloured sharpies

Fundamentally we have stacked bars here, with each section’s redactions per page broken down by type. And that is, on the one hand, useful. Of course, I would love to see this data separated out. That is, show me just “investigative technique” and filter out the rest. Imagine if instead of this one chart we had four slightly smaller ones limited to each type of redaction. Or, if we kept this big one and made four smaller ones showing the redaction types.

Overall the article does a really nice job of showing us just what we don’t know. Unfortunately, we ultimately just don’t know what we don’t know.

Credit for the piece goes to Alvin Chang and Javier Zarracina.

Follow the State’s Money

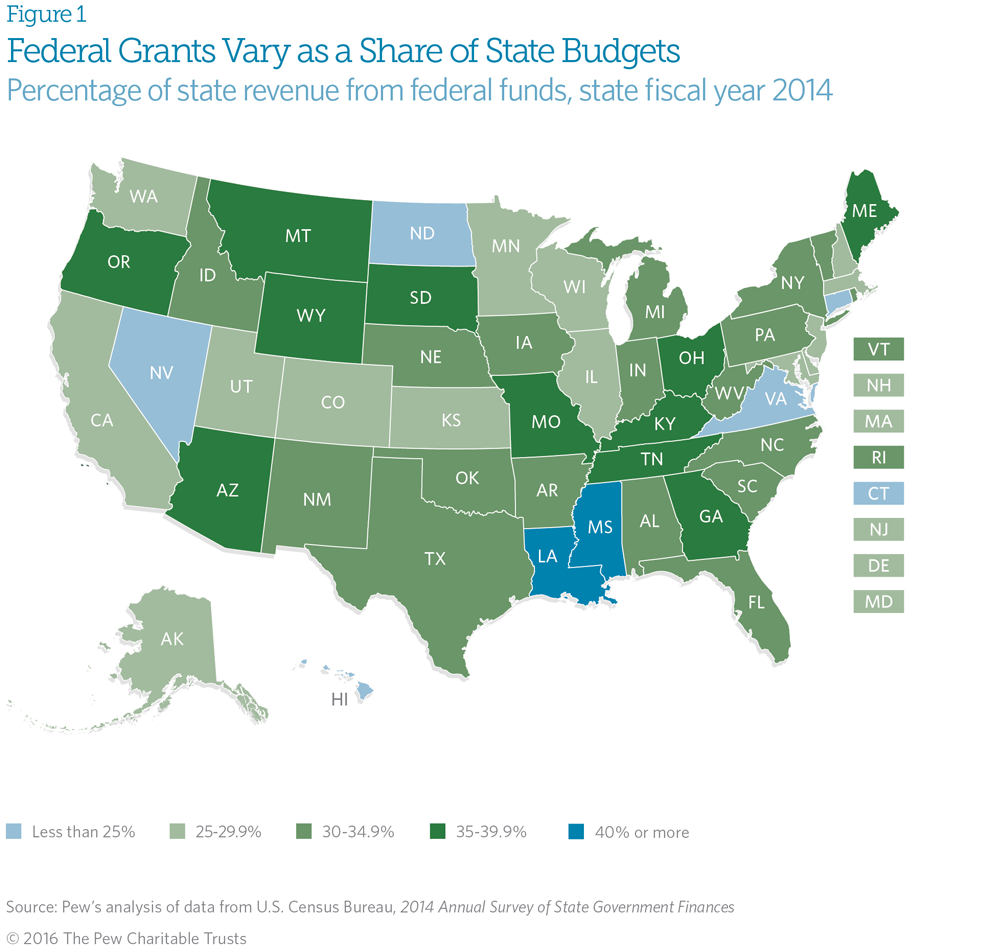
In politics, it is really easy and often popular to bash the federal government. Especially when it comes to its penchant for collecting taxes to pay for things. And sometimes those things are in other states than your own. But do you know how much federal money goes back to your own state? Well now you can thank the Pew Charitable Trusts for putting together this piece that explores what percentage of state budgets is comprised of federal grant money.

Federal money for state budgets

While the piece also includes a donut chart—because why not?—my biggest gripe is with the choropleth and the choice of colour for the bins. If you look carefully at the legend, you will see how both the lowest and highest bins use a shade of blue. That means blue represents states that receive less than 25% of their budget from federal grants and also states that receive more than 40% of their budget from the same federal grants. But if your state is between 25% and 40%, your state suddenly turns a shade of green. It really makes no sense. I think the same colour, either blue or green, could be used for the entire spectrum. Or, if the designers really wanted a divergent scheme, they could have used the national average and used that as the breakpoint to show which states are above and which are below said average.

Credit for the piece goes to the Pew Charitable Trusts graphics department.

OD’ing in Philly

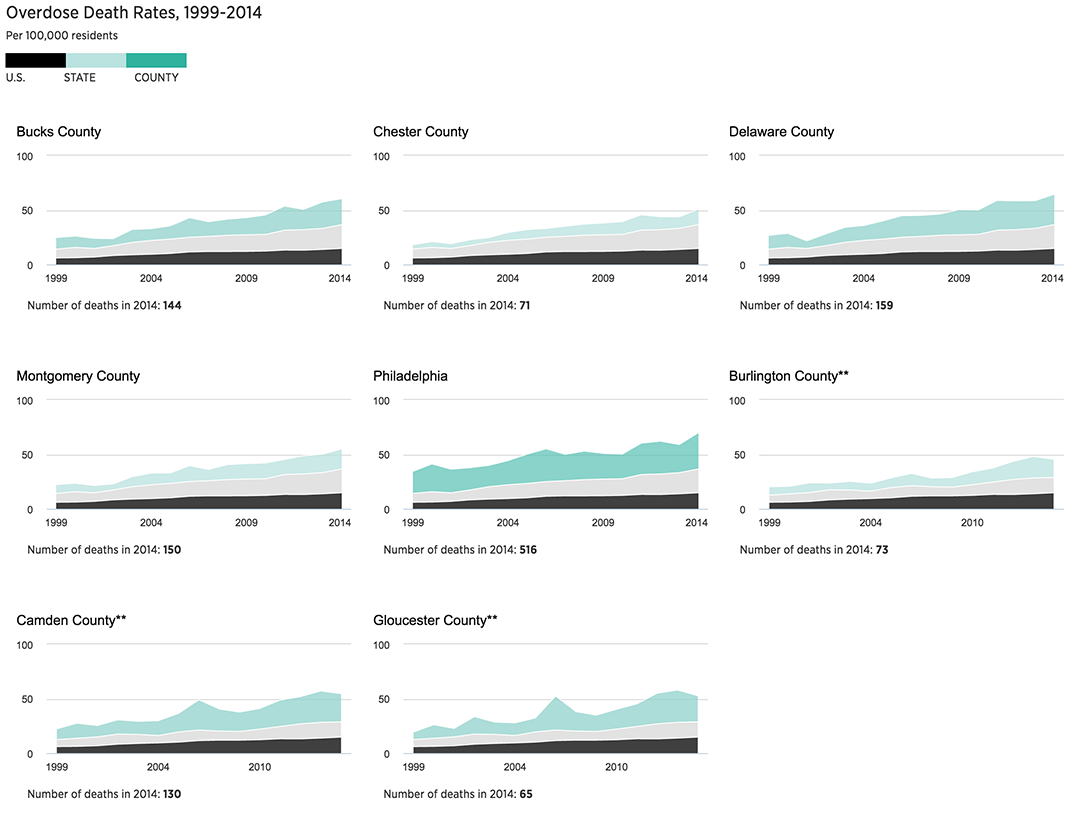
Another day in Philadelphia, another post of Philly data visualisation work. Here we have a piece from 2015 that was updated earlier this spring. It looks at overdose rates in the Philadelphia region, including parts of New Jersey. It does include a map, because most pieces like this typically do. However, what I really find interesting about the piece is its use of small multiple line charts below to take a look at particular counties.

The piece overall is not bad, and the map is actually fairly useful in showing the differences between Jersey and Philadelphia (although why New Jersey is outlined in black and the Philly suburban counties are not I do not know). But I want to take a look at the small multiples of the piece, screenshot below.

Philly area counties

You can see an interesting decision in the choice of stacked line charts. Typically one would compare death rates like for like and see whether a county is above, below, or comparable to the state, local, or national averages. But combining the three gives a misleading look at the specific counties and forces the user to mentally disentangle the graphic. I probably would have separated them into three separate lines. And even then, because of the focus on the counties, I would have shifted the colour focus to the specific counties and away from the black lines for the national average. The black is drawing more attention to the US line than to the county line.

Credit for the piece goes to Don Sapatkin.

Sugary Sweet Donut Charts

I know, I know. You probably expect some sort of climate post given the whole Paris thing. But instead, this morning I came across an article where the supporting chart failed to tell the story. So today we redesign it.

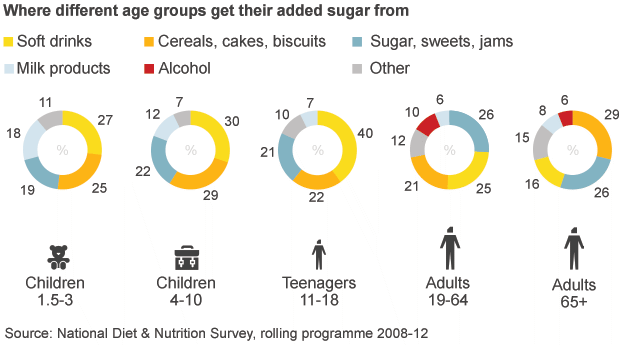
The BBC has an article about MPs backing a tax on sugary drinks. Within the text is a graphic showing the relative importance of sugary drinks in the sugar consumption of various demographics. Except the first thing I see is alcohol—not the focus of the article. Then I focus on a series of numbers spinning around donuts, which are obviously sugary and bad. Eventually I connect the bright yellow to soda. Alas, bright yellow is a very light colour and fails to hold its own on the page. It falls behind everything but milk products.

The BBC likes sugary donuts

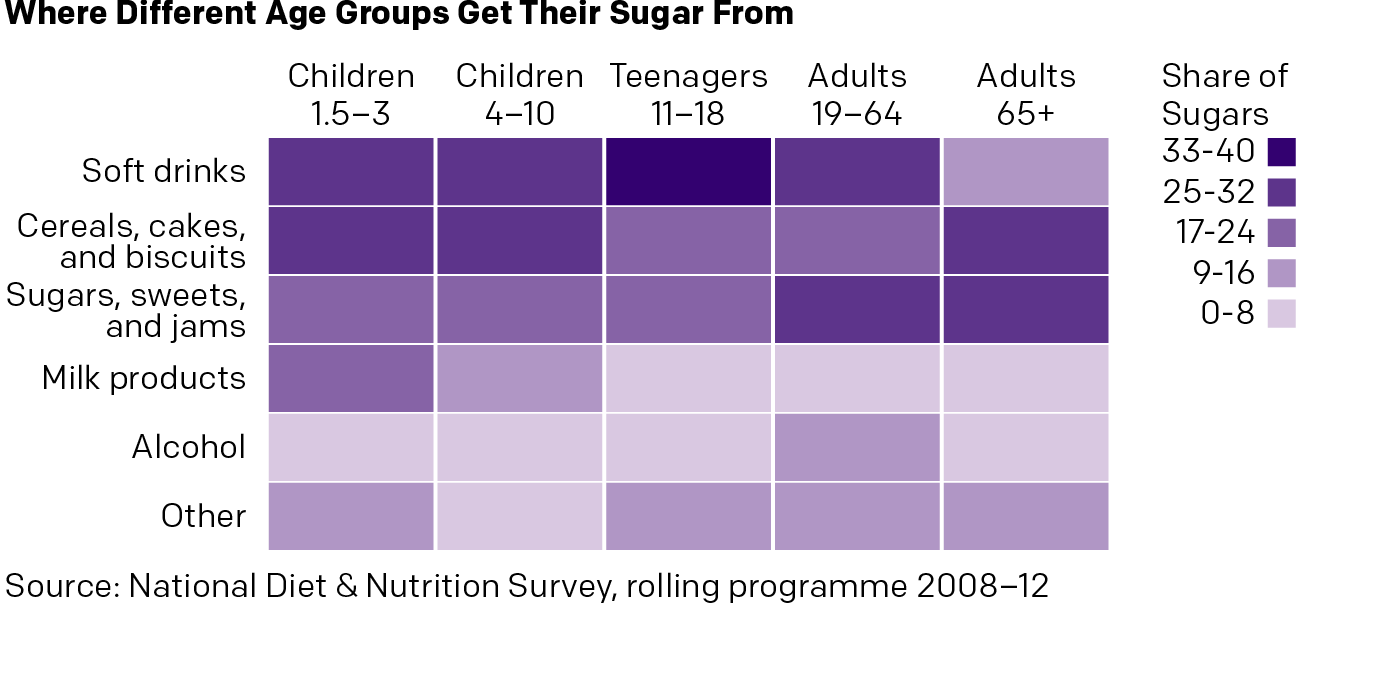
So here is 15 minutes spent on a new version. Gone are the donuts, replaced by a heat map. I kept the sort of the legend for my vertical because it placed soda at the top. I ran the demographic types horizontally. The big difference here is that I am immediately drawn to the top of the chart. So yeah, soda is a problem. But so are cakes and jams, you British senior citizens. Importantly, I am less drawn to alcohol, which in terms of sugars, is not a concern.

My version of sugar is so much sweeter

Credit for the original goes to the BBC graphics department. The other one is mine.

Rainbowship Enterprise

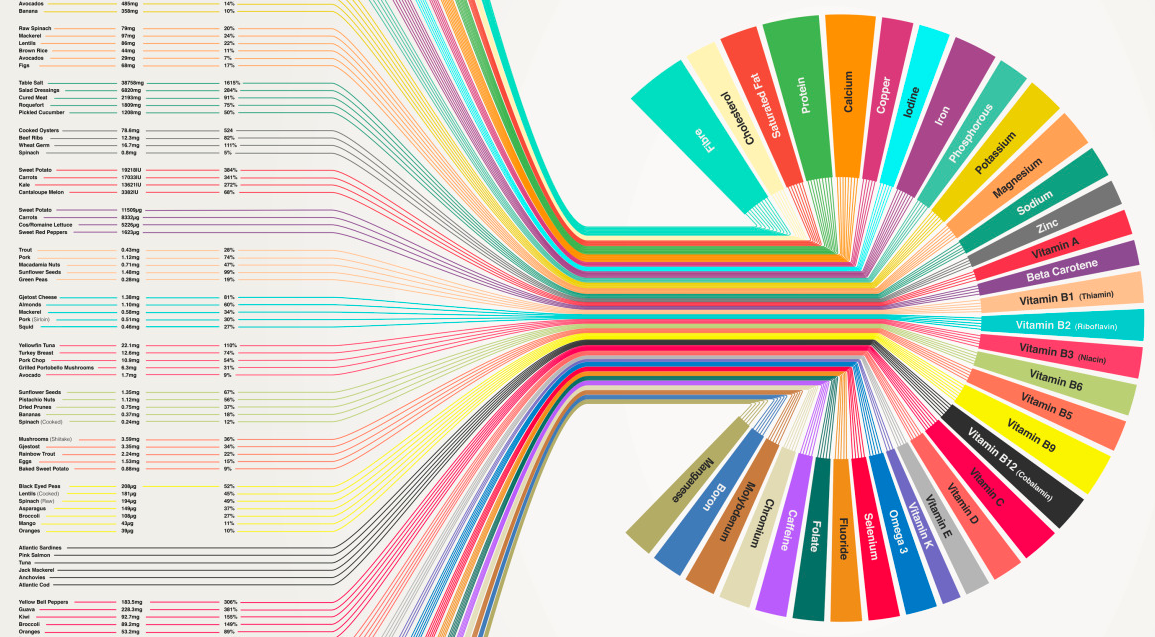
You can rightly file this one under what the fuck, which is how I found it on WTF Visualizations. The piece appears to be some sort of comprehensive guide to minerals, nutrients, and in which foods you can find them. But, as the critique title declares, this is more like Rainbowship Enterprise. How this is supposed to be remotely useful, I cannot even begin to fathom. But, hey, the title references Star Trek, so that’s a redeeming characteristic, right? Oh wait, that was in the criticism…

Set your phasers to stun(ningly bad)

Credit for the original piece goes to Nuique and datadial.

New New Orleans

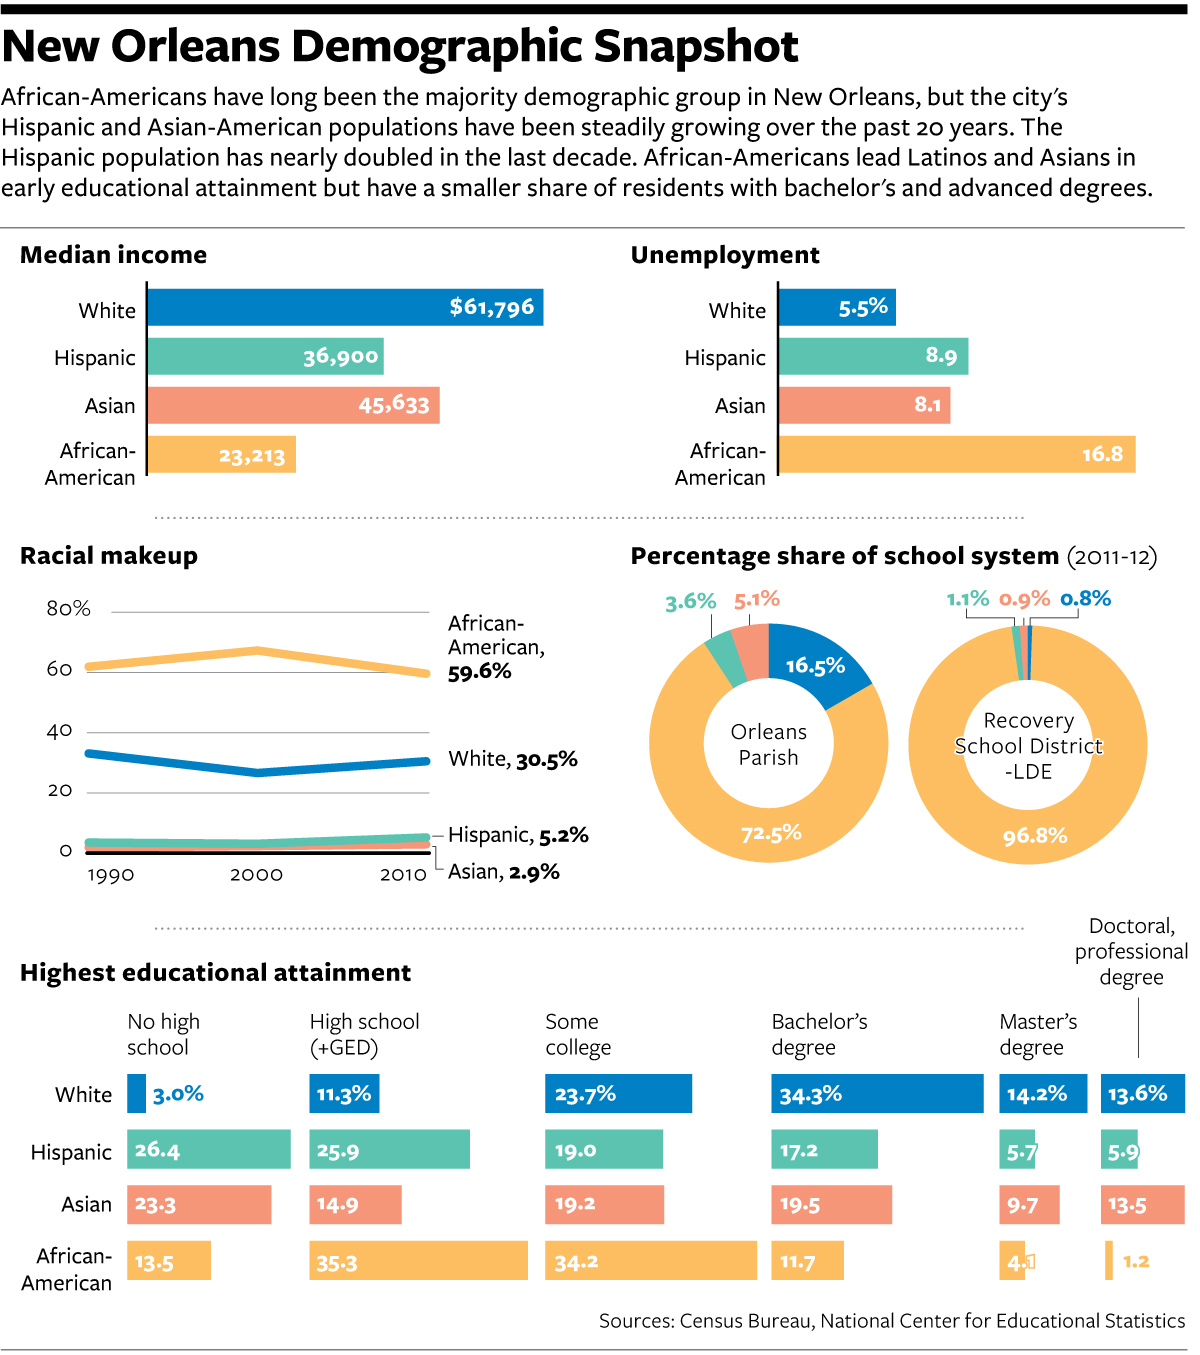
Nine years after the impact of Hurricane Katrina upon the city of New Orleans, the touristy French Quarter has returned according to an article in the National Journal. However, the new New Orleans beyond the French Quarter is different from what once was. In short, the new city is whiter and more Hispanic.

And while this graphic that accompanies the piece does a fair job of showing the title, a snapshot, I wish the focus would have been on more of a comparison between pre and post, old and new.

A quick look at New Orleans

I would not necessarily chosen the same components to tell the story. But, I really want to see more direct comparisons of even just the 2000 census and data to that of 2010.

Credit for the piece goes to the National Journal’s graphics department.

Calories and Consumption

National Geographic recently published a piece designed and built for them by Fathom Information Group. Content-wise, they looked at the historic consumption of food by several different countries. What do individual food groups contribute to the overall nutritional breakdown? For the piece this basically amounted to morphing donut charts. I get the reference, but do not care for the result.

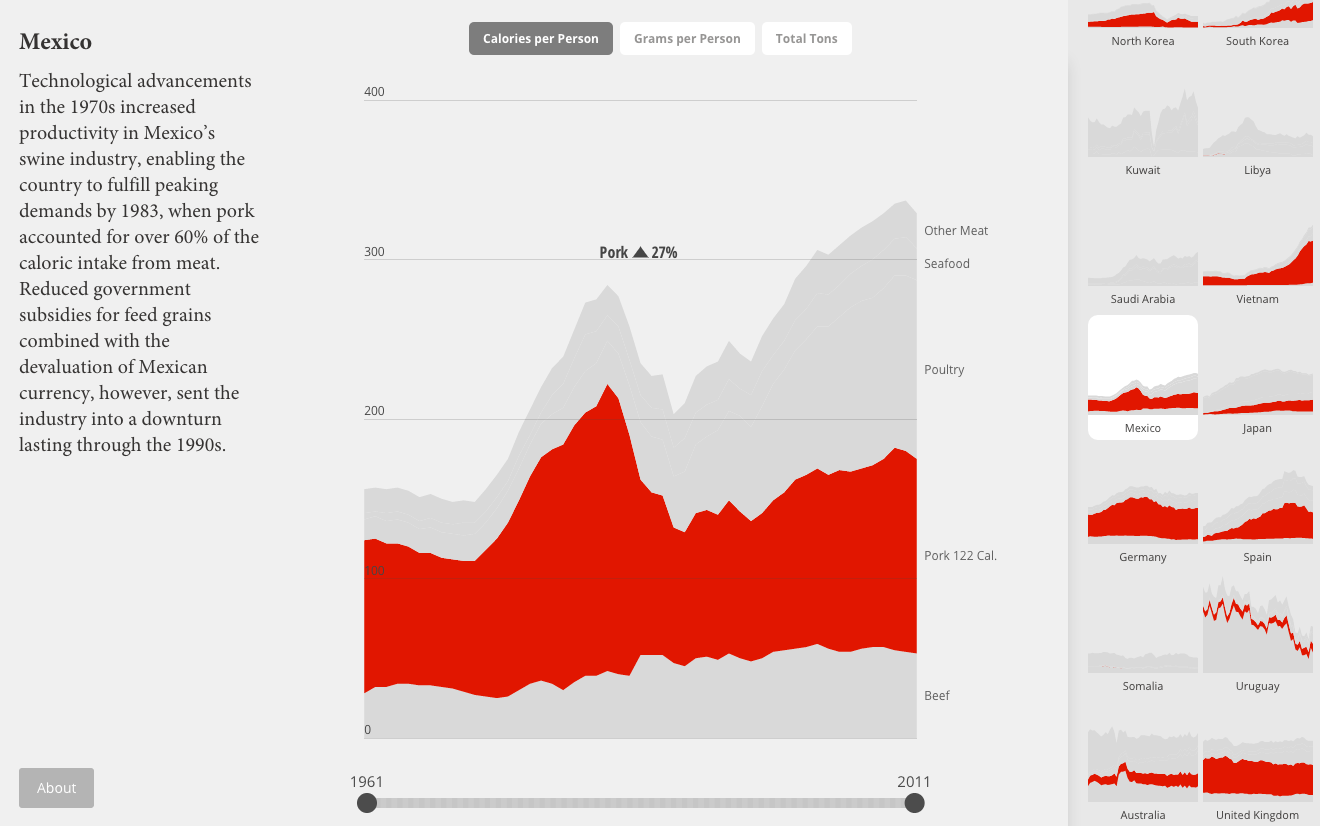
Instead more interesting is the second main view of the piece: meat consumption. Using stacked line charts, National Geographic explores changes in consumption patterns over the last 50 years. Some countries change a bit, others not so much. But as always the best examples are called out with an explanation as to why the changes. Mexico, for example, has the story about slashes in government subsidies and economic problems as to a decline in pork consumption.

Mexican pork consumption

Clearly I still have issues with the data visualisation. I would much rather see the selected view isolate the selection off the common baseline. But a nice touch is the small multiples from the country selection mechanism appearing to the right.

Credit for the piece goes to Fathom Information Design.

The UK’s Two-party System Continues to Decline

If you missed it, last week the United Kingdom held a few by-elections. For we Americans, those are like special elections for seats in the Senate or the House that are not part of the regular Congressional elections. Anyway, the big news was that the United Kingdom Independence Party (UKIP)—think Tea Party wanting out of the European Union…kind of—won a by-election for Clacton-on-Sea (not surprisingly located on the sea) from the Tories (think establishment Republicans). UKIP almost won a by-election away from Labour (kind of think Democrats?). The former was shocking but not surprising, the latter was both.

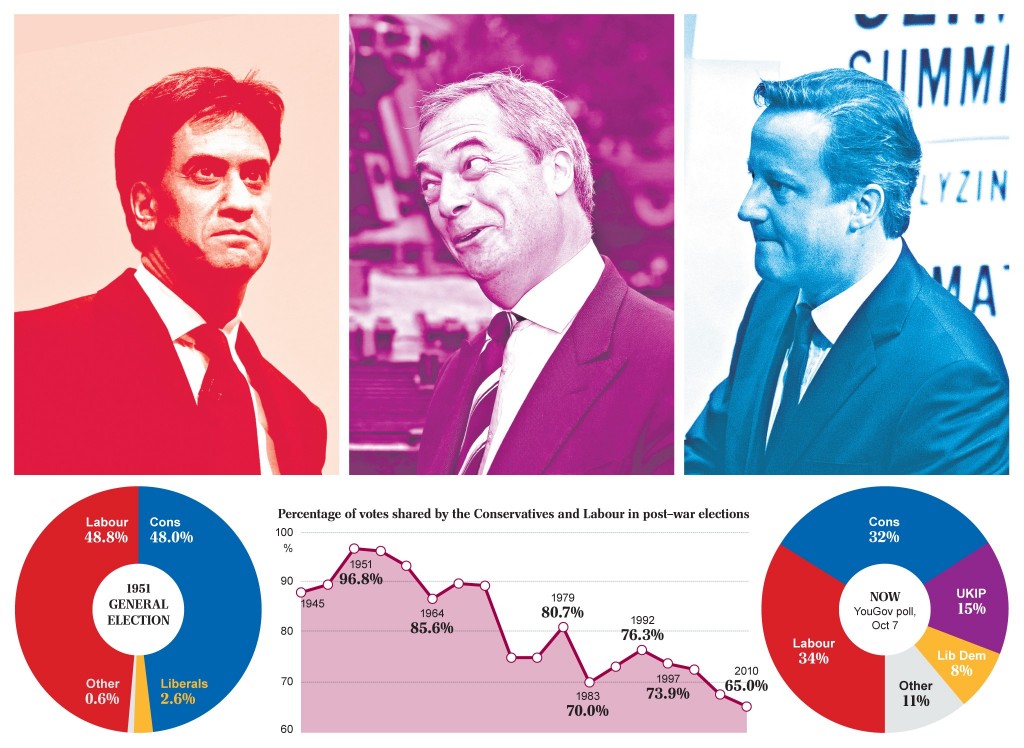
Anyway, one of the drivers of the results was the fact that British voters are no longer consistently voting for either the Tories or Labour. The Telegraph used a nice graphic to show just how far the British two-party system has declined from its peak in 1951. The piece is not very fancy, but it does the trick.

Tory–Labour vote share since 1951

Credit for the piece goes to the Telegraph’s graphics department.

How Africa Tweets

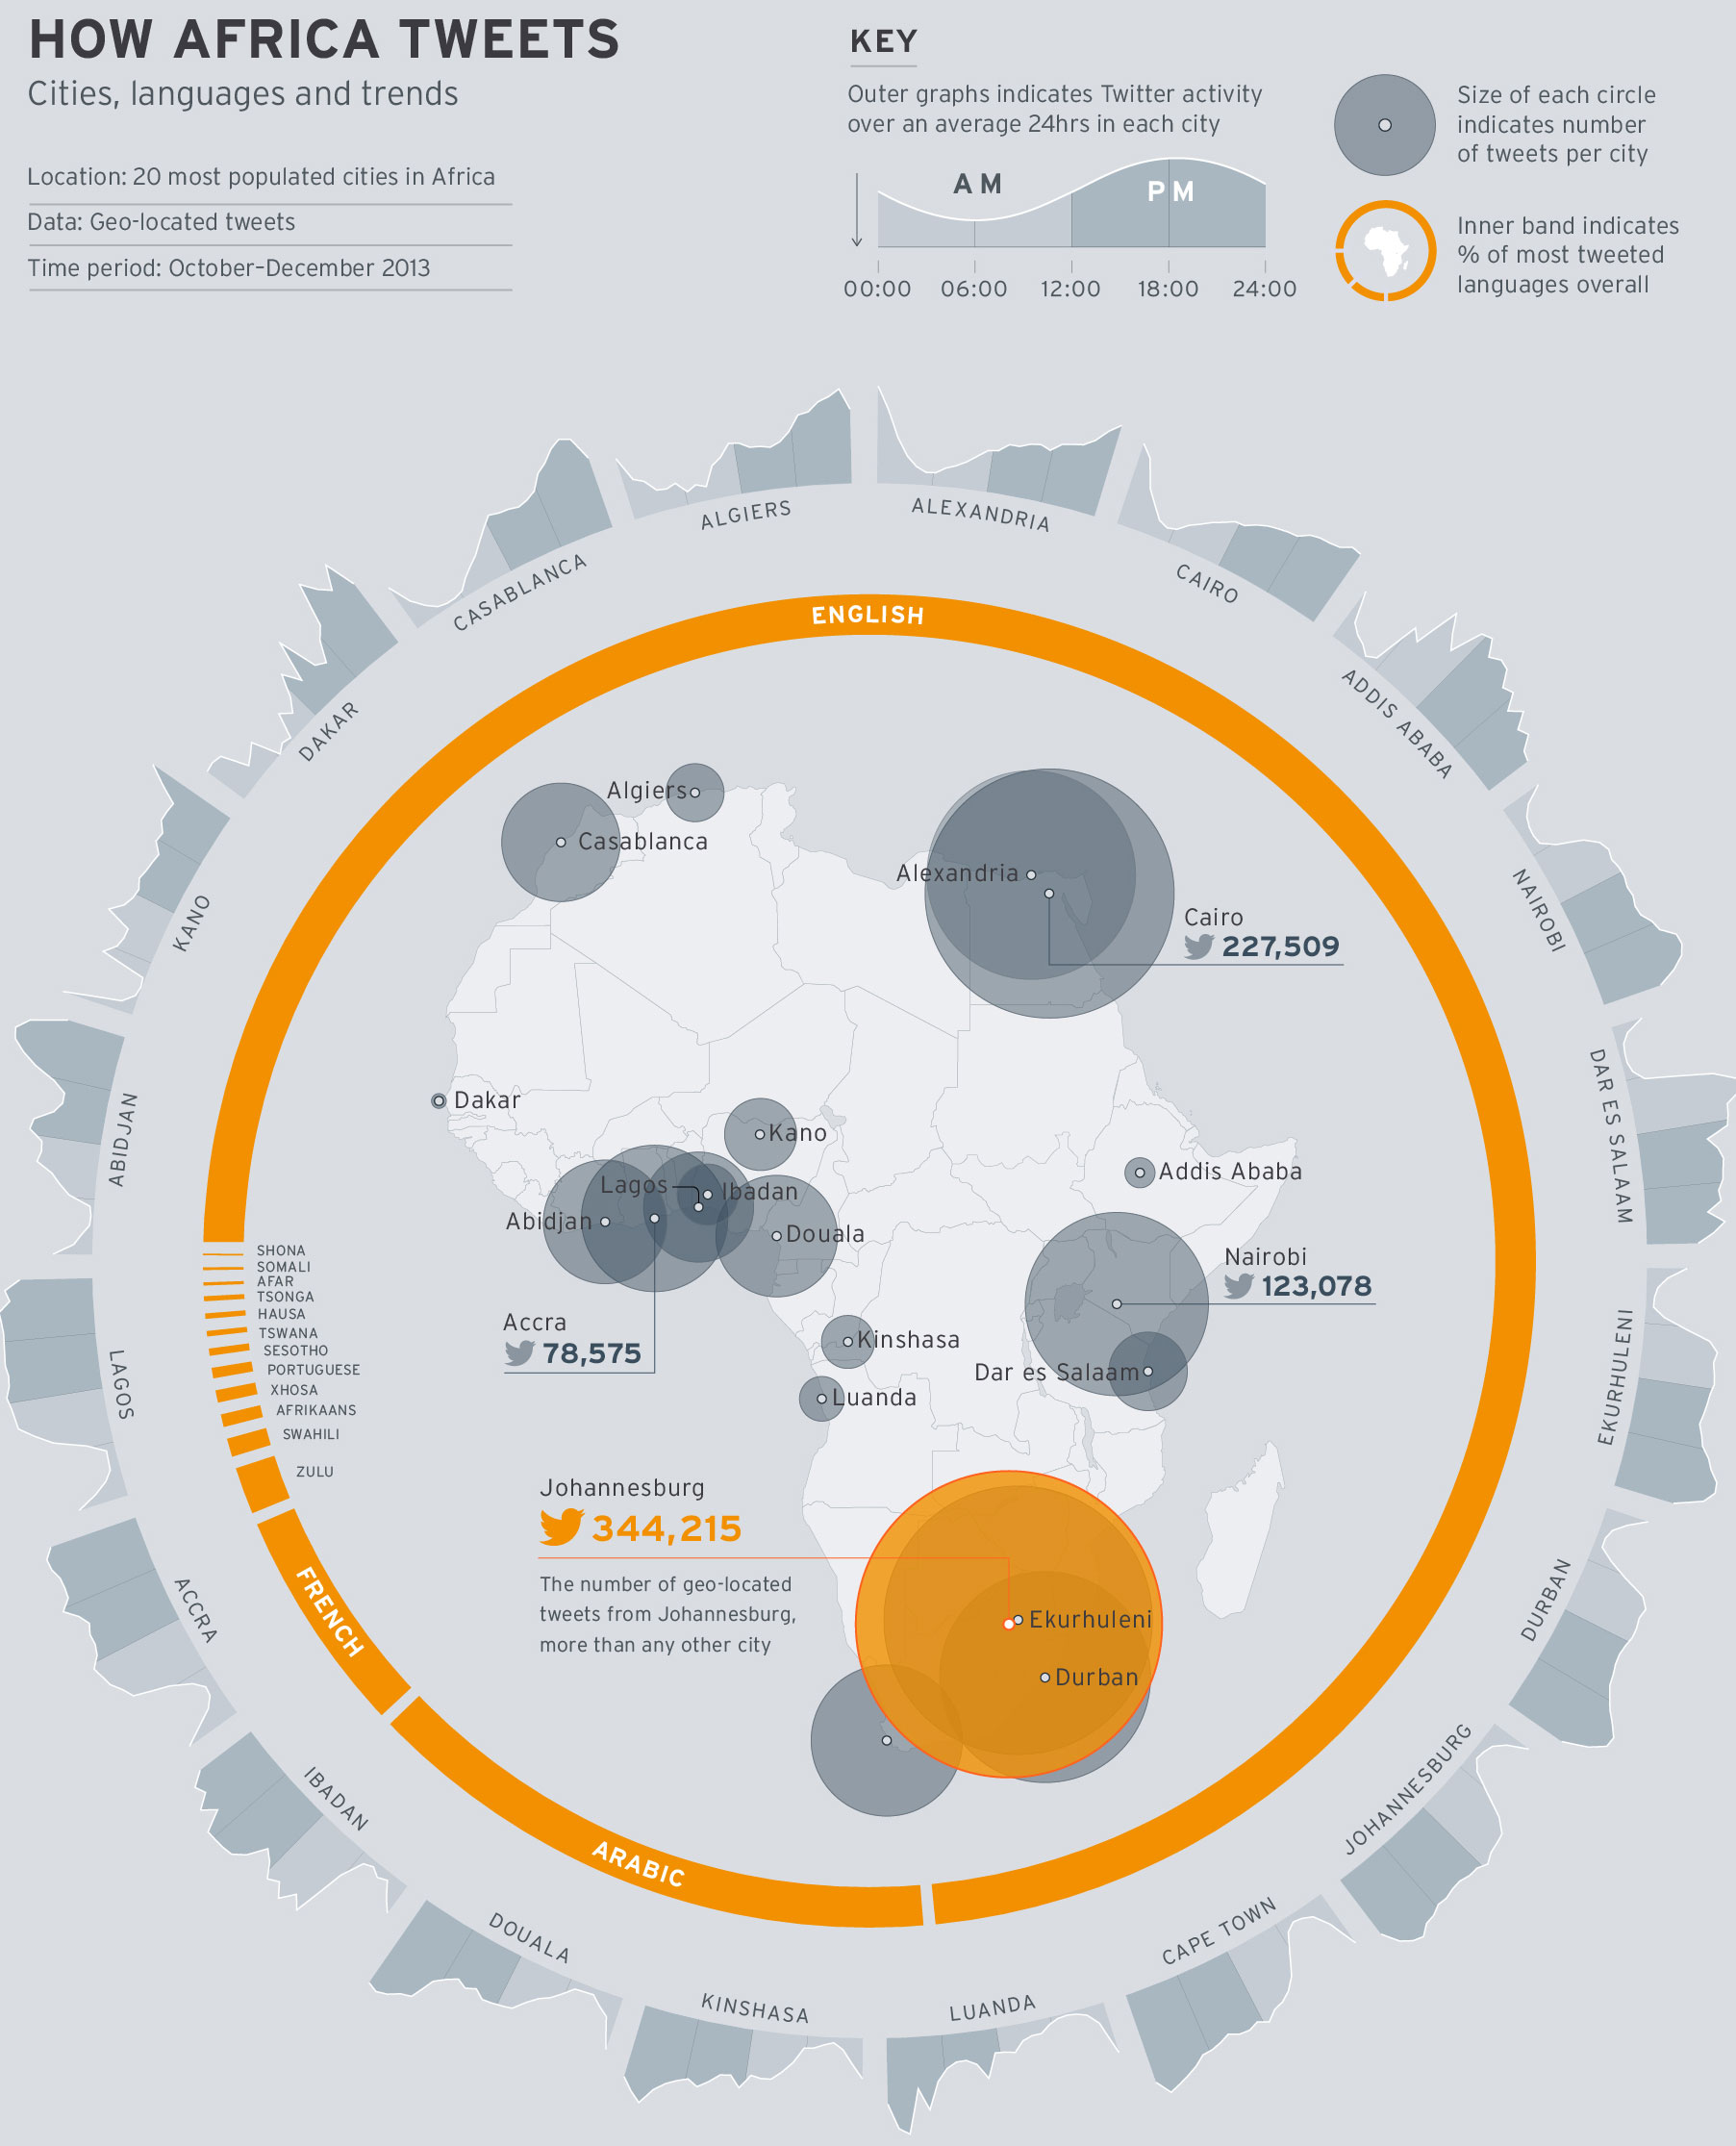
Today’s piece is hit and miss. It comes from the World Economic Forum and the subject matter is the use of Twitter across Africa. I think the subject matter is interesting; mobile communication technology is changing Africa drastically. The regional trends shown in the map at the core of the piece are also fascinating. Naturally I am left wondering about why certain countries. Does spending on infrastructure, GDP per capita, disposable income levels have any sort of correlation if even only on a national and not city level?

How Africa tweets
How Africa tweets

But what really irks me is the content that wraps around the map. First the donut chart, I think my objections to donuts—at least the non-edible kind—are well known. In this case, I would add—or sprinkle on—that the white gaps between the languages are unnecessary and potentially misleading.

Secondly, the cities are eventually displayed upside down. Thankfully the labels are reversed so that city names are legible. However, the continually changing angle of the chart makes it difficult to compare Douala to Luanda to Alexandria. A neatly organised matrix of small multiples would make the data far clearer to read.

In short, I feel this piece is a good step in the right direction. However, it could do with a few more drafts and revisions.

Credit for the piece goes to Allan Kamau.

Follow the (Canadian Foreign Aid) Money

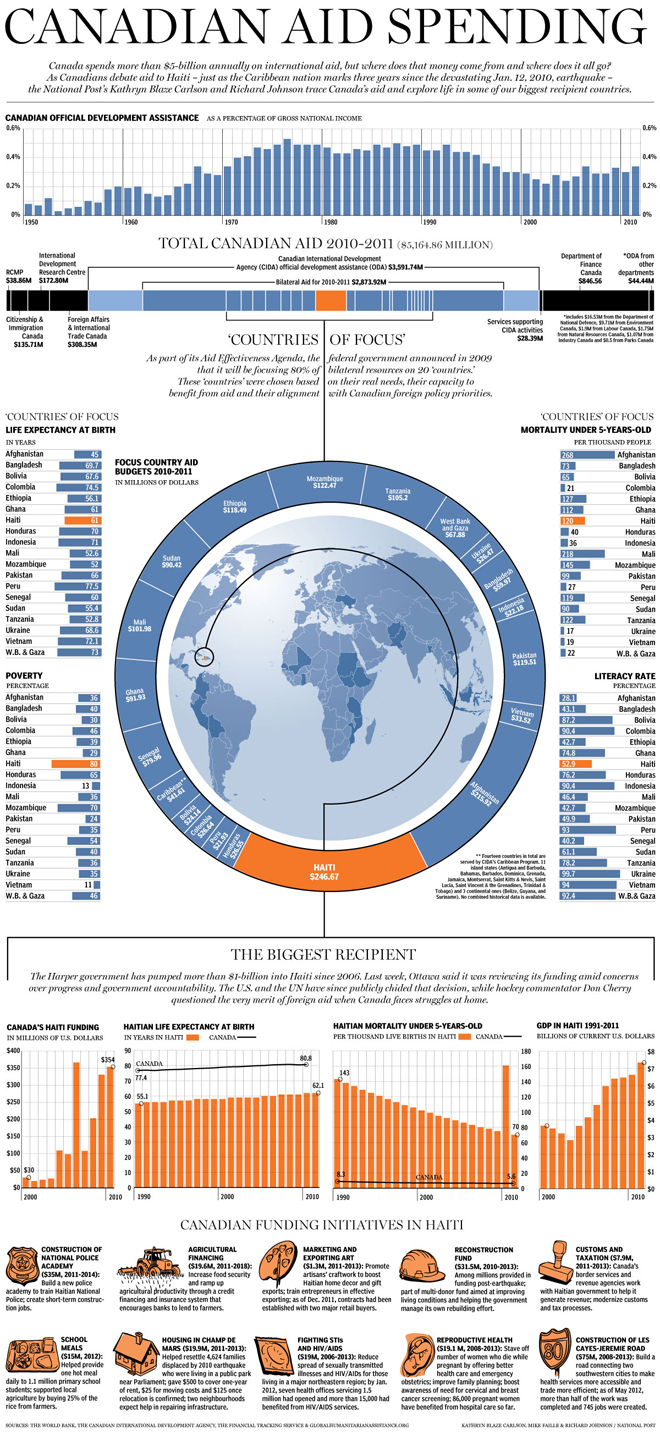
Canada spends quite a bit of money on foreign aid. Last week a National Post infographic looked at the targets for that aid program and in particular highlighted Haiti, a country that has received large sums after the devastating earthquake three years ago.

Canadian foreign aid

Credit for the piece goes to Kathryn Blaze Carlson, Mike Faille, and Richard Johnson.