Last week we saw some positive trends with respect to new Covid-19 cases in the Pennsylvania, New Jersey, Delaware, Virginia, and Illinois area. What did we see this week? Curiously, we saw stagnating figures and, in some instances, slight reversals.
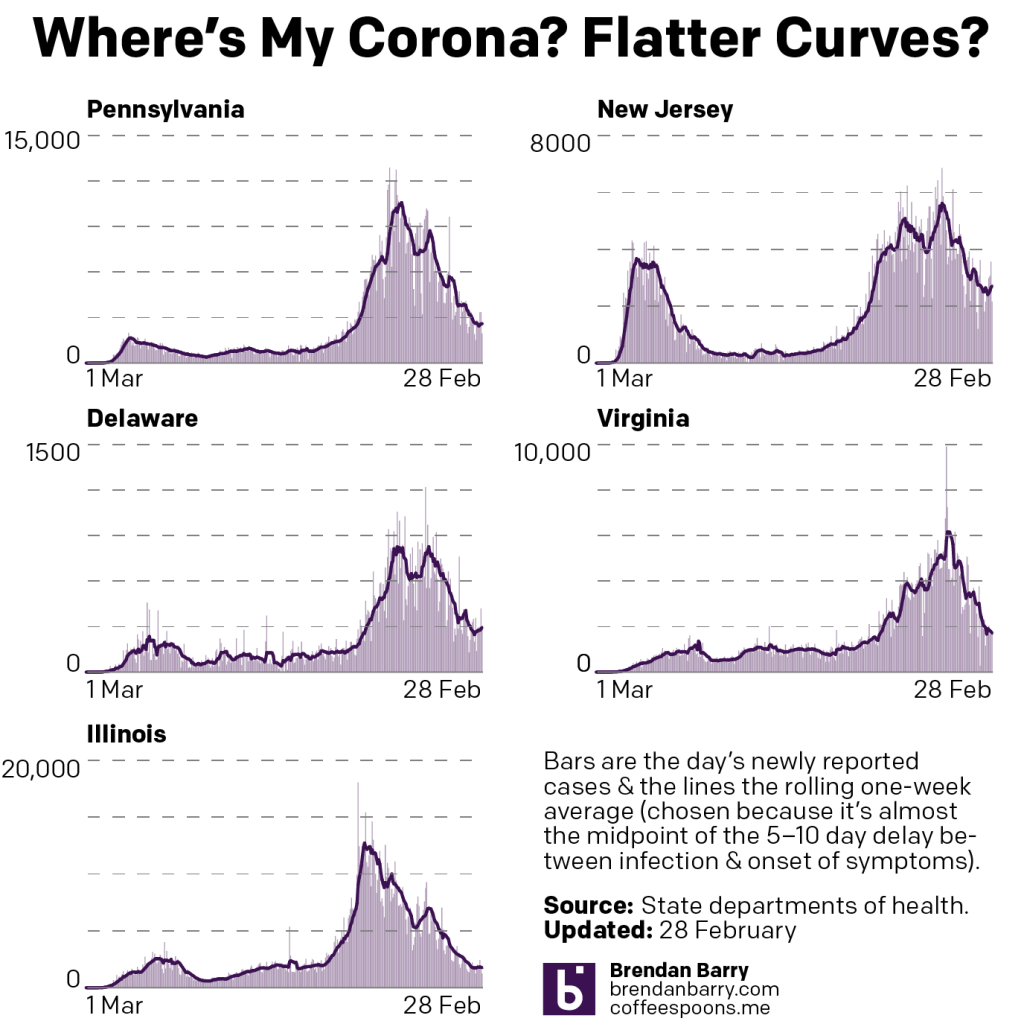
This stagnation can be seen by the small flattenings at the end of the lines for Pennsylvania, Illinois, and Virginia. And if you look at Delaware and New Jersey, you can see the reversals as little upward hooks.
I do not think this means we will be returning to the levels we saw earlier this winter. In fact, if you look a little ways back in Delaware and a bit further back in both Pennsylvania and Illinois you can see a similar pattern. Slight reversals appear as jagged little outcrops on the slope. New cases do indeed climb for a week or so—probably isolated to specific geographies within those states tied to outbreak clusters, but that’s pure speculation on my part.
These reversals, therefore, are something we should pay attention to this week when the weekday data resumes on Tuesday. But I am not worrying about this breaking the overall trend of falling numbers of new cases.
Deaths, on the other hand, while still a bit mixed, are broadly positive. Last week we were in a similar position as we are with new cases this week. In particular, we were looking at increasing numbers in both Delaware and Virginia while the other three states saw slowly falling numbers.
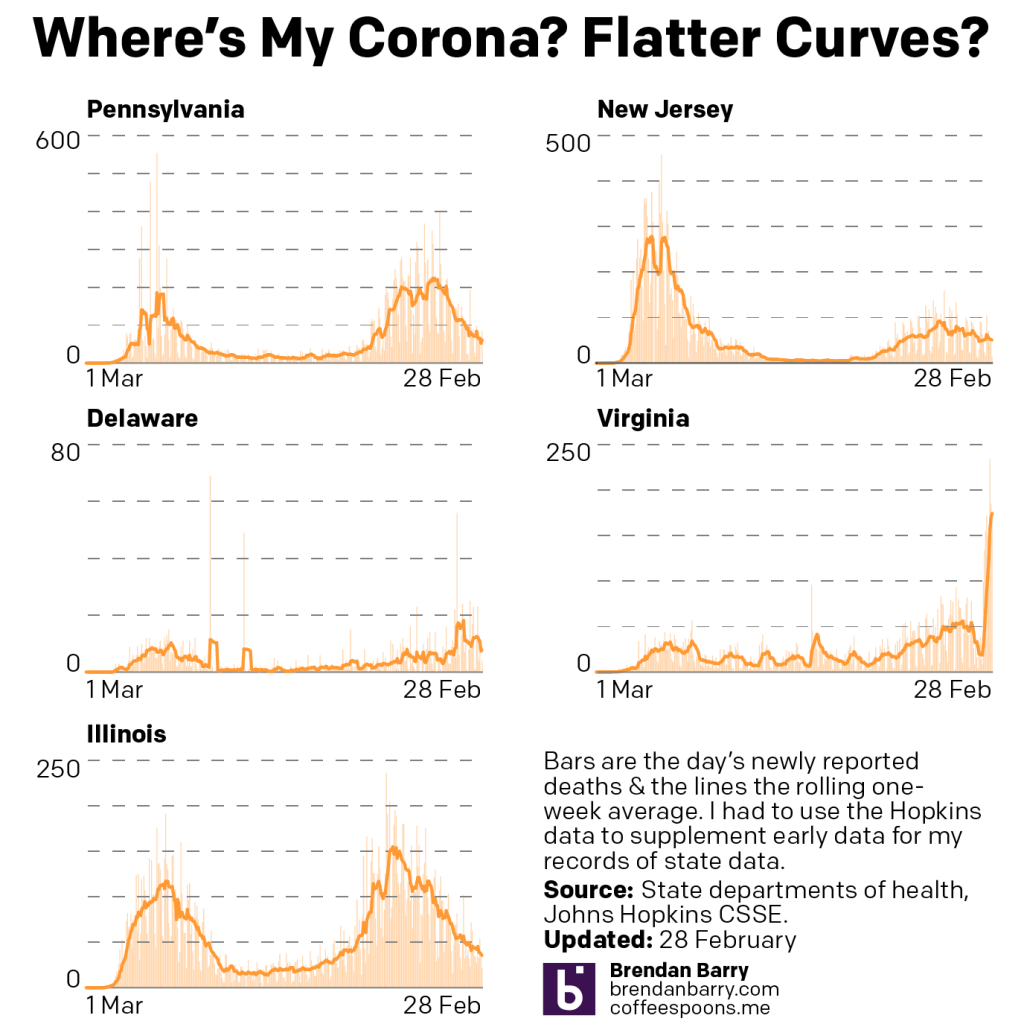
In Delaware we have the numbers down a bit, but the longer term trend remains generally up. I will be watching this closely this week. Virginia, however, is an easier, but maybe better explanation? During the course of this past week, Virginia stated that it’s processing death certificates from the post-holiday surge in deaths.
This means the state under-reported deaths earlier this year and so that the curve should have actually been significantly higher. But the positive news in that is that the deaths we are seeing now happened in the past so that deaths today are far lower than are being reported.
And with vaccinations we continue to have good news. The lines below are clearly off the baseline now as the three states we track move towards 10% fully vaccinated.
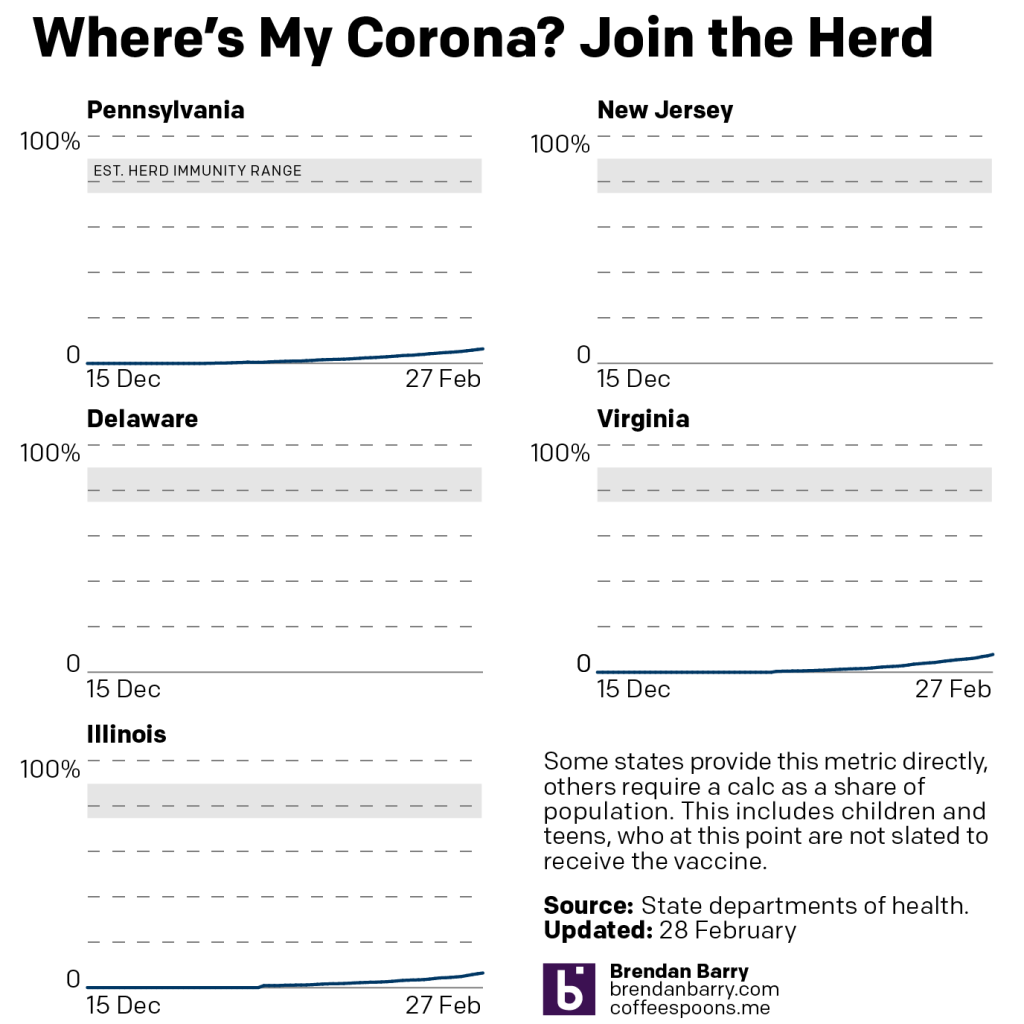
It’s not all perfect, as the rate in Pennsylvania appears to have slowed slightly. This after vaccine administrators mistakenly used second doses for first doses. Now the state has to play catch-up.
But in Virginia and Illinois, we continue to see increasing rates. You can see this as the curve is beginning to gradually slope more and more upward instead of the shallow angle we saw for the last few weeks.
Like with new cases, which, while positive, still have a ways to go before we get to summer-like levels that would allow us to head out and socialise, vaccinations have a long way to go.
And importantly, just because someone is vaccinated doesn’t mean society should reopen just for those lucky to get their doses early. We need to wait—or should wait—for higher levels of vaccination before reopening.
Credit for the piece is mine.
Leave a Reply
You must be logged in to post a comment.