Another week, another snowstorm in the Northeast. This winter has been far busier than last, when Philadelphia saw no snow. Unfortunately, whilst people like me enjoy seeing the snow, it’s hampering with testing and vaccination.
Last week we saw some middling signs of improvement, but perhaps partially exaggerated by the closures caused by the storm. When we look back at the last week, despite the impact of a storm later in the week, it’s been a categorically positive week with respect to new cases.
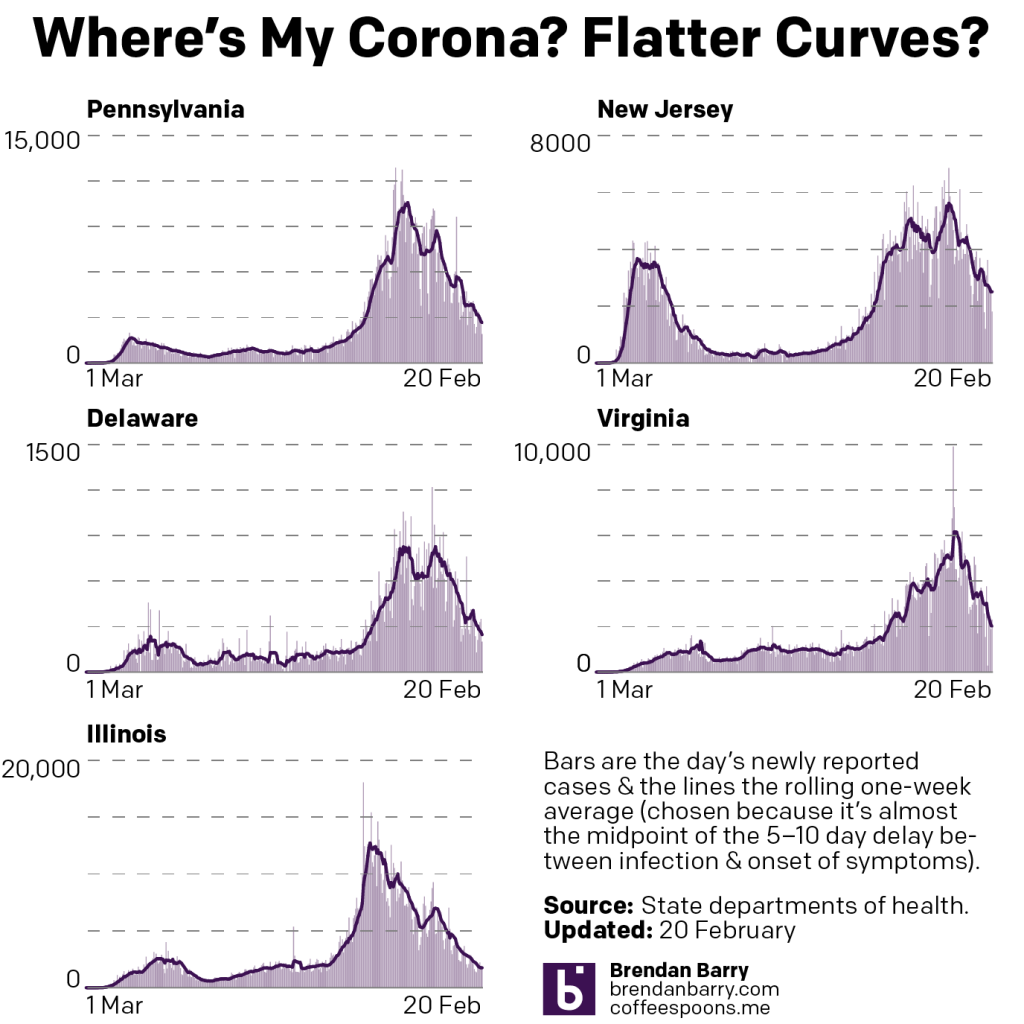
After the plateaus of the week before, most notably in the straight line in Pennsylvania, this week we saw the line for the seven-day average resume a sharp trajectory down. That isn’t to say we are seeing a slowdown in that reduction of new cases. Illinois best fits that, but we can see slight flattening of the downward curve also in Delaware and New Jersey. In Illinois’ case, that is still welcome as the state approaches early autumn levels of new case rates. In the remaining states, we still have a little ways to go before we reach those levels.
Deaths, on the other hand, remain a mixed bag of results. Last week we talked about a much improved picture from the week before with Delaware and Virginia in particular exhibiting significantly decreased rates.
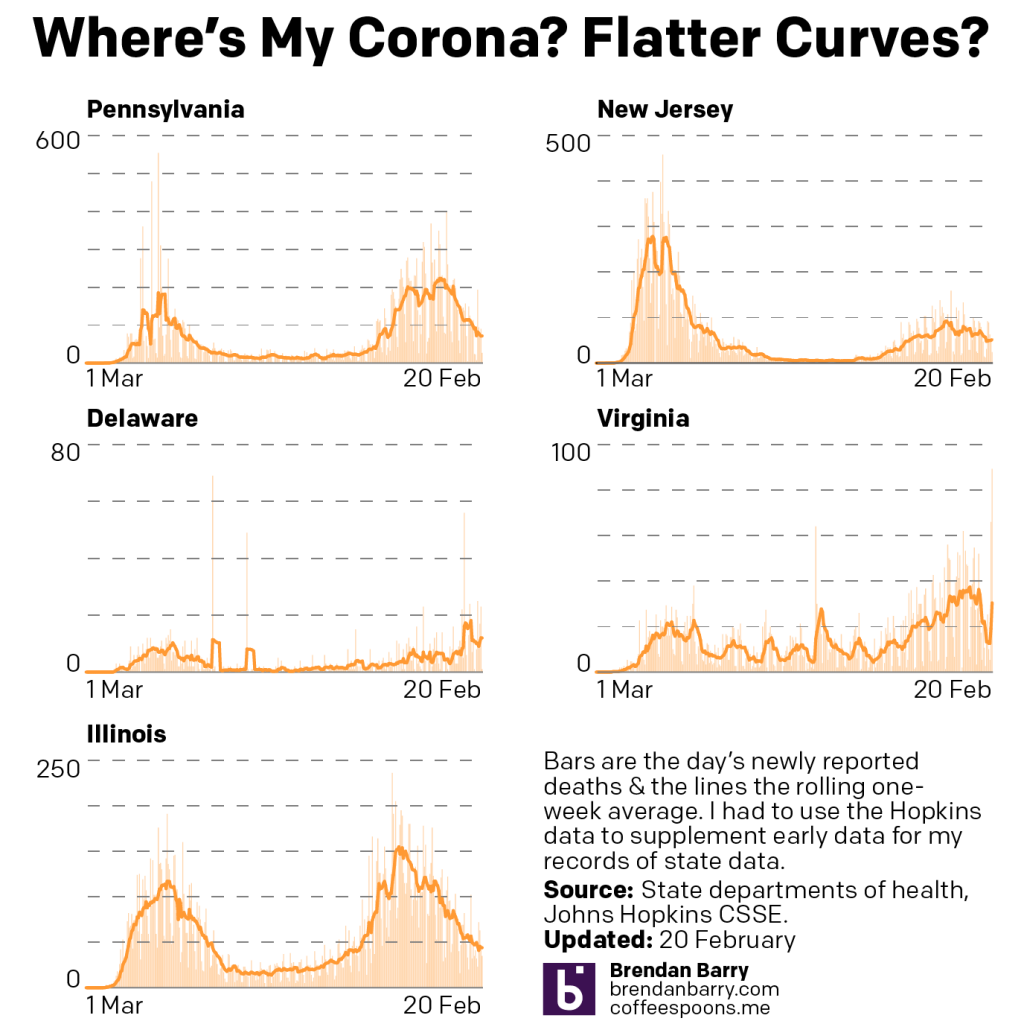
This week we saw some reversal of fortune in those two same states. In Delaware, the numbers of deaths have ticked back upwards and the seven-day average has made up about a third of the gains we saw. In Virginia, the upward swing can be largely—though not entirely—attributed to a one-day spike in numbers.
Whilst the other three states continued to see gradual improvements, the question over the coming week will be what trends emerge within Delaware and Virginia. Do the deaths increase and the situation worsen? Or will the increases prove a temporary aberration followed by a return to decreasing numbers of new deaths.
Finally with vaccines
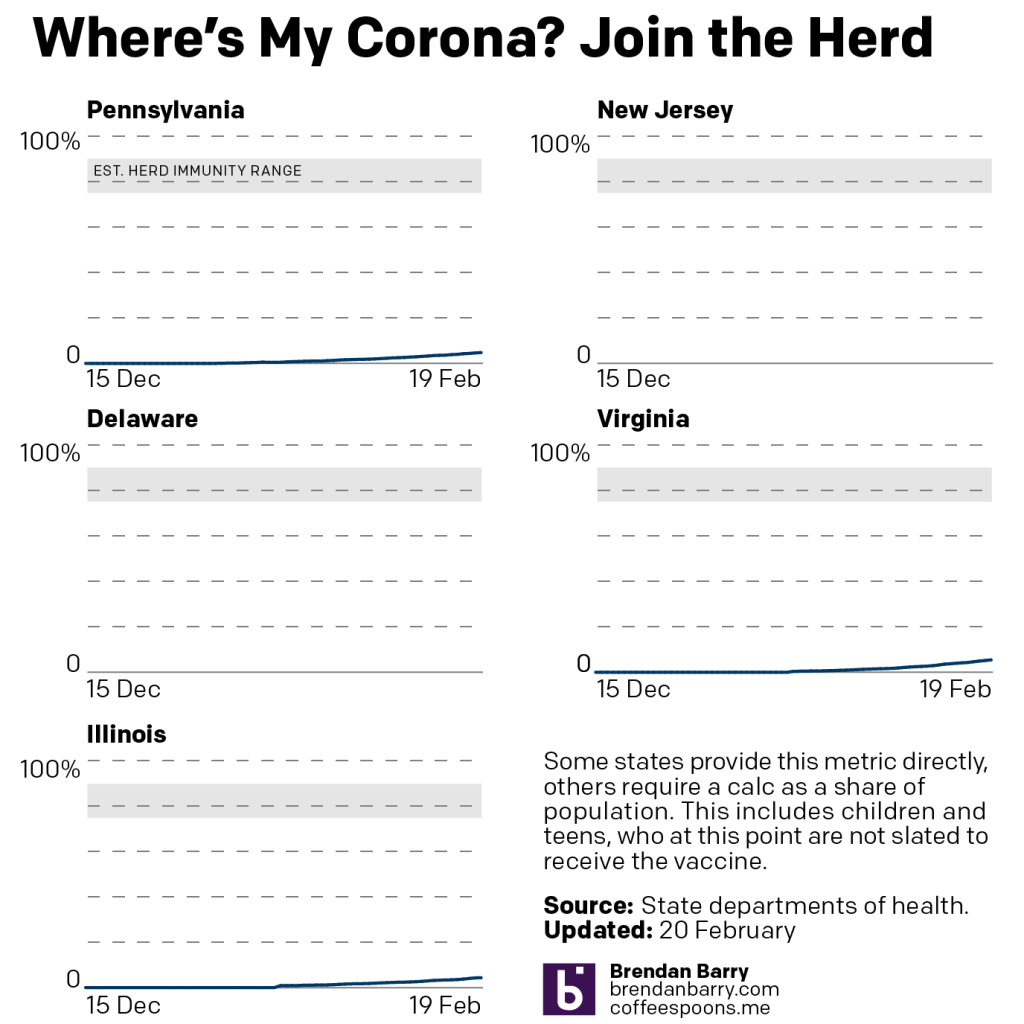
The story to follow in Pennsylvania will be how distribution sites mistakenly administered second doses as first. 60,000 people awaiting their second dose will now have to wait—though still within the recommended window—for their second dose whilst 50,000 people will now have to wait for their first dose.
Otherwise, we continue to see an uptick in vaccinations. Last week we saw states make significant gains in their fully vaccinated populations. Virginia had passed 4% and Pennsylvania was about to hit the same milestone. This week begins with Virginia at nearly 5.5% and Pennsylvania almost at 5%, sitting on 4.77%. We need to keep in mind that this excludes any new vaccinations from the city, which doesn’t report vaccination data at the weekend. Illinois is now the lagging state at 4.29%.
Credit for the piece is mine.
Leave a Reply
You must be logged in to post a comment.