In last week’s update we looked at how in Pennsylvania, New Jersey, Delaware, Virginia, and Illinois the numbers of new cases of Covid-19 were trending in the wrong direction. This past week they continued to do much the same.
This week I want to begin with New Jersey, because last week I noted how the growth in the number of new cases was holding steady. In other words, the number of new cases, whilst growing, was growing by roughly the same number of cases each day. We contrasted that with the other four states where we witnessed increasing numbers of new cases each day.
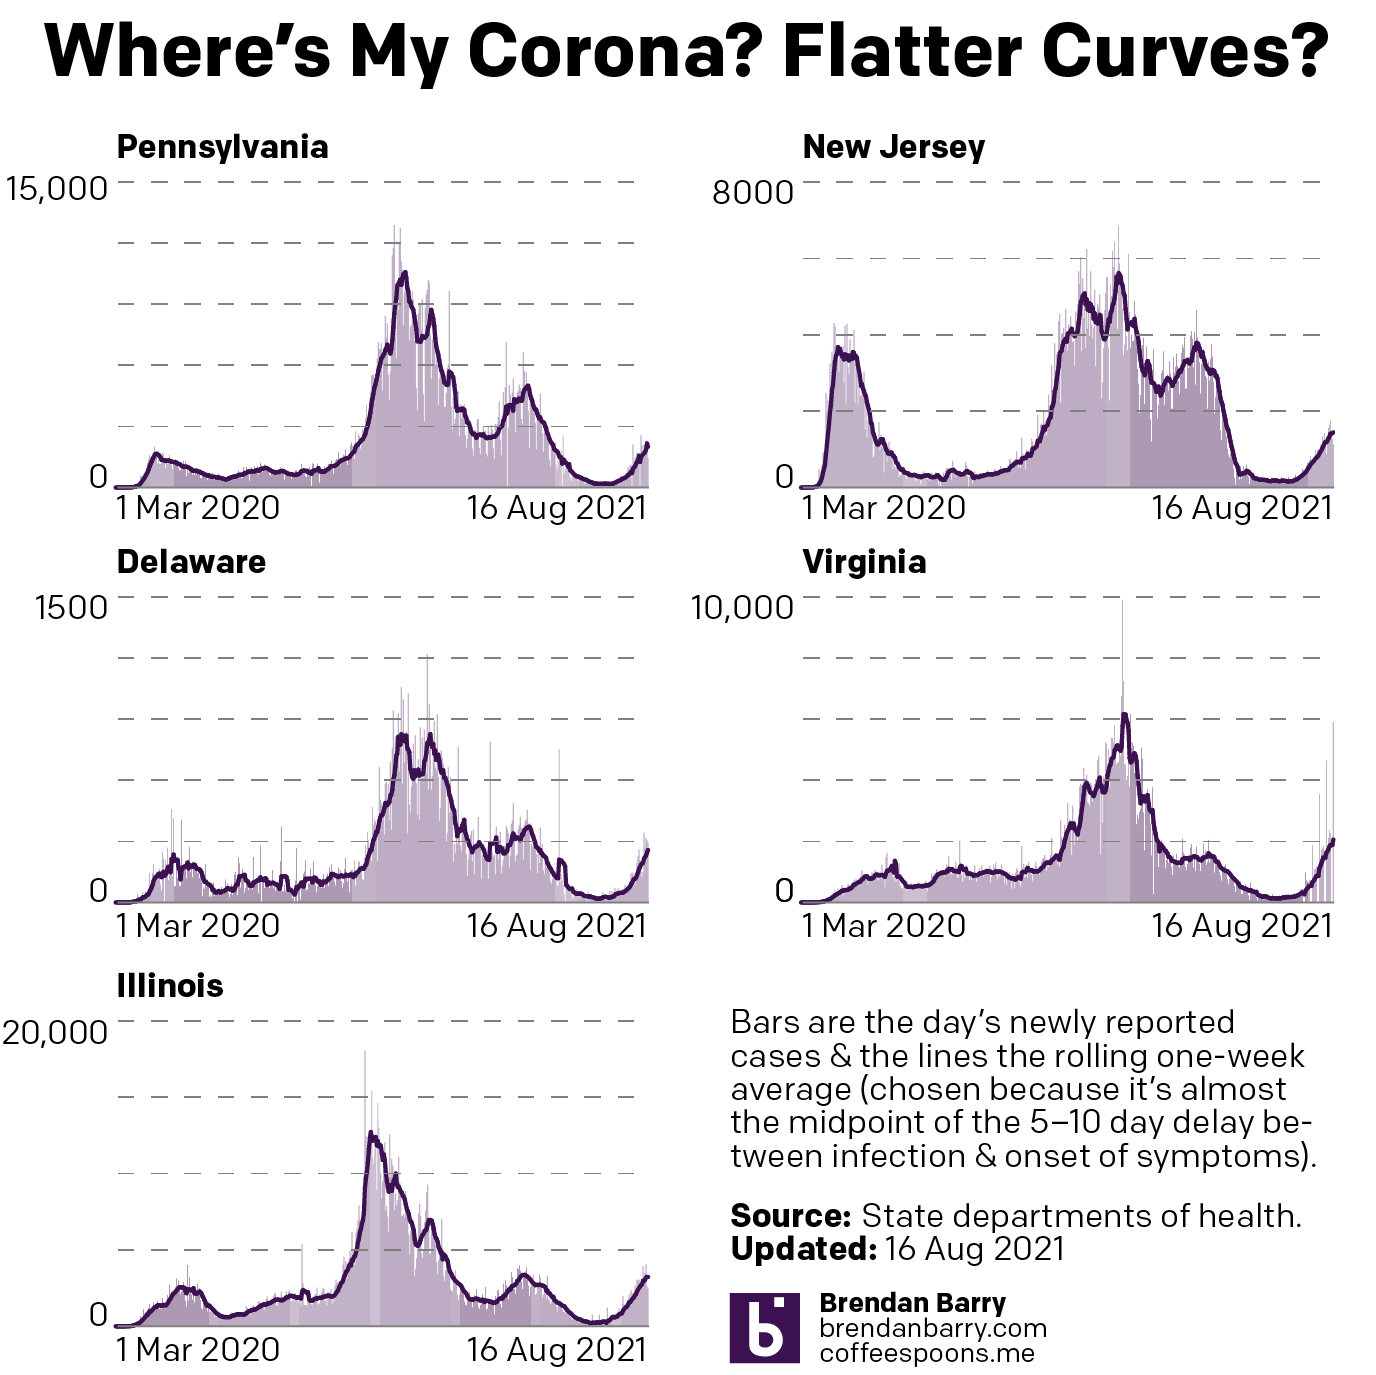
New Jersey’s continued to see similar growth, fairly flat, though it has increased ever so slightly. And in the other states we continue to see increasing numbers of new cases, but that accelerating growth may be tailing off. That doesn’t mean we are seeing new cases decline—far from it. Instead we are seeing the number of new cases become slightly smaller each day. And if you look ever so closely at the tails of each chart above, you can see how the slope of the line, the seven-day average, is no longer bending upward but is straightening out to a line instead of a curve or, in some cases, maybe even beginning to flatten out as one does as one would approach a peak.
This doesn’t mean we are at the point of seeing this fourth wave peak, but the first indication of such a thing happening would be a slowdown in the numbers of new cases. And so moving forward over the next two weeks or so, we’ll want to see if that continues.
In absolute terms, I mentioned last week that I wouldn’t be surprised if Illinois surpassed its springtime seven-day average peak of 3390 new cases per day. Fortunately, we haven’t yet hit that milestone. We are, however, just under 200 new cases per day away from that. This can speak to that slight slowdown in the numbers of new cases.
We also looked at how in the tri-state area all three states were well below their springtime peaks. That continues to be the case. However, Delaware is nearing that peak.
When we look at deaths, we also see very much the same story as last week.
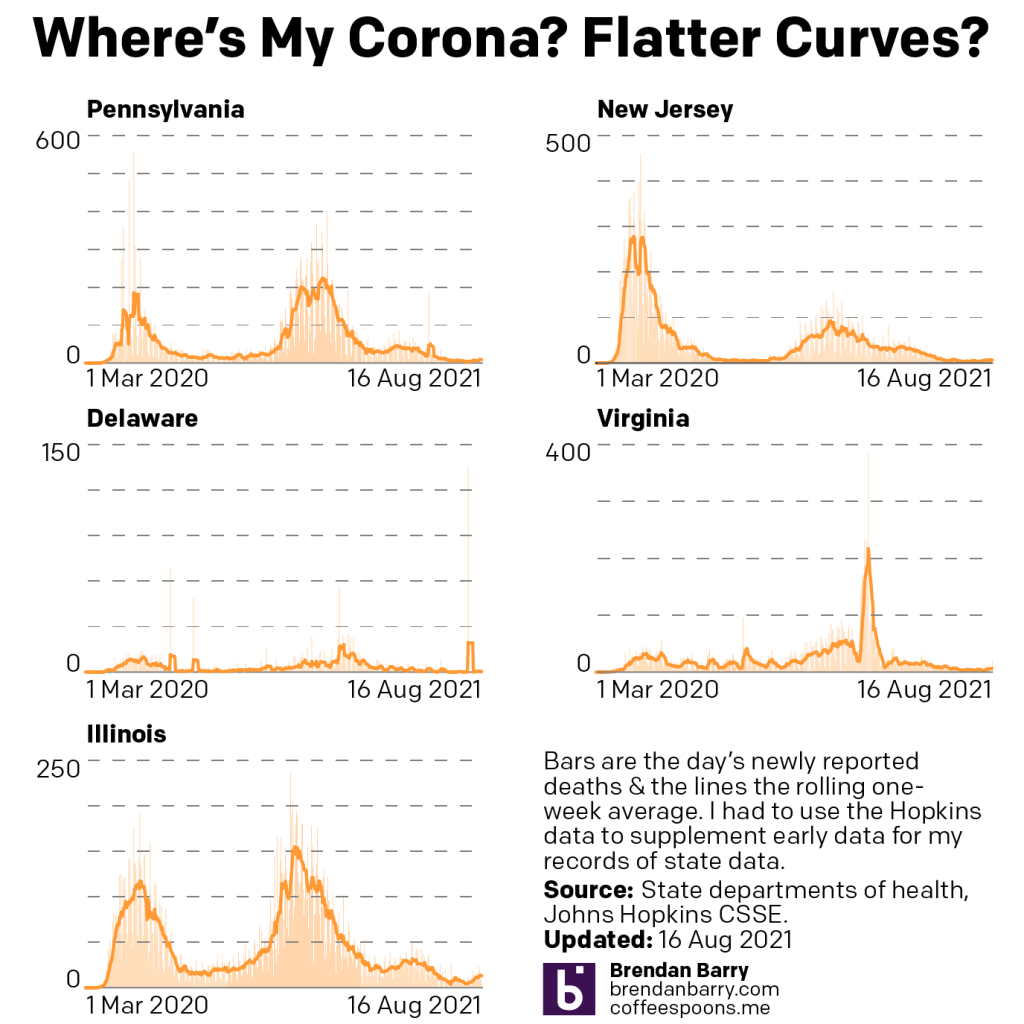
Delaware continues to be the exception where we saw deaths climb by just one. But when we look at the other four states, the concern last week was Illinois where we saw a significant jump in the rate. Fortunately that has slowed down over the past week and deaths climbed from 12 per day to just 13 per day. Similarly, the rate in Pennsylvania and Virginia has also slowed down slightly with 9 and 7 people dying each day in those states, respectively.
The good news is in New Jersey. There the death rate has slowed so much so that the average hasn’t changed. Last week it was 6 per day. As of yesterday’s data update, it’s still sitting on 6.
And we need to mention again that these deaths and the hospitalisations that we don’t track are almost all happening solely in the unvaccinated population. If you haven’t been vaccinated yet, you really need to. Because these vaccines have been proven safe; they’ve been proven effective; and they’re free if you’re worried about cost.
Credit for the piece is mine.
Leave a Reply
You must be logged in to post a comment.