Joshua Katz from North Carolina State University has created an interactive version of the dialect survey maps first perhaps popularised several years ago. Katz has also created an interactive map that looks at a city’s dialect and maps its areas of similarity and difference. An interesting extension of the original survey data, however, is the ability to take the survey yourself and see where your dialect fits. There are two versions, a 25-question survey and a 140-question survey.
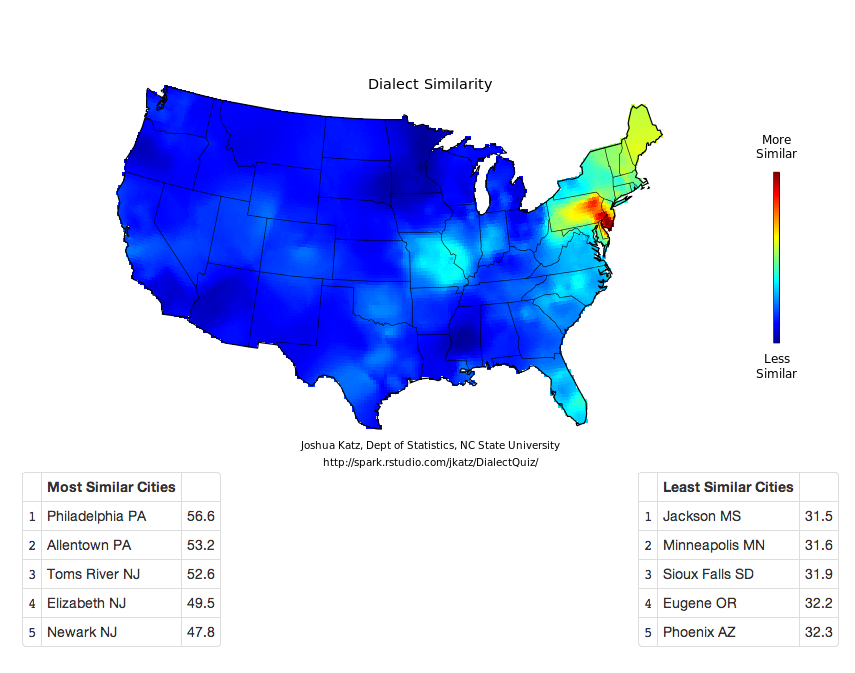
The screenshot below is my result from the 25-question version. And it fits me fairly well since I spent most of my years in the suburbs of Philadelphia but every summer in South Jersey (and quite a bit of time in Allentown). Click the map to take the quiz for yourself. Feel free to reply and share your results.
From the technical side, for those wondering, this is a piece that is done in Shiny, the interactive version of R.
Credit for the piece goes to Joshua Katz.
Leave a Reply
You must be logged in to post a comment.