To X or Not to X

As it happens, the Latino culture largely remains x’ed out on using the term Latinx, according to a new survey from Pew Research.

The issue of supplanting Latino/Latina with Latinx as a gender neutral replacement—or as a complementary alternative—emerged in the general discourse in that oh-so-fun year of 2020 when everything went well.

One common argument I have heard is the inherent gender within the Spanish language. Broadly you use -o for singular masculine endings and -a for singular feminine forms and -os for plural masculine and mixed gender forms and -as for plural feminine forms.

Perhaps my biggest issue is that -x does not linguistically make sense. X is typically pronounced like a j or sometimes an s. Consider how Mexicans pronounce Mexico, May-hie-co. Latinx becomes La-teen-h, an almost silent ending that does not fit, at least to my ears. Pero, hablo solo un pocito Español. Aprendí a hablar por cuatro años en la escuela, dos años de niño, y trabaja en una cocina del restaurante. Thus Latinx, pronounced Lat-in-ecks, always seemed, daresay, a gringo solution to a problem that earlier polling of Latino communities did not indicate was a problem. With the potential exception of the young, but even then not terribly so.

Four years later, however, and not much has changed according to Pew. Their graphic shows as much.

Significantly more people are aware of Latinx as a term. Fewer people use the term, though not significantly. Although a shift from four to three percent can be seen as significant given its low adoption. Moreover, as a second graphic shows, more people who are aware of the term think it should not be used.

The article continues with a discussion of a new new alternative, Latine, which to my ears makes more sense. But is largely yet unheard of in the community—20%—and of those who have heard it, almost nobody uses it.

As far as the graphics go, I am not a huge fan.

For the first, we have two lines showing the movement between two datapoints. At the most basic level, the use of a line chart makes sense to depict two series moving between two points in time. But without any axis labelling one can only trust the lines begin and end at the correct position. Furthermore people need to read the specific labels to get a sense of the line charts’ magnitude. More of a tell, don’t show approach. If the chart had even a simple 0% line and 50% line, one need not label all four datapoints to convey the scale of the graphic.

Ultimately, though, does a chart with four datapoints even need to be graphed? Some would argue in most instances a dataset with fewer than five or six numbers need not be visualised; a table should suffice. Broadly I agree. This chart does show a particularly striking trend of increasing awareness of the term, but largely static to declining usage.

The second graphic, however, falls more squarely into that argument’s camp of “Why bother?” It shows simply two numbers. Numbers placed atop purple rectangles. Without any axis labelling, we presume these bars represent columns encoding the percent—at least the lines in the first chart were clearer to their meaning. Then we still have the issue of telling and not showing. Perhaps labelling to the left from 0% to 75% or 80% would help. Then you need not even add additional “ink” with the four digits sitting atop the bars and sparkling for unnecessary reader attention.

This falls into a broader trends I have witnessed over the last few years in the information design and data visualisation field of labelling individual datapoints within a chart. It is a trend with which I strongly disagree, but perhaps is best left for another post another day. Suffice it to say, if knowing the precise measurement is important, a chart is not the best form. For that use case I would opt for a table, best used to organise and find specific datapoints.

Overall, Pew shows that within the Latino community, very few use the term Latinx. Consequently, perhaps this entire post is, to use a Spanish-language expression, a tempest in a teapot.

Credit for the piece goes to Pew Research.

British English vs. Irish English

The United Kingdom is known for having a large number of accents in a—compared to the United States—relatively small space. But then you add in Ireland and you have an entirely new level of linguistic diversity. Josh Katz, who several years ago made waves for his work on the differences in the States, completed some work for the New York Times on those differences between the UK and Ireland.
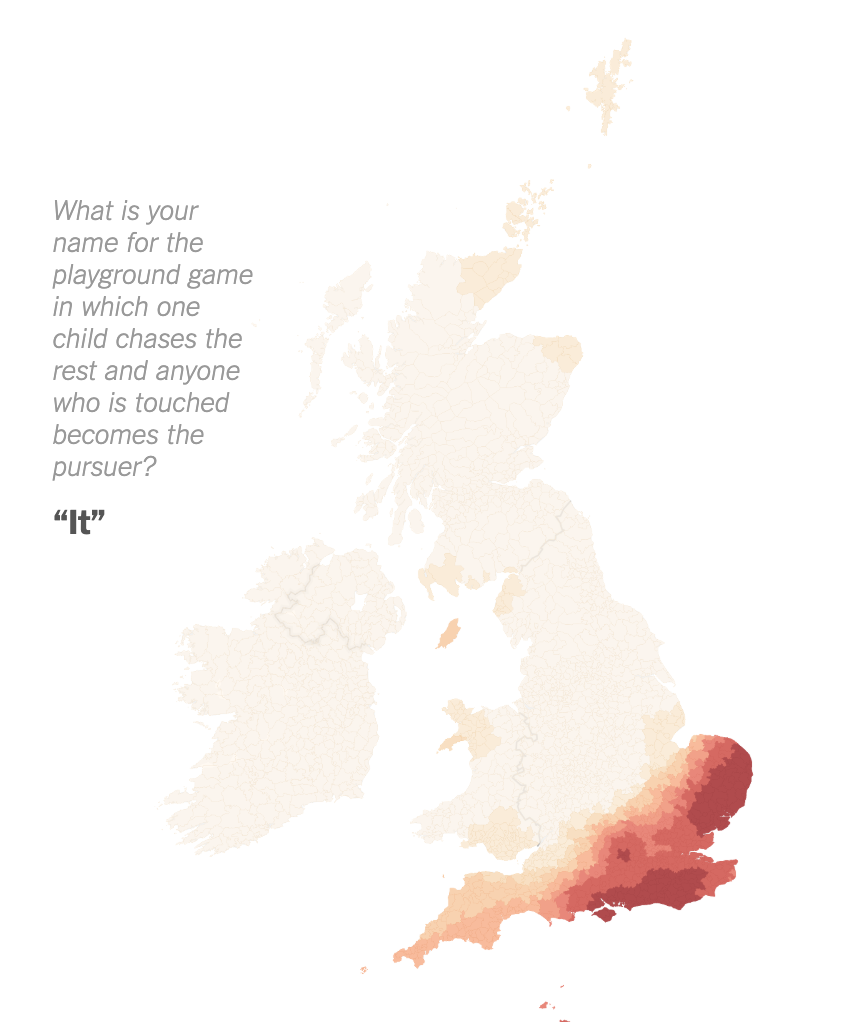
You might know this as tag. At least I do.

Why do I bring it up? Well, your author is going on holiday again, this time back to London. I will be maybe taking some day trips to places outside the capital and maybe I will confirm some of these findings. But if you want, you can take the quiz and see where you fall compared to Katz’s findings.

And it does pretty well. It identified me as being clearly not from the British Isles.
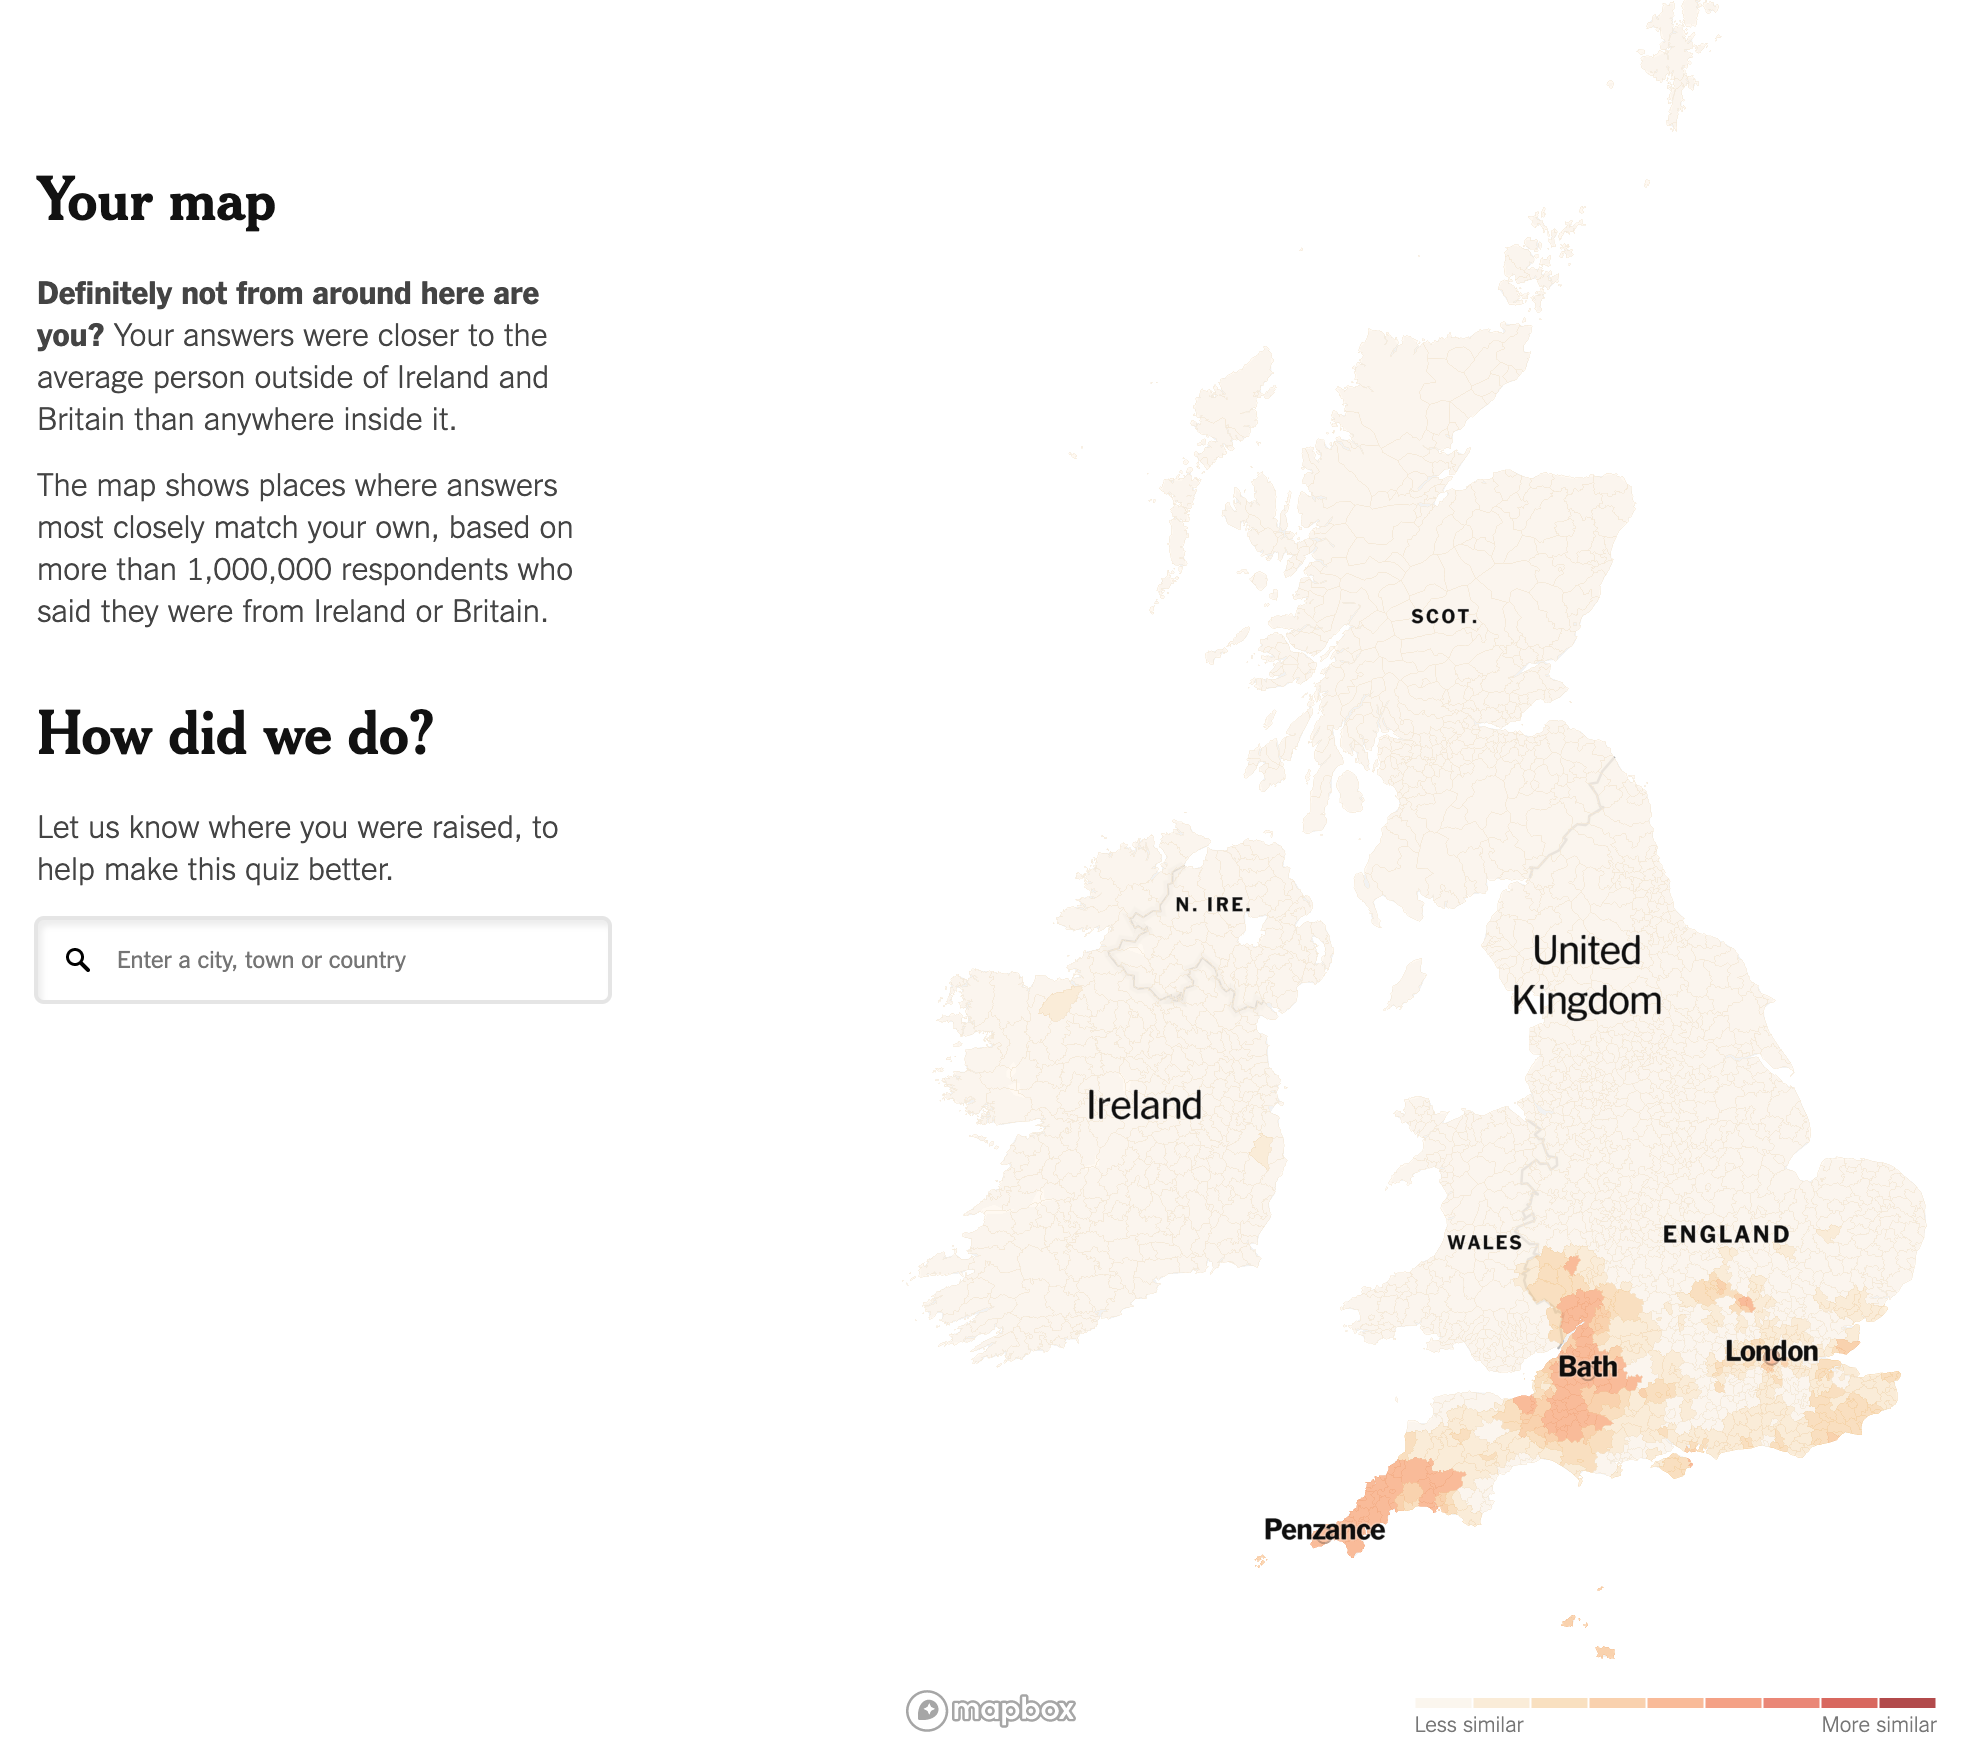
Maybe I'm secretly Cornish?
Maybe I’m secretly Cornish?

But depending upon how you answer a particular question, the article will show you how your answer compares.  Let’s take my answer for scone. In that, I am more Irish.
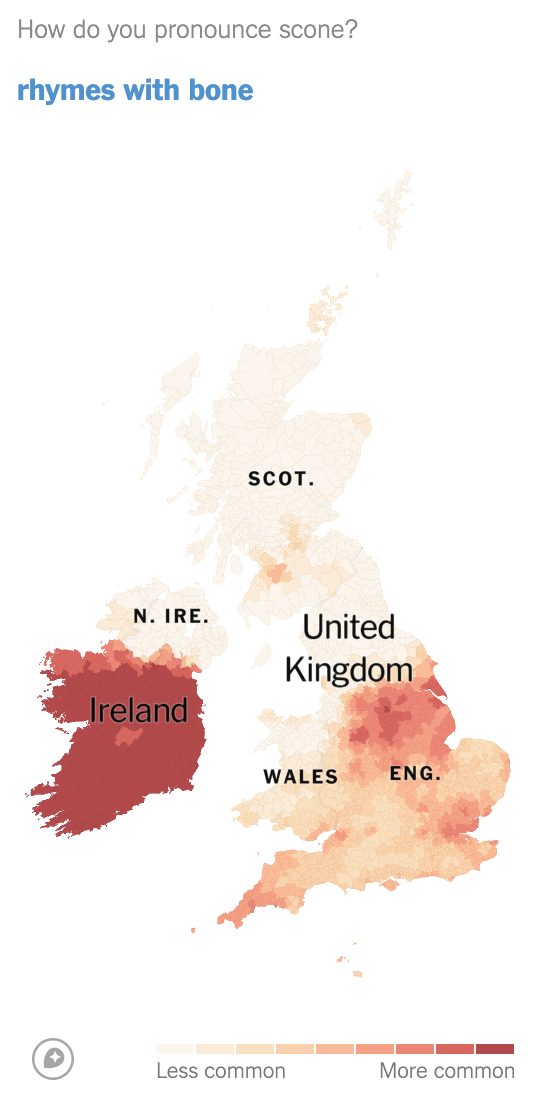
Or you can just call them fantastic and delicious.

Credit for the piece goes to Josh Katz.

Native Languages of the World

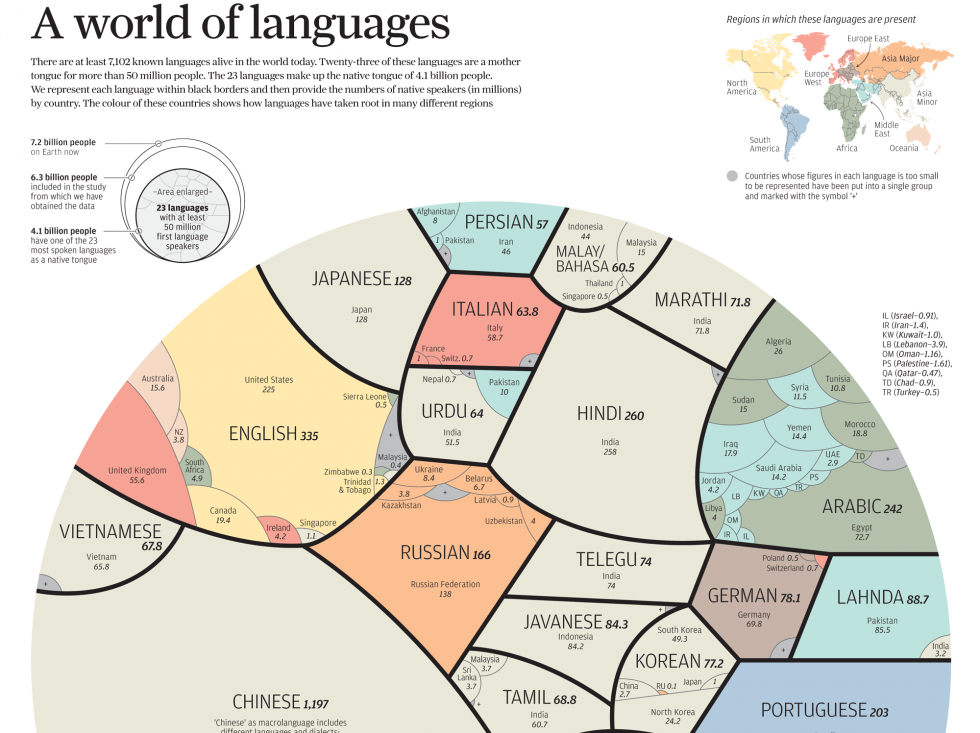
Today’s post looks at an infographic from the South China Morning Post. The graphic in question looks at languages and how many speak them. Specifically, the graphic narrows the focus down to those native languages spoken by 50+ million people, of which there are 23 spoken by a combined 4.1 billion people out of the world’s 7.2 billion inhabitants.

Native language speakers

Credit for the piece goes to Alberto Lucas López.

Looking at Languages

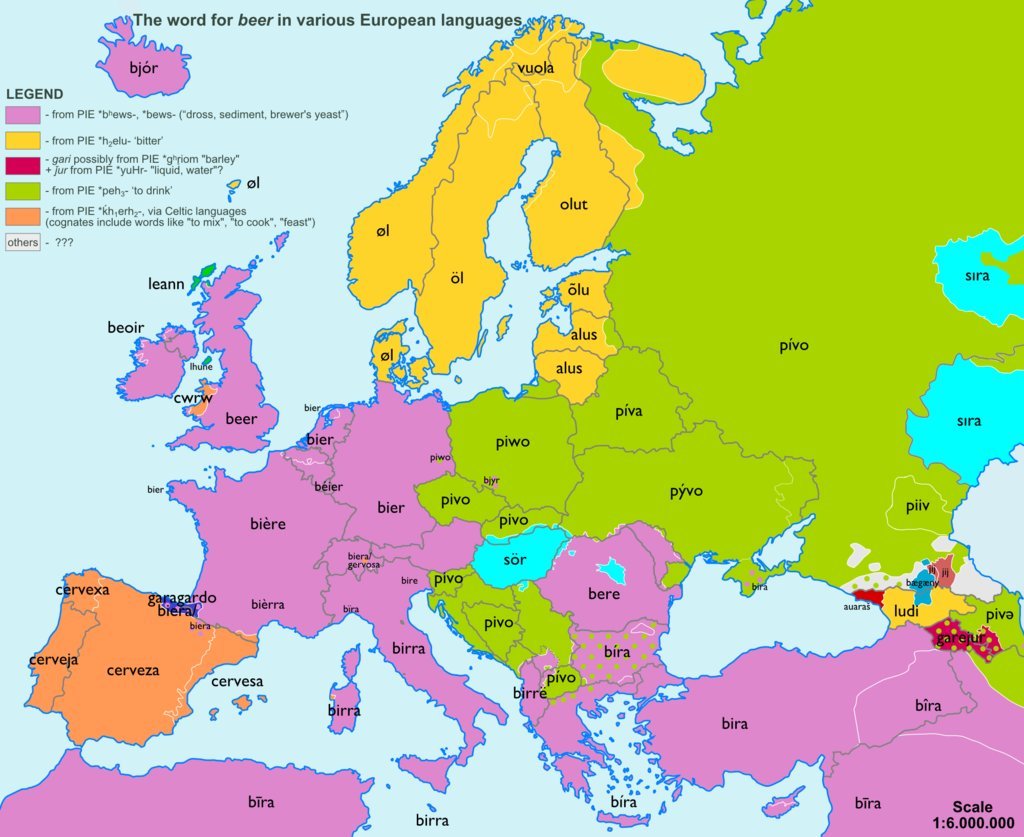
Languages can be fascinating things. And not necessarily just in Klingon. Vox has a post using 23 maps and graphics to look at language. As usual with these sorts of things, some are good. Others not so much.

Old World languages
Old World languages

Credit for the highlighted piece goes to Minna Sundberg via Dylan Matthews.

Twitter Language

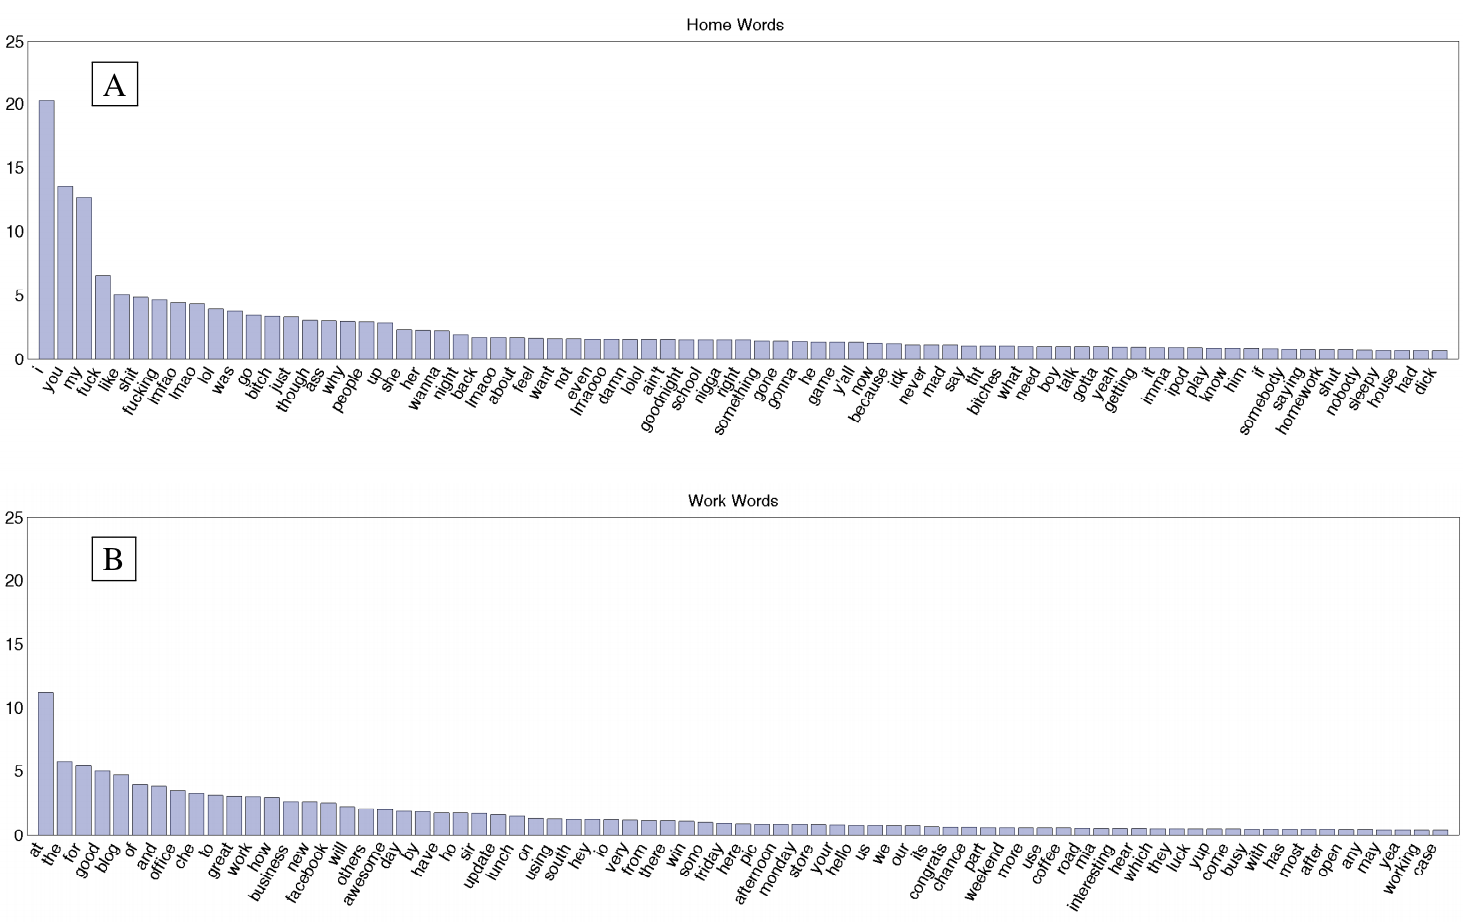
An MIT report looks at, among other things, the words used in tweets based on whether they were tweeted at home or at work. And, well, Malcolm Tucker would be surely disappointed. Because somebody screwed up and switched the words home and work. Clearly they should be reversed.

A rose by any other name is still a f**king rose for f**k's sake, you t**t.
A rose by any other name is still a f**king rose for f**k’s sake, you t**t.

Credit for the piece goes to the report’s authors Morgan R. Frank, Jake Ryland Williams, Lewis Mitchell, James P. Bagrow, Peter Sheridan Dodds, and Christopher M. Danforth.

Linguistics Are…Um…Fun?

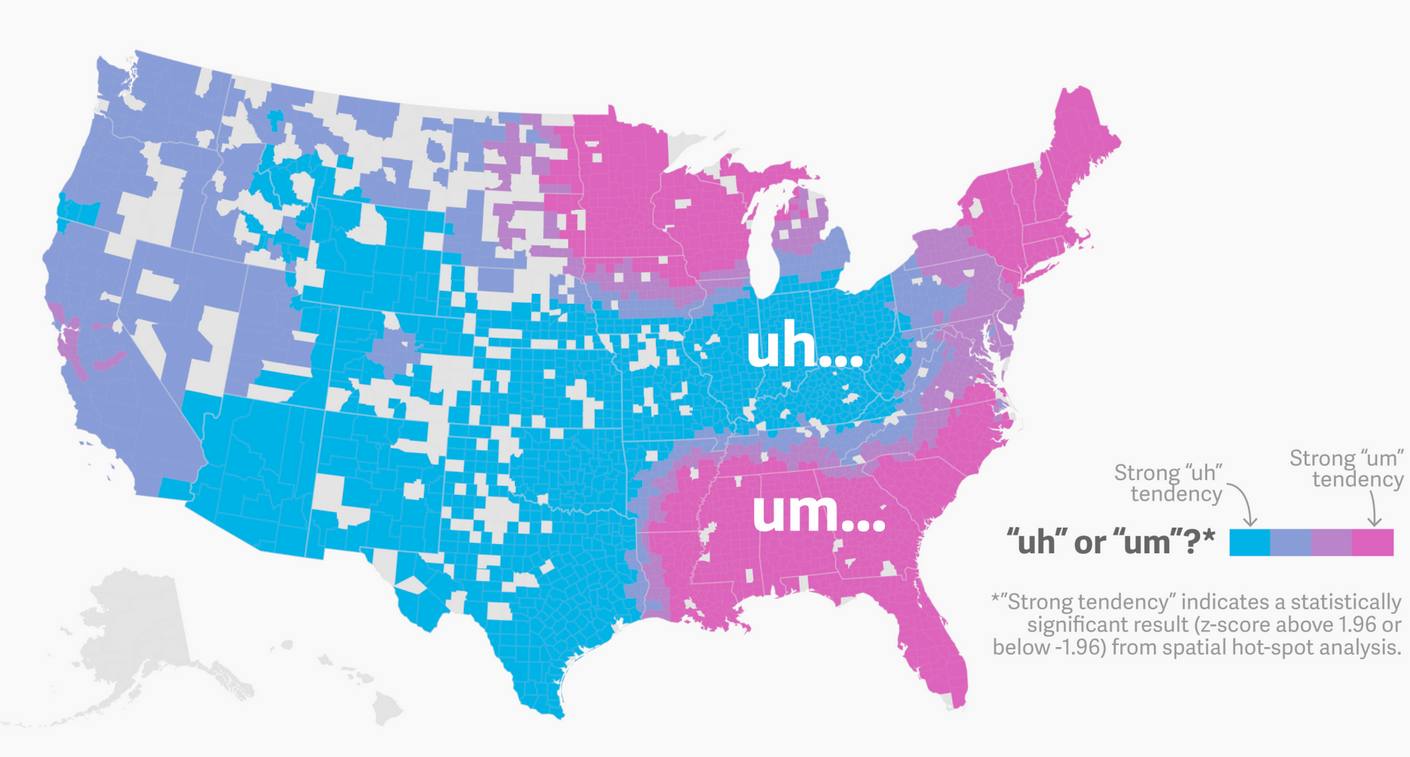
So today is Friday and that means it is time for some…um…lighter than usual content. Consequently we have a map from Quartz looking at the preferred use of um or uh.

Mapping the preference for Um or Uh

Credit for the piece goes to the Quartz graphics department.

Soda

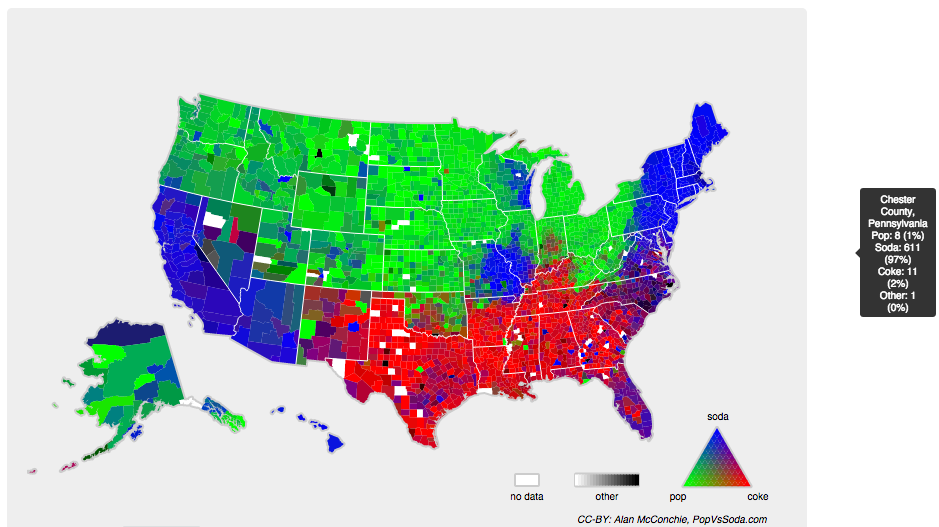
Happy Friday, everybody. I cannot say about you, but I certainly love seeing dialects and regional variations of words, phrases, pronunciations mapped out. So thankfully we have some work by Alan McConchie to look at today, specifically versus the soda vs. pop debate. As the screenshot shows, I come from a solidly soda camp. But I was reminded recently at a wedding that the Midwest is, generally speaking, pop country. Midwesterners have to learn to straighten that out.

It's soda in Chester County
It’s soda in Chester County

Credit for the piece goes to Alan McConchie.

The Curse(s) of the CEOs

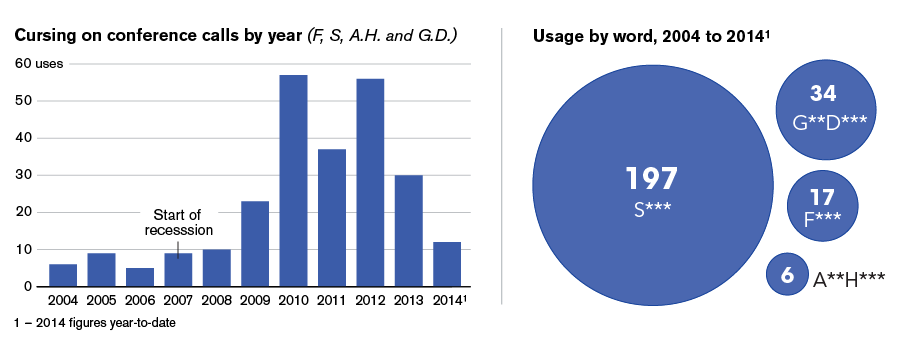
It’s Friday, so we should try to take things a bit lighter. For me that usually means knocking back a drink or two and a swear-y exultation about it being the end of the work week. But, it turns out, I’m just trying to emulate our captains of industry. Bloomberg has gone through company conference calls and tabulated the number of swear words used and charted the results. And for fun, you can read some of the excerpts.

They'll swear by it
They’ll swear by it

Credit for the piece goes to David Ingold, Keith Collins, and Jeff Green.

Linguistic Empires

One of the main arguments used by Vladimir Putin to support any possible intervention in Ukraine is the suppression of the rights of Russian language speakers. The Economist wisely decided to wholeheartedly endorse the underlying principle of Putin’s logic and redrew the world map accordingly. You should read the article.

Linguistic empires of the world

Credit for the piece goes to the Economist’s graphics department.