Everyone knows inflation is a thing. If not, when was the last time you went shopping? Last week the Boston Globe looked specifically at children’s shoes. I don’t have kids, but I can imagine how a rapidly growing miniature human requires numerous pairs of shoes and frequently. The article explores some of the factors going into the high price of shoes and uses, not very surprisingly, some line charts to show prices for components and the final product over time. But the piece also contains a few bar charts and that’s what I’d like to briefly discuss today, starting with the screenshot below.

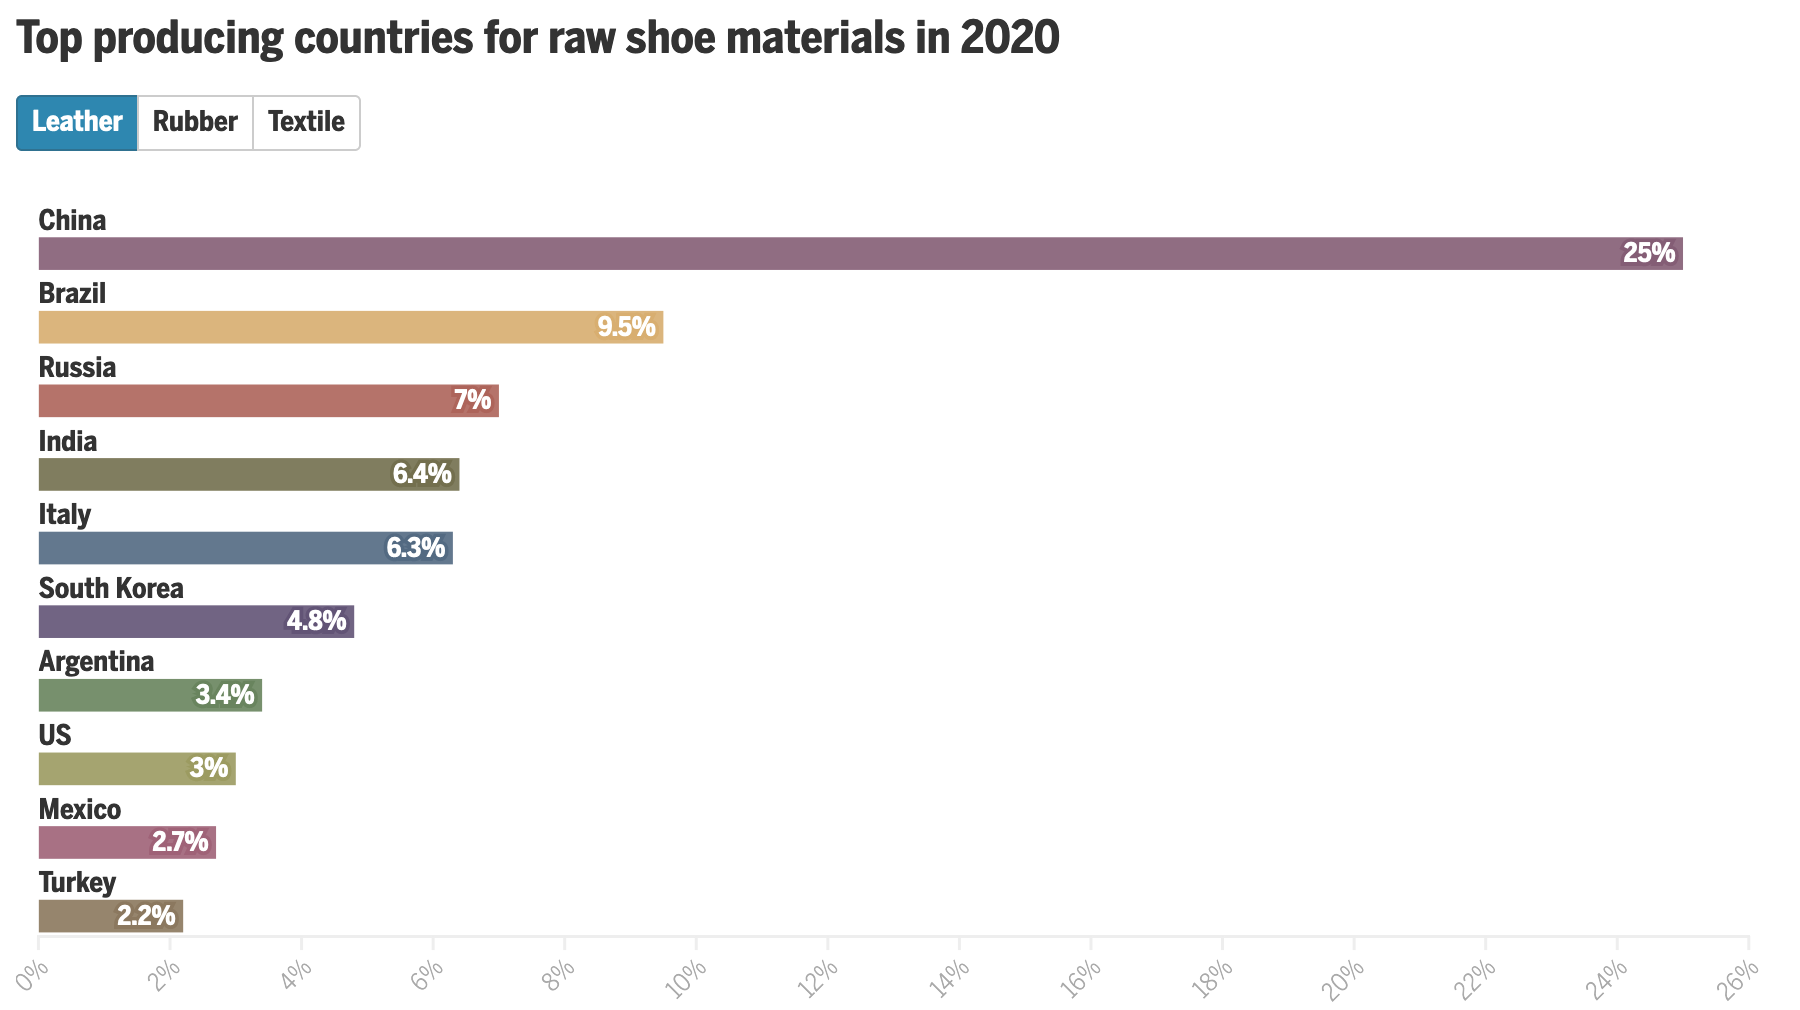
What we see here are a list of countries and the share of production for select inputs—leather, rubber, and textiles—in 2020. At the top we have a button that allows the user to toggle between the two and a little movement of the bars provides the transition. The length of the bar encodes the country in question’s market share for the selected material.
We also have all this colour, but what is it doing? What data point does the colour encode? Initially I thought perhaps geographic regions, but then you have the US and Mexico, or Italy and Russia, or Argentina and Brazil, all pairs of countries in the same geographic regions and yet all coloured differently. Colour encodes nothing and thus becomes a visual distraction that adds confusion.
Then we have the white spaces between the bars. The gap between bars is there because the country labels attach to the top of the bars. But, especially for the top of the chart, the labels are small and the gap is at just the right height such that the white spaces become white bars competing with the coloured bars for visual attention.
The spaces and the colours muddy the picture of what the data is trying to show. How do we know this? Because later in the article we get this chart.

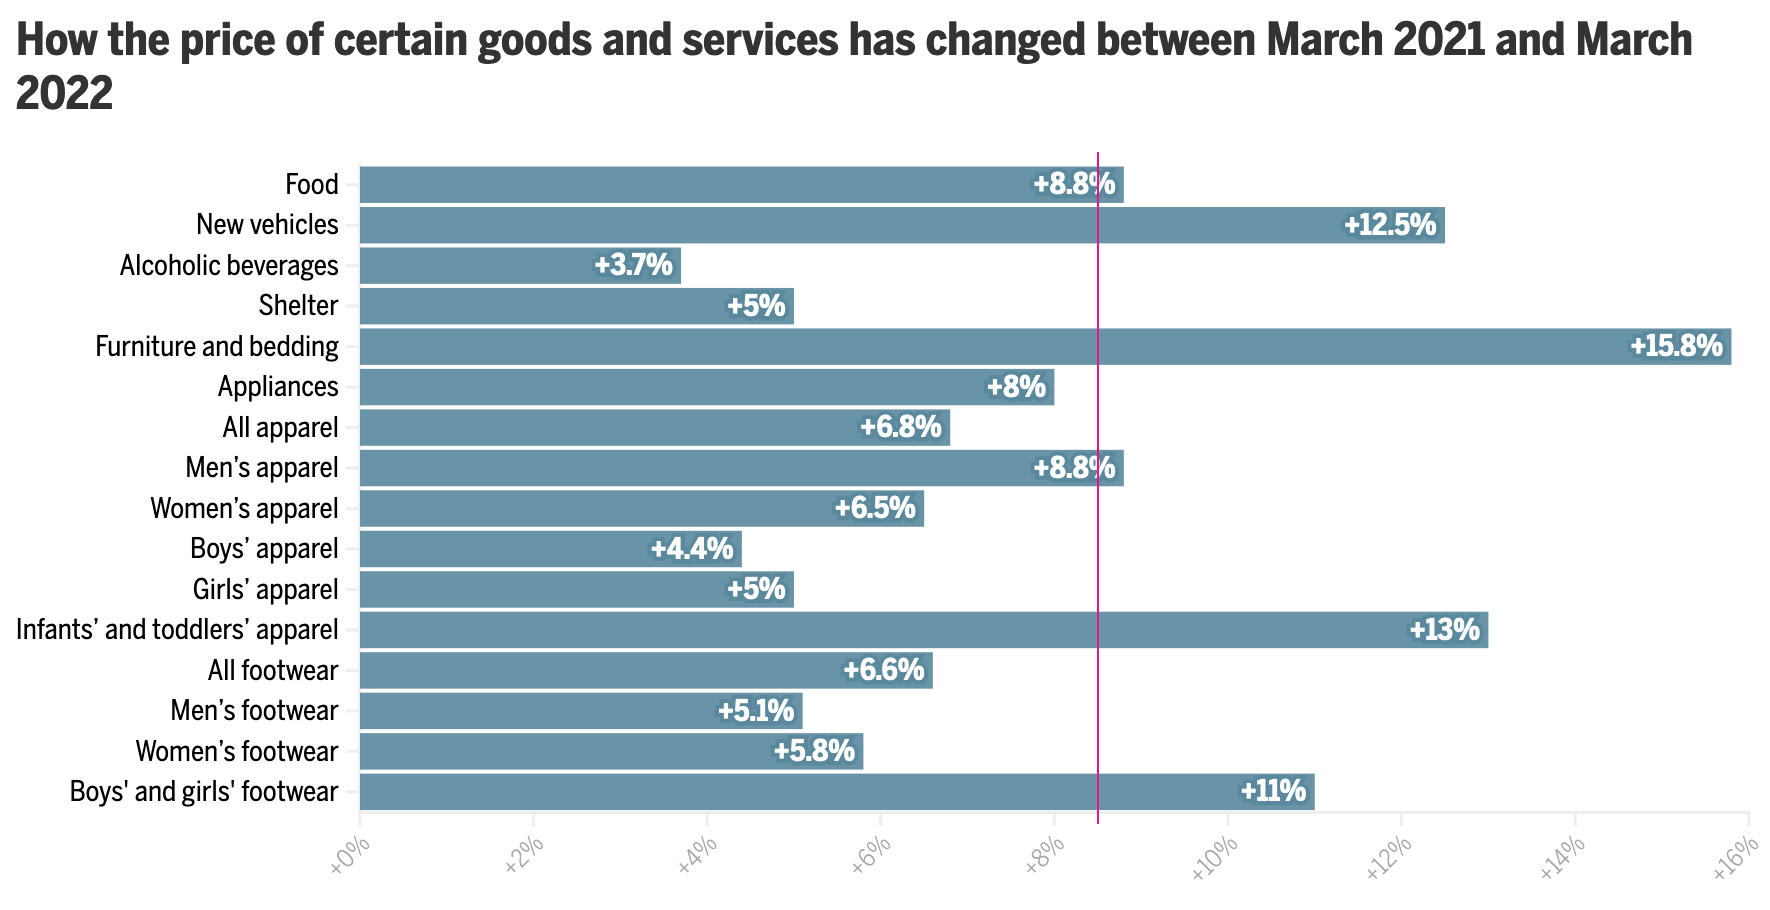
This works much better. The focus is on the bars, the labelling is clear, almost nothing else competes visually with the data. I have a few quibbles with this design as well, but it’s certainly an improvement over the earlier screenshot we discussed. (I should note that this graphic, as it does here, also comes after the earlier graphic.)
My biggest issue is that when I first look at the piece, I want to see it sorted, say greatest to least. In other words, Furniture and bedding sits at the top with its 15.8% increase, year-on-year, and then Alcoholic beverages last at 3.7%. The issue here, however, is that we are not necessarily looking at goods at the same hierarchical level.
The top of the list is pretty easy to consider: food, new vehicles, alcoholic beverages, shelter, furniture and bedding, and appliances. We can look at all those together. But then we have All apparel. And then immediately after that we have Men’s, Women’s, Boys’ , Girls’, and Infants’ and toddlers’ apparel. In other words, we are now looking at a subset of All apparel. All apparel is at the same level of Food or Shelter, but Men’s apparel is not.
At that point we would need to differentiate between the two, whilst also grouping them together, because the range of values for those different sub-apparel groups comprise the aggregate value for All apparel. And showing them all next to Food is not an apples-to-apples comparison.
If I were to sort these, I would sort by from greatest to least by the parent group and then immediately beneath the parent I would display the children. To differentiate between parent-level and children-level, I would probably make the bars shorter in the vertical and then address the different levels typographically with the labels, maybe with smaller type or by putting the children in italic.
Finally, again, whilst this is a massive improvement over the earlier graphic, I’d make one more addition, an addition that would also help the first graphic. As we are talking about inflation year-on-year, we can see how much greater costs are from Furniture and bedding to Alcoholic beverages and that very much is part of the story. But what is the inflation rate overall?
According to the Bureau of Labour Statistics, inflation over that period was 8.5%. In other words, a number of the categories above actually saw price increases less than the average inflation rate—that’s good—even though they were probably higher than increases had been prior to the pandemic—that’s bad. But, more importantly for this story, with the addition of a benchmark line running vertically at 8.5%, we could see how almost all apparel and footwear child-level line items were below the inflation rate. But the children and infant level items far exceeded that benchmark line, hence the point of the article. I made a quick edit to the screenshot to show how that could work in theory.

Overall, an interesting article worth reading, but it contained one graphic in need of some additional work and then a second that, with a few improvements, would have been a better fit for the article’s story.
Credit for the piece goes to Daigo Fujiwara.


