Tag: infographic
-
Choo Choo
I took two weeks off as work was pretty crazy, but we’re back to covering data visualisation and design with a graphic about trains. And anybody who knows me knows how I love trains. One of the early acts of the Biden administration was funding a proper expansion of rail service in the United States.…
-
Turn Down the Heat
First, as we all should know, climate change is real. Now that does not mean that the temperature will always be warmer, it just means more extreme. So in winter we could have more severe cold temperatures and in hurricane season more powerful storms. But it does mean that in the summer we could have…
-
New Mexico Burns
Editor’s note: I was having some technical issues last week. This was supposed to post last week. Editor’s note two: This was supposed to go up on Monday. Still didn’t. Third time’s the charm? Yesterday I wrote about a piece from the New York Times that arrived on my doorstep Saturday morning. Well a few…
-
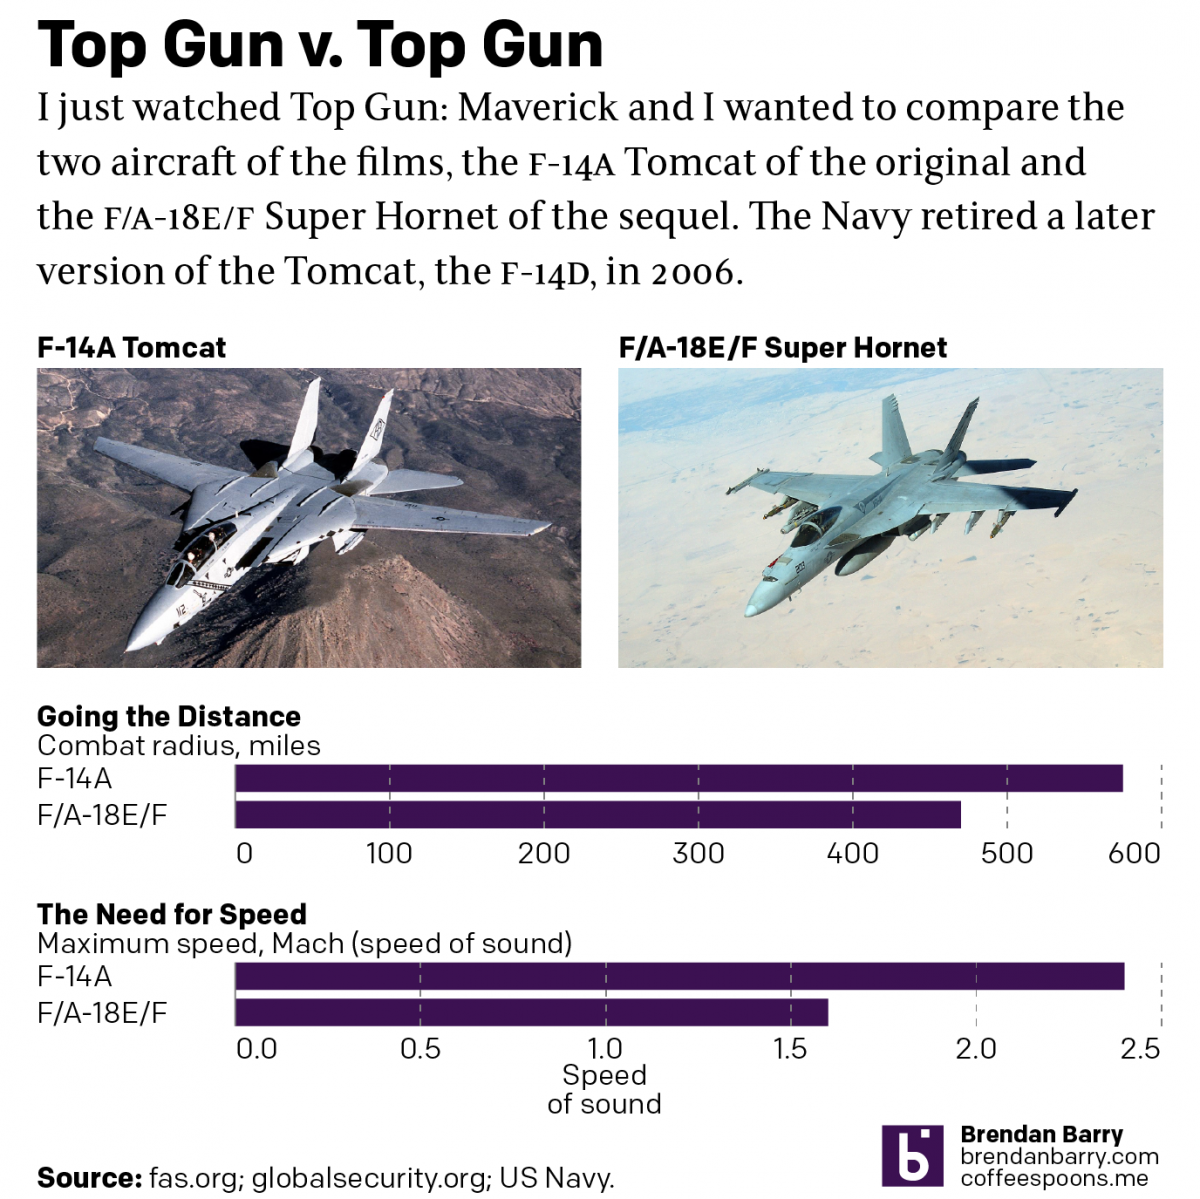
Top Gun
Last night I went to see Top Gun: Maverick, the sequel to the 1986 film Top Gun. Don’t worry, no spoilers here. But for those that don’t know, the first film starred Tom Cruise as a naval aviator, pilot, who flew around in F-14 Tomcats learning to become an expert dogfighter. Top Gun is the…
-
The Observation Table
We made it to the end of yet another week. Before the weekend begins for most of my audience—though for my UK readers, enjoy the extended bank holiday and God save the Queen—I wanted to take a look at a graphic from xkcd that shows one can use different types of scopes to make different…
-
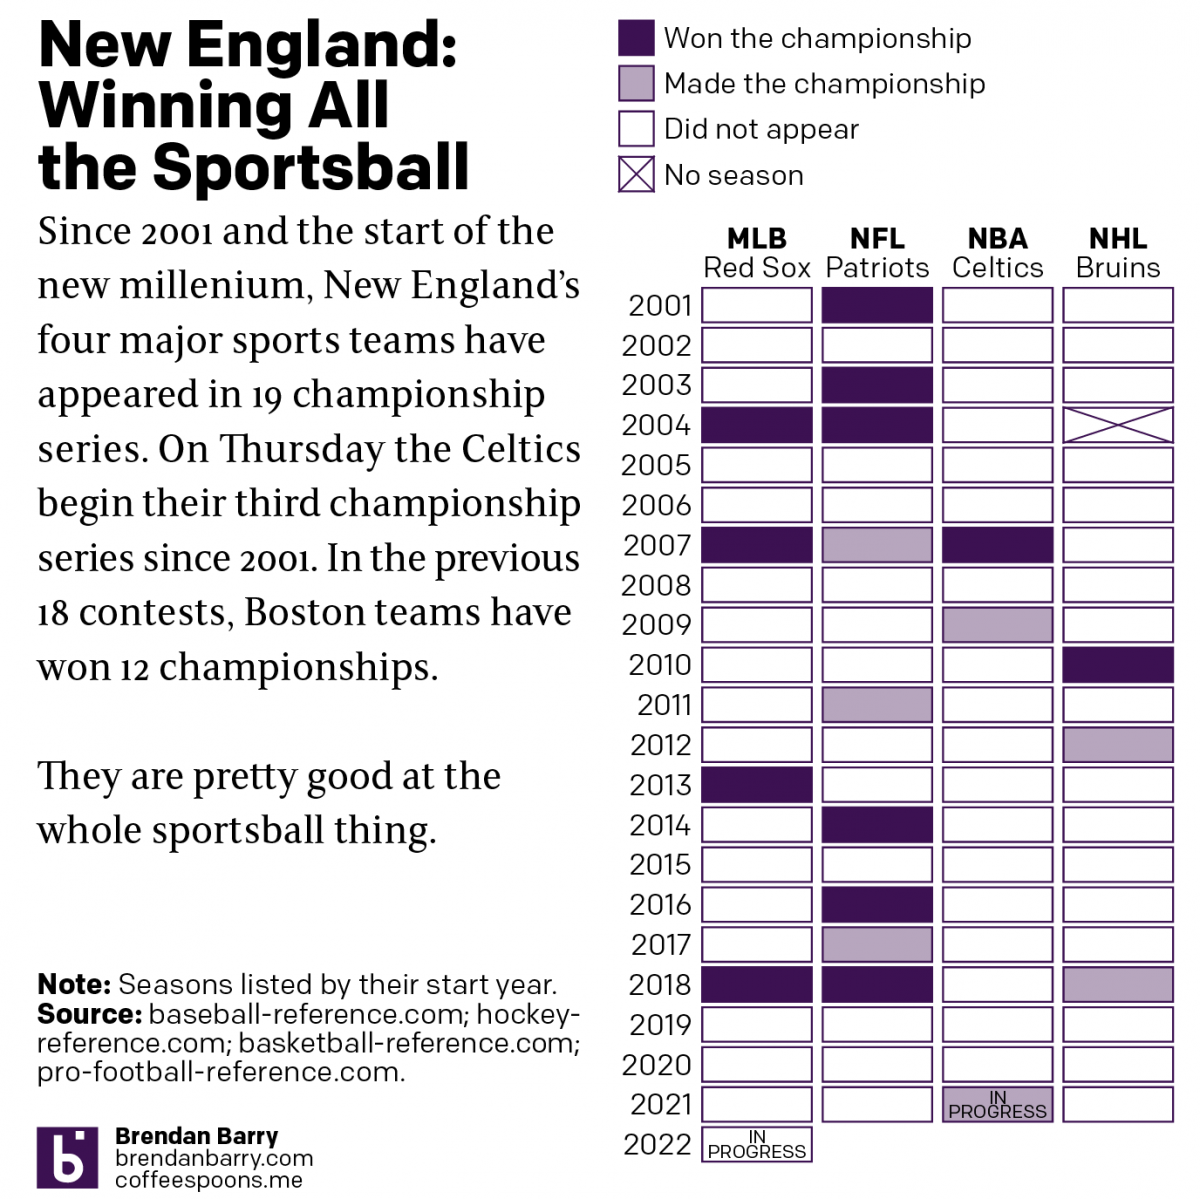
Boston: Sportstown of the 21st Century
Tonight the Boston Celtics play in Game 1 of the NBA Finals against the Golden State Warriors, one of the most dominant NBA teams over the last several years. But since the start of the new century and the new millennium, more broadly Boston’s four major sports teams have dominated the championship series of those…
-
Hidden Cities in the Amazon
Who did not like Indiana Jones growing up as a kid? Or better yet, stories of explorers like Heinrich Schliemann, who discovered the lost city of Troy? The ancient world boasted a number of civilisations that no longer exist. But not all lost civilisations date back thousands of years. A recent article in Nature details…